Chelsea, MI Map & Demographics
Chelsea Map
Chelsea Overview
$50,479
PER CAPITA INCOME
$135,685
AVG FAMILY INCOME
$71,379
AVG HOUSEHOLD INCOME
38.0%
WAGE / INCOME GAP [ % ]
62.0¢/ $1
WAGE / INCOME GAP [ $ ]
0.44
INEQUALITY / GINI INDEX
5,440
TOTAL POPULATION
2,506
MALE POPULATION
2,934
FEMALE POPULATION
85.41
MALES / 100 FEMALES
117.08
FEMALES / 100 MALES
50.1
MEDIAN AGE
2.9
AVG FAMILY SIZE
2.0
AVG HOUSEHOLD SIZE
2,530
LABOR FORCE [ PEOPLE ]
54.5%
PERCENT IN LABOR FORCE
1.3%
UNEMPLOYMENT RATE
Chelsea Zip Codes
Chelsea Area Codes
Income in Chelsea
Income Overview in Chelsea
Per Capita Income in Chelsea is $50,479, while median incomes of families and households are $135,685 and $71,379 respectively.
| Characteristic | Number | Measure |
| Per Capita Income | 5,440 | $50,479 |
| Median Family Income | 1,389 | $135,685 |
| Mean Family Income | 1,389 | $147,904 |
| Median Household Income | 2,617 | $71,379 |
| Mean Household Income | 2,617 | $102,580 |
| Income Deficit | 1,389 | $0 |
| Wage / Income Gap (%) | 5,440 | 37.99% |
| Wage / Income Gap ($) | 5,440 | 62.01¢ per $1 |
| Gini / Inequality Index | 5,440 | 0.44 |
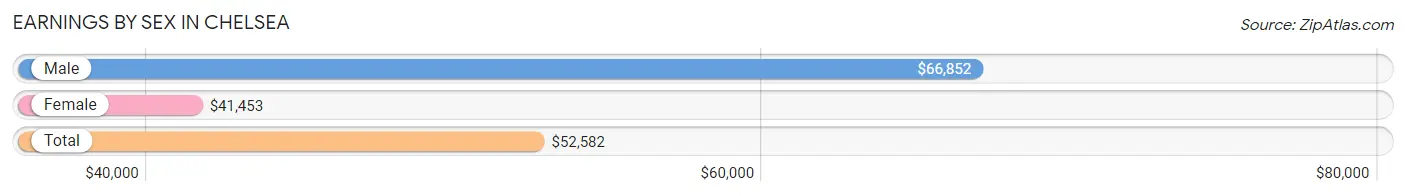
Earnings by Sex in Chelsea
Average Earnings in Chelsea are $52,582, $66,852 for men and $41,453 for women, a difference of 38.0%.
| Sex | Number | Average Earnings |
| Male | 1,346 (49.4%) | $66,852 |
| Female | 1,381 (50.6%) | $41,453 |
| Total | 2,727 (100.0%) | $52,582 |
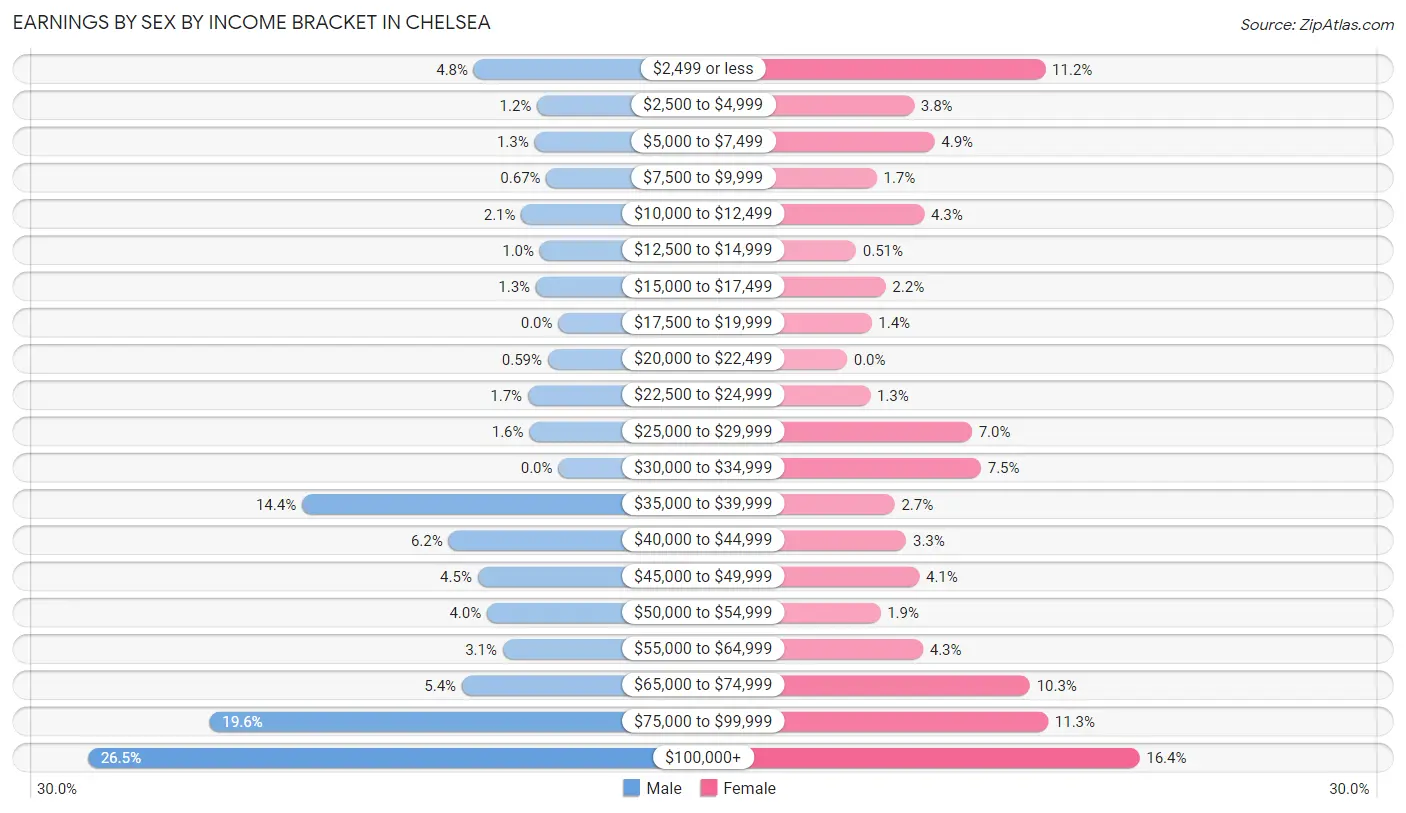
Earnings by Sex by Income Bracket in Chelsea
The most common earnings brackets in Chelsea are $100,000+ for men (356 | 26.5%) and $100,000+ for women (227 | 16.4%).
| Income | Male | Female |
| $2,499 or less | 64 (4.8%) | 154 (11.2%) |
| $2,500 to $4,999 | 16 (1.2%) | 52 (3.8%) |
| $5,000 to $7,499 | 18 (1.3%) | 68 (4.9%) |
| $7,500 to $9,999 | 9 (0.7%) | 23 (1.7%) |
| $10,000 to $12,499 | 28 (2.1%) | 60 (4.3%) |
| $12,500 to $14,999 | 14 (1.0%) | 7 (0.5%) |
| $15,000 to $17,499 | 17 (1.3%) | 30 (2.2%) |
| $17,500 to $19,999 | 0 (0.0%) | 19 (1.4%) |
| $20,000 to $22,499 | 8 (0.6%) | 0 (0.0%) |
| $22,500 to $24,999 | 23 (1.7%) | 18 (1.3%) |
| $25,000 to $29,999 | 22 (1.6%) | 97 (7.0%) |
| $30,000 to $34,999 | 0 (0.0%) | 104 (7.5%) |
| $35,000 to $39,999 | 194 (14.4%) | 37 (2.7%) |
| $40,000 to $44,999 | 83 (6.2%) | 46 (3.3%) |
| $45,000 to $49,999 | 61 (4.5%) | 56 (4.1%) |
| $50,000 to $54,999 | 54 (4.0%) | 26 (1.9%) |
| $55,000 to $64,999 | 42 (3.1%) | 59 (4.3%) |
| $65,000 to $74,999 | 73 (5.4%) | 142 (10.3%) |
| $75,000 to $99,999 | 264 (19.6%) | 156 (11.3%) |
| $100,000+ | 356 (26.5%) | 227 (16.4%) |
| Total | 1,346 (100.0%) | 1,381 (100.0%) |
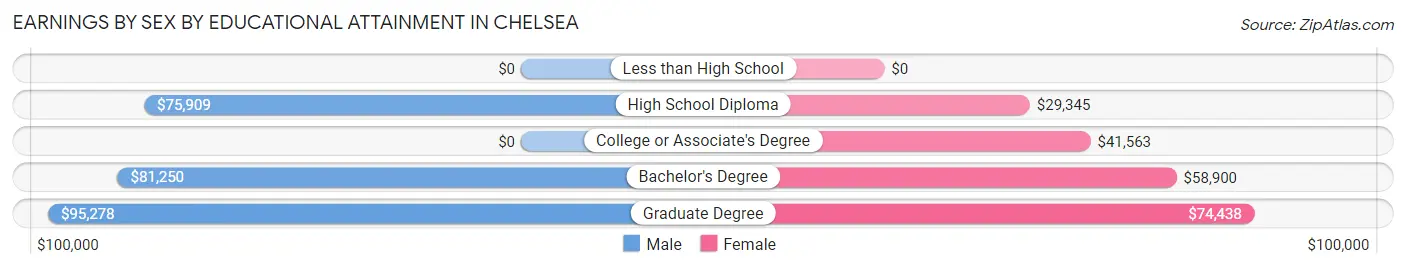
Earnings by Sex by Educational Attainment in Chelsea
Average earnings in Chelsea are $71,940 for men and $55,341 for women, a difference of 23.1%. Men with an educational attainment of graduate degree enjoy the highest average annual earnings of $95,278, while those with high school diploma education earn the least with $75,909. Women with an educational attainment of graduate degree earn the most with the average annual earnings of $74,438, while those with high school diploma education have the smallest earnings of $29,345.
| Educational Attainment | Male Income | Female Income |
| Less than High School | - | - |
| High School Diploma | $75,909 | $29,345 |
| College or Associate's Degree | - | - |
| Bachelor's Degree | $81,250 | $58,900 |
| Graduate Degree | $95,278 | $74,438 |
| Total | $71,940 | $55,341 |
Family Income in Chelsea
Family Income Brackets in Chelsea
According to the Chelsea family income data, there are 306 families falling into the $200,000+ income range, which is the most common income bracket and makes up 22.0% of all families.
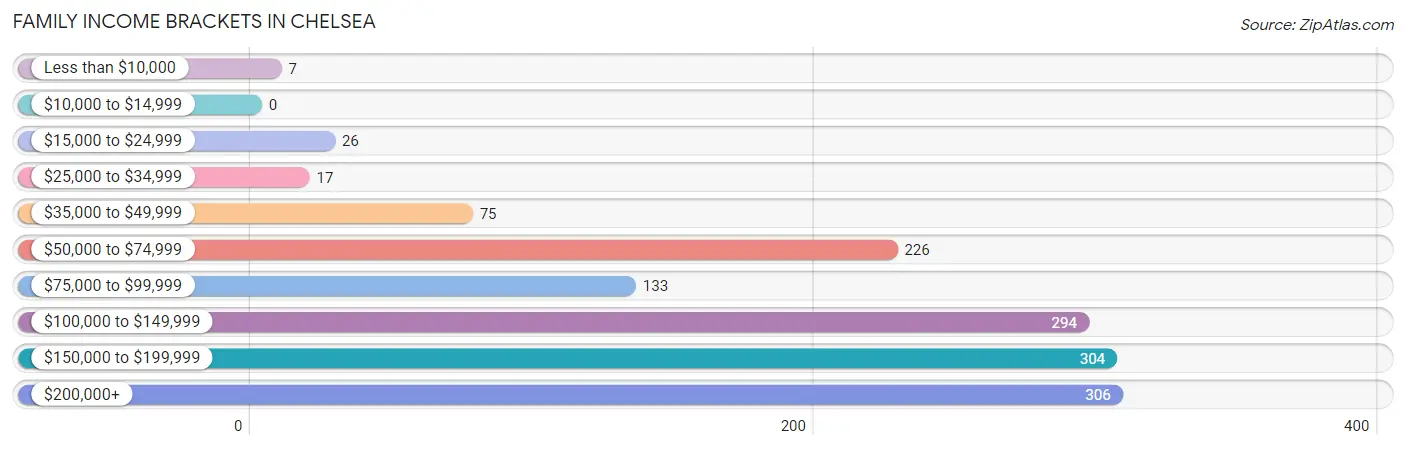
| Income Bracket | # Families | % Families |
| Less than $10,000 | 7 | 0.5% |
| $10,000 to $14,999 | 0 | 0.0% |
| $15,000 to $24,999 | 26 | 1.9% |
| $25,000 to $34,999 | 17 | 1.2% |
| $35,000 to $49,999 | 75 | 5.4% |
| $50,000 to $74,999 | 226 | 16.3% |
| $75,000 to $99,999 | 133 | 9.6% |
| $100,000 to $149,999 | 294 | 21.2% |
| $150,000 to $199,999 | 304 | 21.9% |
| $200,000+ | 306 | 22.0% |
Family Income by Famaliy Size in Chelsea
4-person families (360 | 25.9%) account for the highest median family income in Chelsea with $151,579 per family, while 2-person families (703 | 50.6%) have the highest median income of $60,547 per family member.
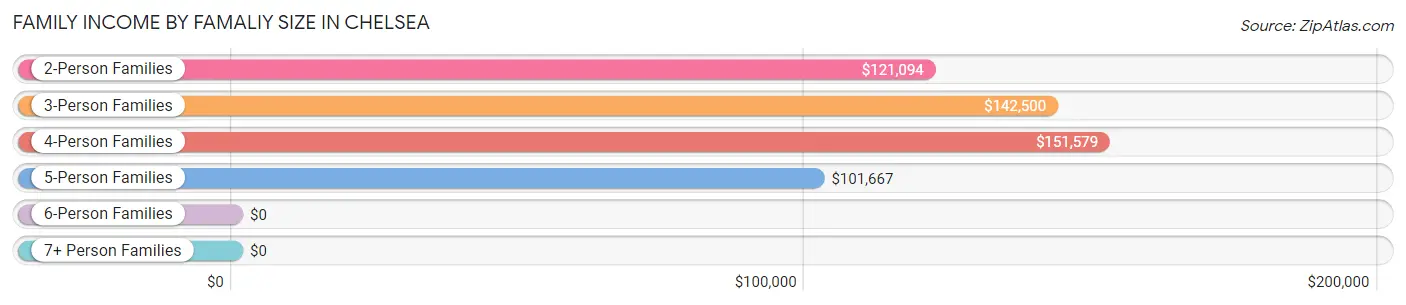
| Income Bracket | # Families | Median Income |
| 2-Person Families | 703 (50.6%) | $121,094 |
| 3-Person Families | 256 (18.4%) | $142,500 |
| 4-Person Families | 360 (25.9%) | $151,579 |
| 5-Person Families | 60 (4.3%) | $101,667 |
| 6-Person Families | 10 (0.7%) | $0 |
| 7+ Person Families | 0 (0.0%) | $0 |
| Total | 1,389 (100.0%) | $135,685 |
Family Income by Number of Earners in Chelsea
The median family income in Chelsea is $135,685, with families comprising 2 earners (724) having the highest median family income of $169,091, while families with no earners (274) have the lowest median family income of $76,923, accounting for 52.1% and 19.7% of families, respectively.
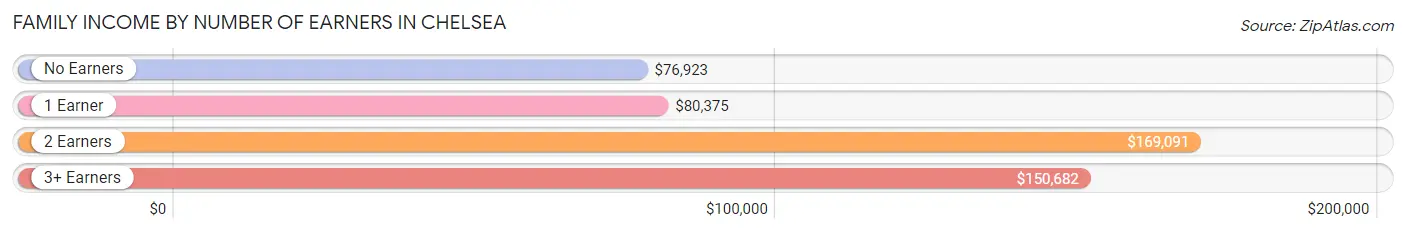
| Number of Earners | # Families | Median Income |
| No Earners | 274 (19.7%) | $76,923 |
| 1 Earner | 225 (16.2%) | $80,375 |
| 2 Earners | 724 (52.1%) | $169,091 |
| 3+ Earners | 166 (11.9%) | $150,682 |
| Total | 1,389 (100.0%) | $135,685 |
Household Income in Chelsea
Household Income Brackets in Chelsea
With 539 households falling in the category, the $50,000 to $74,999 income range is the most frequent in Chelsea, accounting for 20.6% of all households. In contrast, only 24 households (0.9%) fall into the $10,000 to $14,999 income bracket, making it the least populous group.
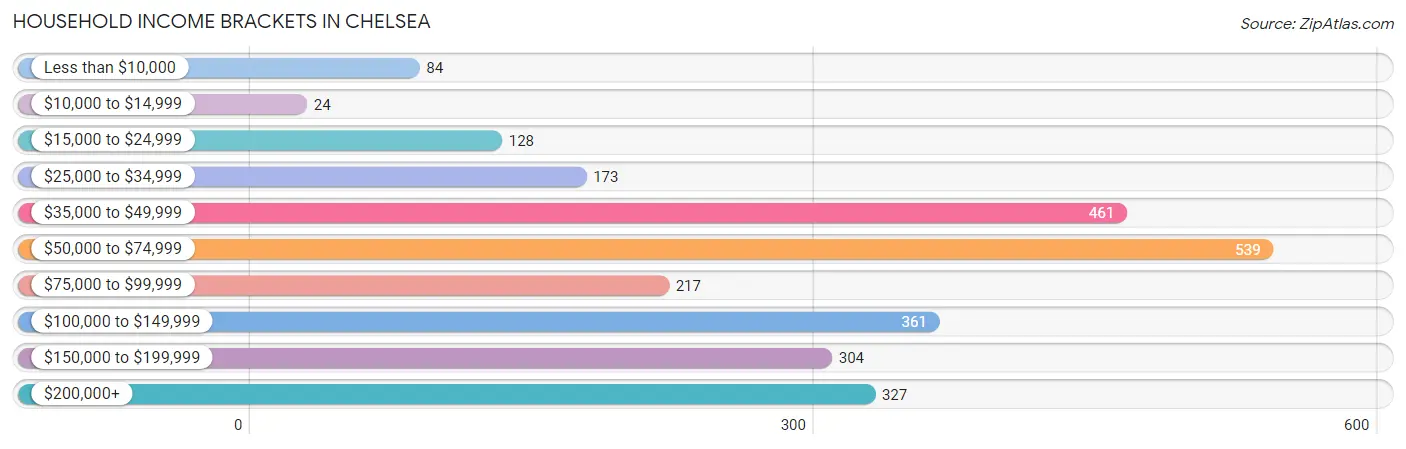
| Income Bracket | # Households | % Households |
| Less than $10,000 | 84 | 3.2% |
| $10,000 to $14,999 | 24 | 0.9% |
| $15,000 to $24,999 | 128 | 4.9% |
| $25,000 to $34,999 | 173 | 6.6% |
| $35,000 to $49,999 | 461 | 17.6% |
| $50,000 to $74,999 | 539 | 20.6% |
| $75,000 to $99,999 | 217 | 8.3% |
| $100,000 to $149,999 | 361 | 13.8% |
| $150,000 to $199,999 | 304 | 11.6% |
| $200,000+ | 327 | 12.5% |
Household Income by Householder Age in Chelsea
The median household income in Chelsea is $71,379, with the highest median household income of $122,188 found in the 45 to 64 years age bracket for the primary householder. A total of 786 households (30.0%) fall into this category. Meanwhile, the 15 to 24 years age bracket for the primary householder has the lowest median household income of $0, with 17 households (0.6%) in this group.
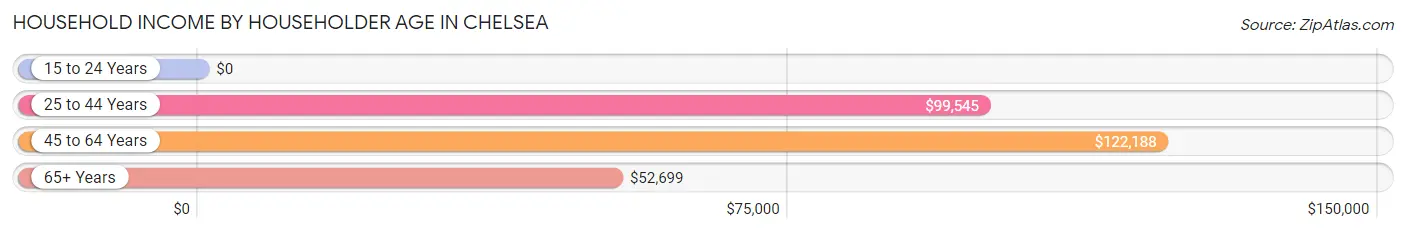
| Income Bracket | # Households | Median Income |
| 15 to 24 Years | 17 (0.6%) | $0 |
| 25 to 44 Years | 638 (24.4%) | $99,545 |
| 45 to 64 Years | 786 (30.0%) | $122,188 |
| 65+ Years | 1,176 (44.9%) | $52,699 |
| Total | 2,617 (100.0%) | $71,379 |
Poverty in Chelsea
Income Below Poverty by Sex and Age in Chelsea
With 1.6% poverty level for males and 4.8% for females among the residents of Chelsea, 65 to 74 year old males and 15 year old females are the most vulnerable to poverty, with 20 males (6.5%) and 5 females (23.8%) in their respective age groups living below the poverty level.
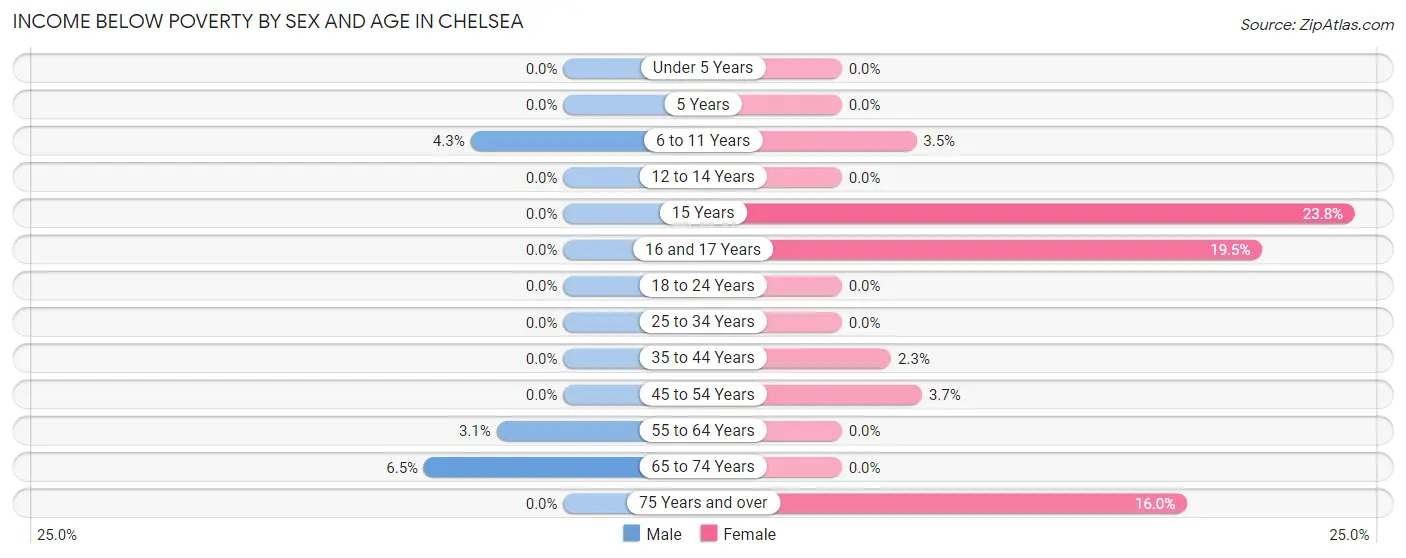
| Age Bracket | Male | Female |
| Under 5 Years | 0 (0.0%) | 0 (0.0%) |
| 5 Years | 0 (0.0%) | 0 (0.0%) |
| 6 to 11 Years | 9 (4.3%) | 8 (3.5%) |
| 12 to 14 Years | 0 (0.0%) | 0 (0.0%) |
| 15 Years | 0 (0.0%) | 5 (23.8%) |
| 16 and 17 Years | 0 (0.0%) | 8 (19.5%) |
| 18 to 24 Years | 0 (0.0%) | 0 (0.0%) |
| 25 to 34 Years | 0 (0.0%) | 0 (0.0%) |
| 35 to 44 Years | 0 (0.0%) | 7 (2.3%) |
| 45 to 54 Years | 0 (0.0%) | 11 (3.7%) |
| 55 to 64 Years | 9 (3.1%) | 0 (0.0%) |
| 65 to 74 Years | 20 (6.5%) | 0 (0.0%) |
| 75 Years and over | 0 (0.0%) | 99 (16.0%) |
| Total | 38 (1.6%) | 138 (4.8%) |
Income Above Poverty by Sex and Age in Chelsea
According to the poverty statistics in Chelsea, males aged under 5 years and females aged under 5 years are the age groups that are most secure financially, with 100.0% of males and 100.0% of females in these age groups living above the poverty line.
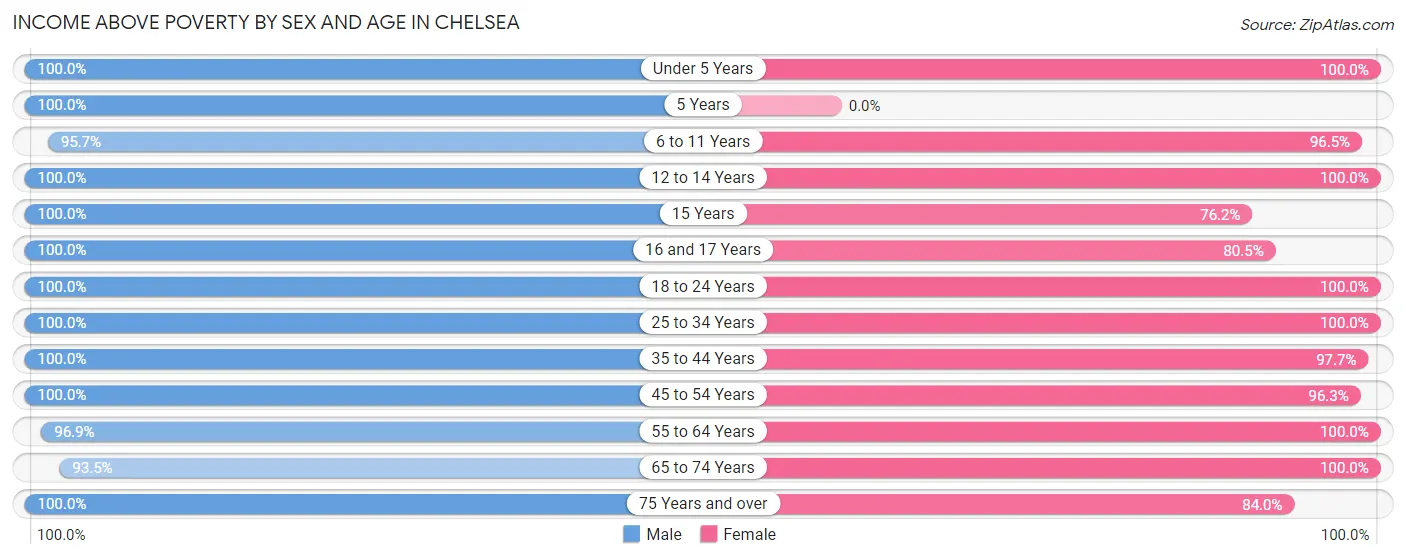
| Age Bracket | Male | Female |
| Under 5 Years | 68 (100.0%) | 99 (100.0%) |
| 5 Years | 37 (100.0%) | 0 (0.0%) |
| 6 to 11 Years | 200 (95.7%) | 223 (96.5%) |
| 12 to 14 Years | 61 (100.0%) | 47 (100.0%) |
| 15 Years | 24 (100.0%) | 16 (76.2%) |
| 16 and 17 Years | 84 (100.0%) | 33 (80.5%) |
| 18 to 24 Years | 137 (100.0%) | 201 (100.0%) |
| 25 to 34 Years | 323 (100.0%) | 226 (100.0%) |
| 35 to 44 Years | 310 (100.0%) | 299 (97.7%) |
| 45 to 54 Years | 281 (100.0%) | 285 (96.3%) |
| 55 to 64 Years | 281 (96.9%) | 417 (100.0%) |
| 65 to 74 Years | 289 (93.5%) | 358 (100.0%) |
| 75 Years and over | 302 (100.0%) | 519 (84.0%) |
| Total | 2,397 (98.4%) | 2,723 (95.2%) |
Income Below Poverty Among Married-Couple Families in Chelsea
The poverty statistics for married-couple families in Chelsea show that 0.7% or 9 of the total 1,221 families live below the poverty line. Families with no children have the highest poverty rate of 1.2%, comprising of 9 families. On the other hand, families with 1 or 2 children have the lowest poverty rate of 0.0%, which includes 0 families.
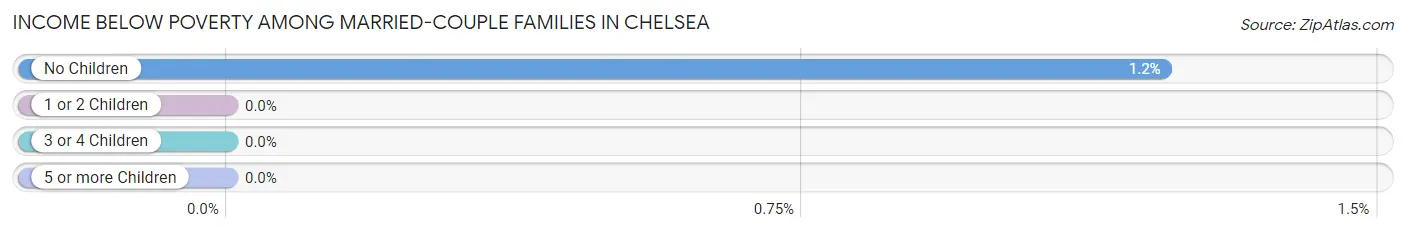
| Children | Above Poverty | Below Poverty |
| No Children | 727 (98.8%) | 9 (1.2%) |
| 1 or 2 Children | 440 (100.0%) | 0 (0.0%) |
| 3 or 4 Children | 45 (100.0%) | 0 (0.0%) |
| 5 or more Children | 0 (0.0%) | 0 (0.0%) |
| Total | 1,212 (99.3%) | 9 (0.7%) |
Income Below Poverty Among Single-Parent Households in Chelsea
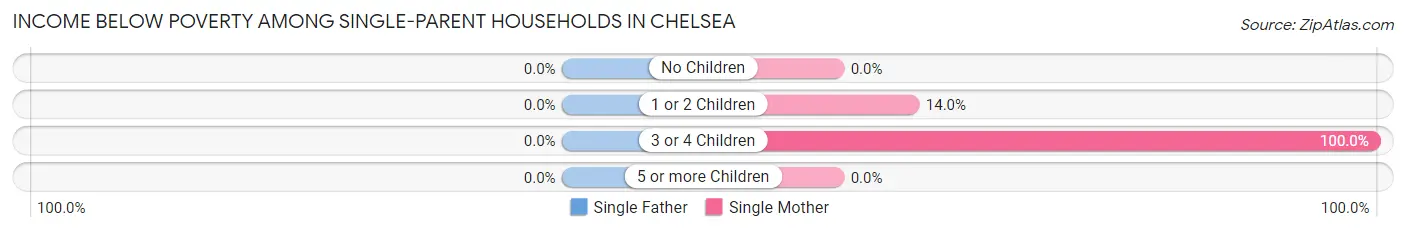
| Children | Single Father | Single Mother |
| No Children | 0 (0.0%) | 0 (0.0%) |
| 1 or 2 Children | 0 (0.0%) | 7 (14.0%) |
| 3 or 4 Children | 0 (0.0%) | 4 (100.0%) |
| 5 or more Children | 0 (0.0%) | 0 (0.0%) |
| Total | 0 (0.0%) | 11 (10.6%) |
Income Below Poverty Among Married-Couple vs Single-Parent Households in Chelsea
The poverty data for Chelsea shows that 9 of the married-couple family households (0.7%) and 11 of the single-parent households (6.6%) are living below the poverty level. Within the married-couple family households, those with no children have the highest poverty rate, with 9 households (1.2%) falling below the poverty line. Among the single-parent households, those with 3 or 4 children have the highest poverty rate, with 4 household (100.0%) living below poverty.
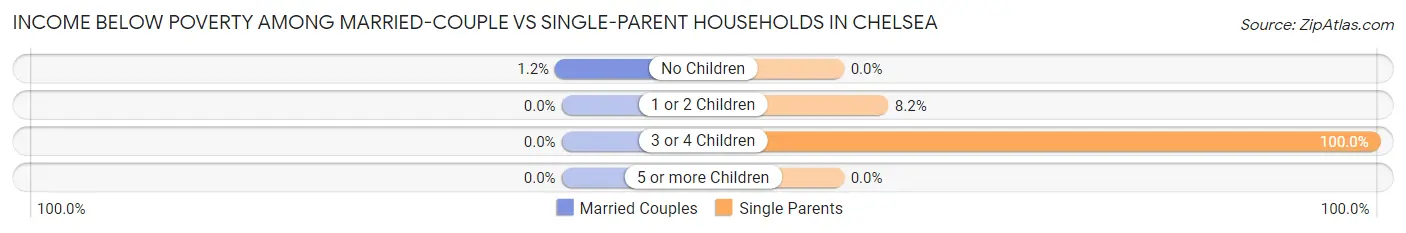
| Children | Married-Couple Families | Single-Parent Households |
| No Children | 9 (1.2%) | 0 (0.0%) |
| 1 or 2 Children | 0 (0.0%) | 7 (8.2%) |
| 3 or 4 Children | 0 (0.0%) | 4 (100.0%) |
| 5 or more Children | 0 (0.0%) | 0 (0.0%) |
| Total | 9 (0.7%) | 11 (6.6%) |
Race in Chelsea
The most populous races in Chelsea are White / Caucasian (5,204 | 95.7%), Two or more Races (156 | 2.9%), and Hispanic or Latino (64 | 1.2%).
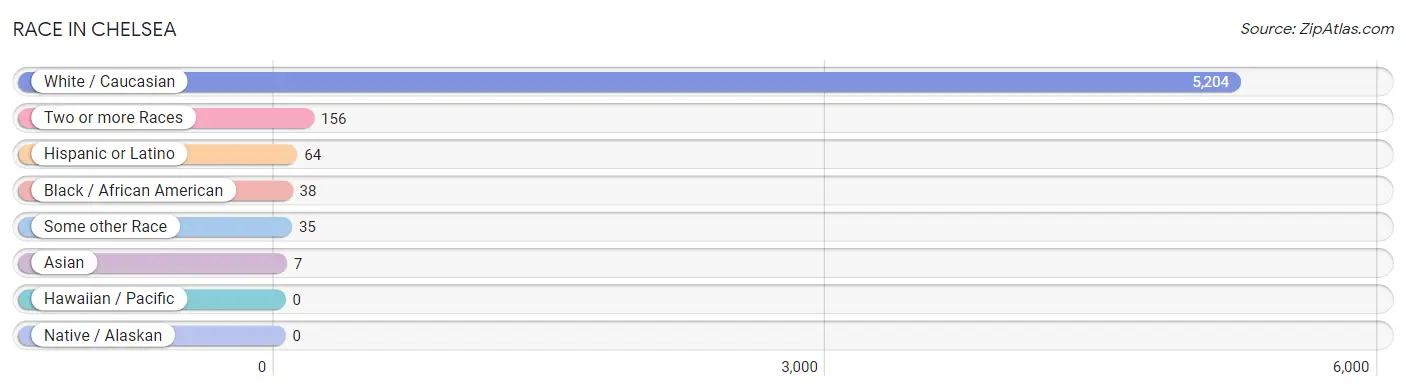
| Race | # Population | % Population |
| Asian | 7 | 0.1% |
| Black / African American | 38 | 0.7% |
| Hawaiian / Pacific | 0 | 0.0% |
| Hispanic or Latino | 64 | 1.2% |
| Native / Alaskan | 0 | 0.0% |
| White / Caucasian | 5,204 | 95.7% |
| Two or more Races | 156 | 2.9% |
| Some other Race | 35 | 0.6% |
| Total | 5,440 | 100.0% |
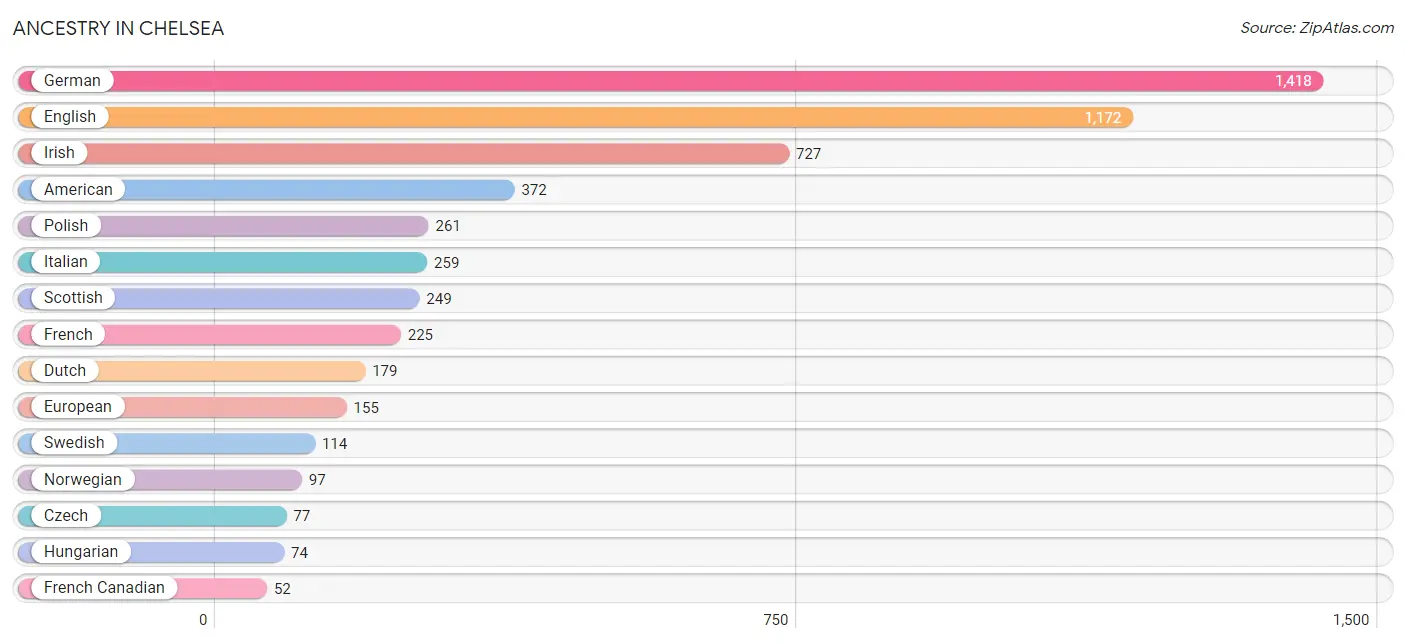
Ancestry in Chelsea
The most populous ancestries reported in Chelsea are German (1,418 | 26.1%), English (1,172 | 21.5%), Irish (727 | 13.4%), American (372 | 6.8%), and Polish (261 | 4.8%), together accounting for 72.6% of all Chelsea residents.
| Ancestry | # Population | % Population |
| Alaskan Athabascan | 30 | 0.5% |
| American | 372 | 6.8% |
| Arab | 13 | 0.2% |
| Armenian | 19 | 0.4% |
| Belgian | 32 | 0.6% |
| Blackfeet | 5 | 0.1% |
| British | 18 | 0.3% |
| Canadian | 16 | 0.3% |
| Cherokee | 5 | 0.1% |
| Croatian | 11 | 0.2% |
| Cuban | 12 | 0.2% |
| Czech | 77 | 1.4% |
| Danish | 14 | 0.3% |
| Dutch | 179 | 3.3% |
| Eastern European | 7 | 0.1% |
| English | 1,172 | 21.5% |
| European | 155 | 2.9% |
| Finnish | 50 | 0.9% |
| French | 225 | 4.1% |
| French Canadian | 52 | 1.0% |
| German | 1,418 | 26.1% |
| Greek | 12 | 0.2% |
| Hungarian | 74 | 1.4% |
| Iraqi | 10 | 0.2% |
| Irish | 727 | 13.4% |
| Italian | 259 | 4.8% |
| Korean | 34 | 0.6% |
| Lithuanian | 49 | 0.9% |
| Macedonian | 5 | 0.1% |
| Maltese | 31 | 0.6% |
| Mexican | 52 | 1.0% |
| Norwegian | 97 | 1.8% |
| Polish | 261 | 4.8% |
| Russian | 8 | 0.2% |
| Scotch-Irish | 36 | 0.7% |
| Scottish | 249 | 4.6% |
| Sioux | 10 | 0.2% |
| Slovak | 7 | 0.1% |
| Subsaharan African | 18 | 0.3% |
| Swedish | 114 | 2.1% |
| Swiss | 17 | 0.3% |
| Ukrainian | 22 | 0.4% |
| Welsh | 49 | 0.9% | View All 43 Rows |
Immigrants in Chelsea
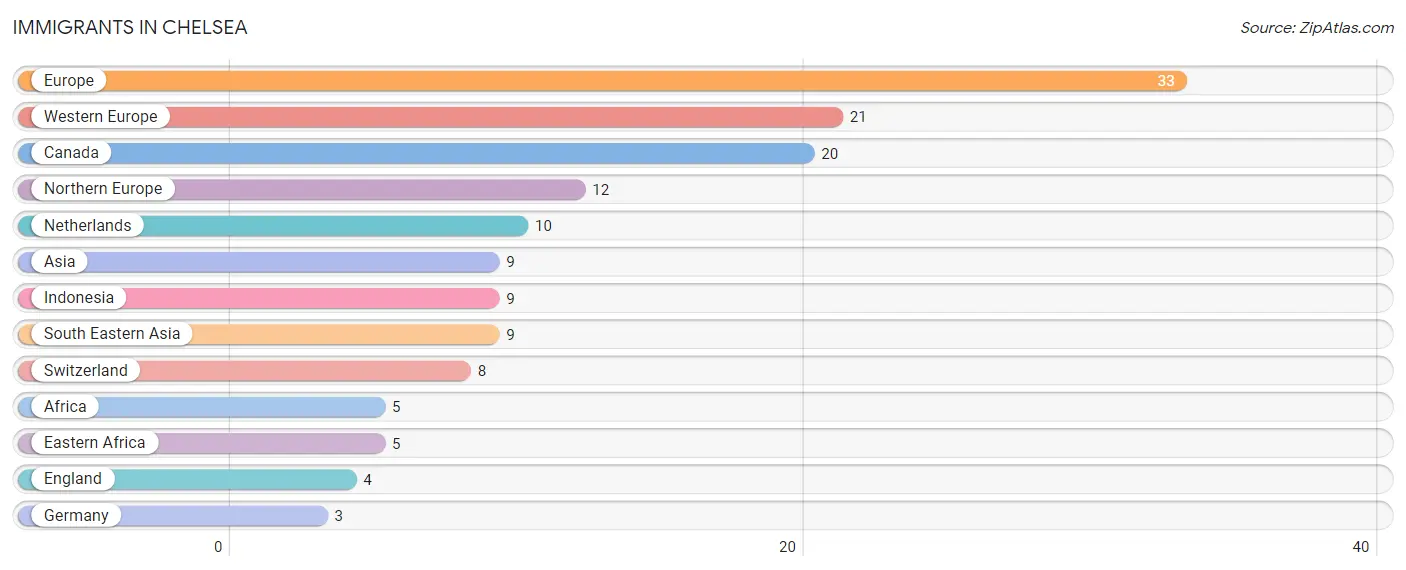
The most numerous immigrant groups reported in Chelsea came from Europe (33 | 0.6%), Western Europe (21 | 0.4%), Canada (20 | 0.4%), Northern Europe (12 | 0.2%), and Netherlands (10 | 0.2%), together accounting for 1.8% of all Chelsea residents.
| Immigration Origin | # Population | % Population |
| Africa | 5 | 0.1% |
| Asia | 9 | 0.2% |
| Canada | 20 | 0.4% |
| Eastern Africa | 5 | 0.1% |
| England | 4 | 0.1% |
| Europe | 33 | 0.6% |
| Germany | 3 | 0.1% |
| Indonesia | 9 | 0.2% |
| Netherlands | 10 | 0.2% |
| Northern Europe | 12 | 0.2% |
| South Eastern Asia | 9 | 0.2% |
| Switzerland | 8 | 0.2% |
| Western Europe | 21 | 0.4% | View All 13 Rows |
Sex and Age in Chelsea
Sex and Age in Chelsea
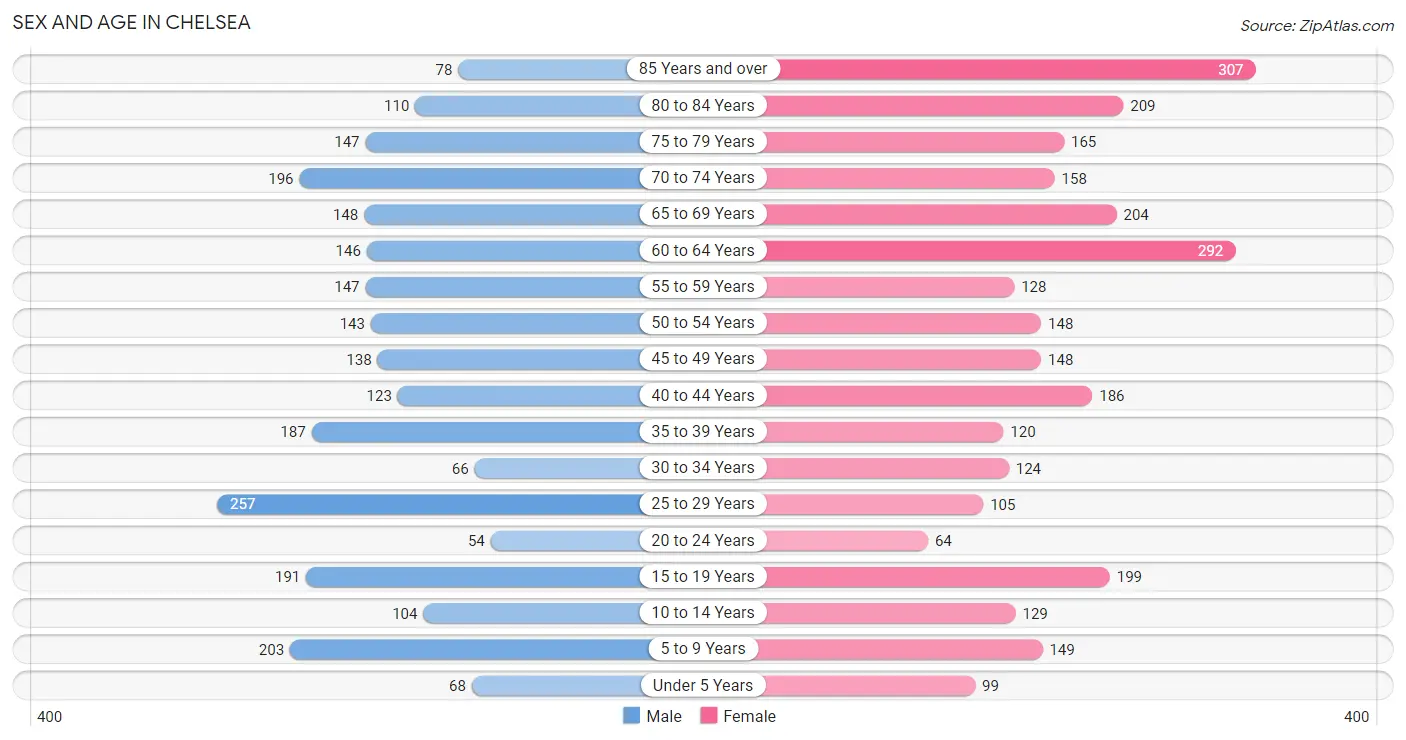
The most populous age groups in Chelsea are 25 to 29 Years (257 | 10.3%) for men and 85 Years and over (307 | 10.5%) for women.
| Age Bracket | Male | Female |
| Under 5 Years | 68 (2.7%) | 99 (3.4%) |
| 5 to 9 Years | 203 (8.1%) | 149 (5.1%) |
| 10 to 14 Years | 104 (4.2%) | 129 (4.4%) |
| 15 to 19 Years | 191 (7.6%) | 199 (6.8%) |
| 20 to 24 Years | 54 (2.1%) | 64 (2.2%) |
| 25 to 29 Years | 257 (10.3%) | 105 (3.6%) |
| 30 to 34 Years | 66 (2.6%) | 124 (4.2%) |
| 35 to 39 Years | 187 (7.5%) | 120 (4.1%) |
| 40 to 44 Years | 123 (4.9%) | 186 (6.3%) |
| 45 to 49 Years | 138 (5.5%) | 148 (5.0%) |
| 50 to 54 Years | 143 (5.7%) | 148 (5.0%) |
| 55 to 59 Years | 147 (5.9%) | 128 (4.4%) |
| 60 to 64 Years | 146 (5.8%) | 292 (10.0%) |
| 65 to 69 Years | 148 (5.9%) | 204 (7.0%) |
| 70 to 74 Years | 196 (7.8%) | 158 (5.4%) |
| 75 to 79 Years | 147 (5.9%) | 165 (5.6%) |
| 80 to 84 Years | 110 (4.4%) | 209 (7.1%) |
| 85 Years and over | 78 (3.1%) | 307 (10.5%) |
| Total | 2,506 (100.0%) | 2,934 (100.0%) |
Families and Households in Chelsea
Median Family Size in Chelsea
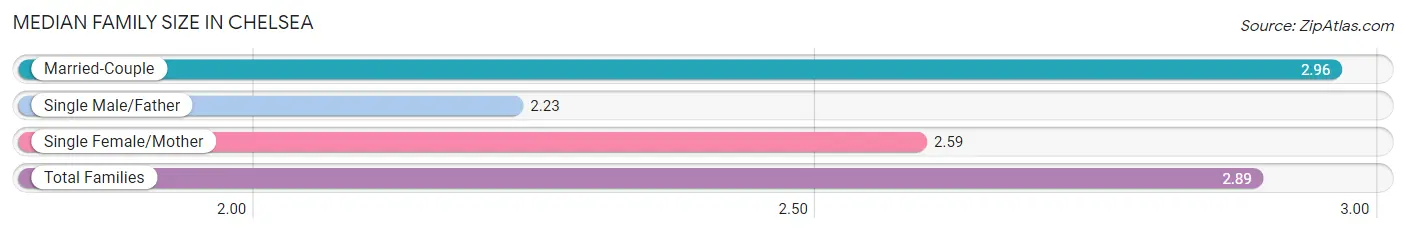
The median family size in Chelsea is 2.89 persons per family, with married-couple families (1,221 | 87.9%) accounting for the largest median family size of 2.96 persons per family. On the other hand, single male/father families (64 | 4.6%) represent the smallest median family size with 2.23 persons per family.
| Family Type | # Families | Family Size |
| Married-Couple | 1,221 (87.9%) | 2.96 |
| Single Male/Father | 64 (4.6%) | 2.23 |
| Single Female/Mother | 104 (7.5%) | 2.59 |
| Total Families | 1,389 (100.0%) | 2.89 |
Median Household Size in Chelsea
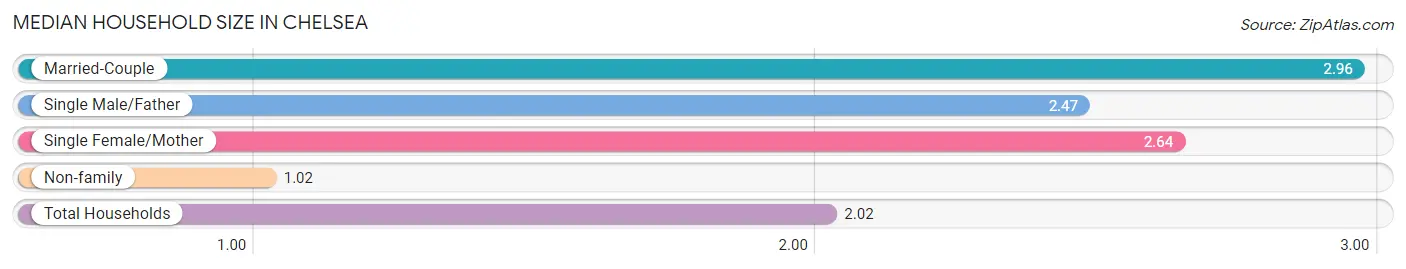
The median household size in Chelsea is 2.02 persons per household, with married-couple households (1,221 | 46.7%) accounting for the largest median household size of 2.96 persons per household. non-family households (1,228 | 46.9%) represent the smallest median household size with 1.02 persons per household.
| Household Type | # Households | Household Size |
| Married-Couple | 1,221 (46.7%) | 2.96 |
| Single Male/Father | 64 (2.5%) | 2.47 |
| Single Female/Mother | 104 (4.0%) | 2.64 |
| Non-family | 1,228 (46.9%) | 1.02 |
| Total Households | 2,617 (100.0%) | 2.02 |
Household Size by Marriage Status in Chelsea
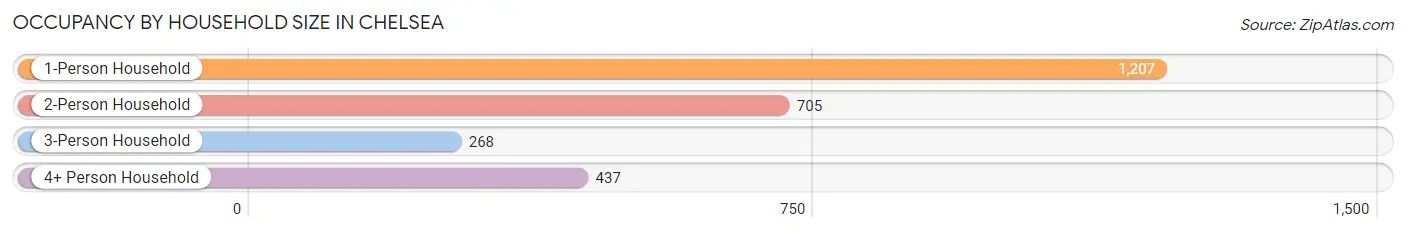
Out of a total of 2,617 households in Chelsea, 1,389 (53.1%) are family households, while 1,228 (46.9%) are nonfamily households. The most numerous type of family households are 2-person households, comprising 684, and the most common type of nonfamily households are 1-person households, comprising 1,207.
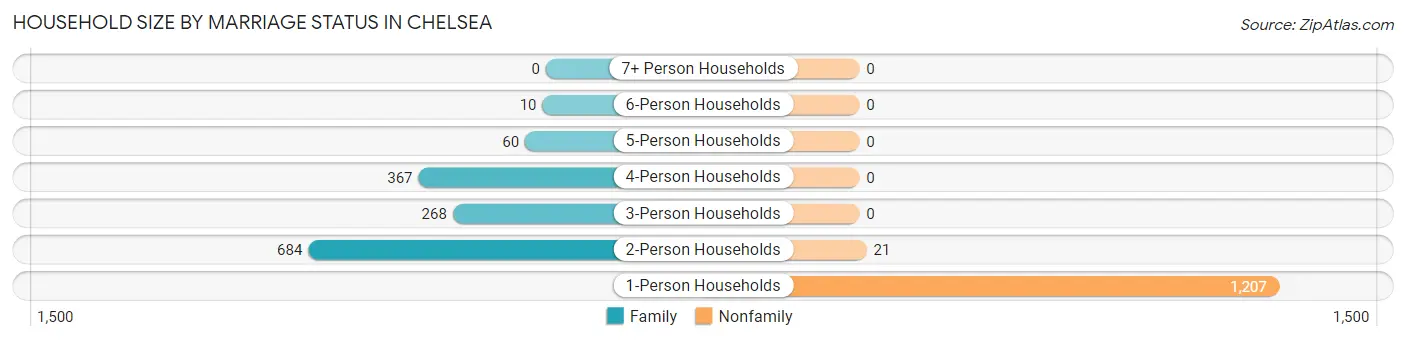
| Household Size | Family Households | Nonfamily Households |
| 1-Person Households | - | 1,207 (46.1%) |
| 2-Person Households | 684 (26.1%) | 21 (0.8%) |
| 3-Person Households | 268 (10.2%) | 0 (0.0%) |
| 4-Person Households | 367 (14.0%) | 0 (0.0%) |
| 5-Person Households | 60 (2.3%) | 0 (0.0%) |
| 6-Person Households | 10 (0.4%) | 0 (0.0%) |
| 7+ Person Households | 0 (0.0%) | 0 (0.0%) |
| Total | 1,389 (53.1%) | 1,228 (46.9%) |
Female Fertility in Chelsea
Fertility by Age in Chelsea
Average fertility rate in Chelsea is 30.0 births per 1,000 women. Women in the age bracket of 20 to 34 years have the highest fertility rate with 68.0 births per 1,000 women. Women in the age bracket of 20 to 34 years acount for 69.0% of all women with births.
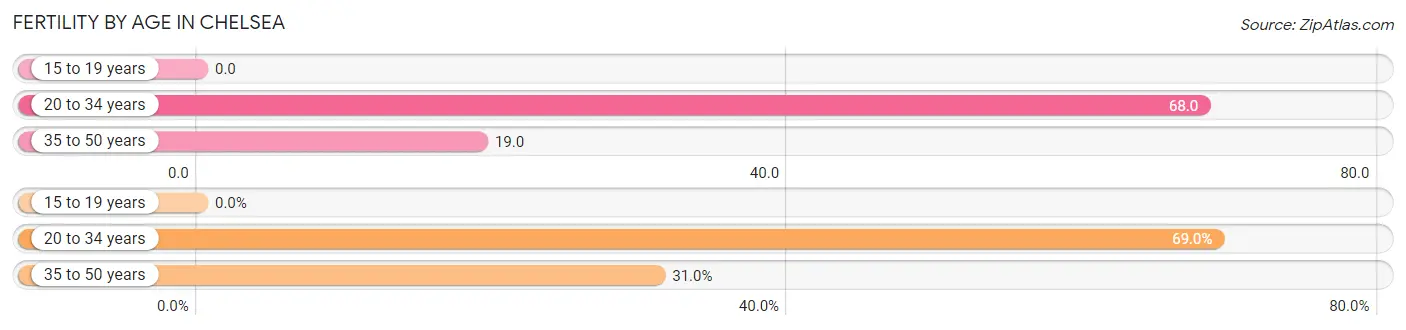
| Age Bracket | Women with Births | Births / 1,000 Women |
| 15 to 19 years | 0 (0.0%) | 0.0 |
| 20 to 34 years | 20 (69.0%) | 68.0 |
| 35 to 50 years | 9 (31.0%) | 19.0 |
| Total | 29 (100.0%) | 30.0 |
Fertility by Age by Marriage Status in Chelsea
82.8% of women with births (29) in Chelsea are married. The highest percentage of unmarried women with births falls into 20 to 34 years age bracket with 25.0% of them unmarried at the time of birth, while the lowest percentage of unmarried women with births belong to 35 to 50 years age bracket with 0.0% of them unmarried.
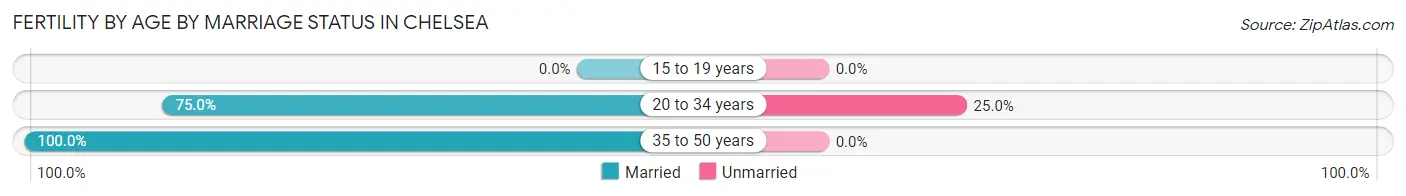
| Age Bracket | Married | Unmarried |
| 15 to 19 years | 0 (0.0%) | 0 (0.0%) |
| 20 to 34 years | 15 (75.0%) | 5 (25.0%) |
| 35 to 50 years | 9 (100.0%) | 0 (0.0%) |
| Total | 24 (82.8%) | 5 (17.2%) |
Fertility by Education in Chelsea
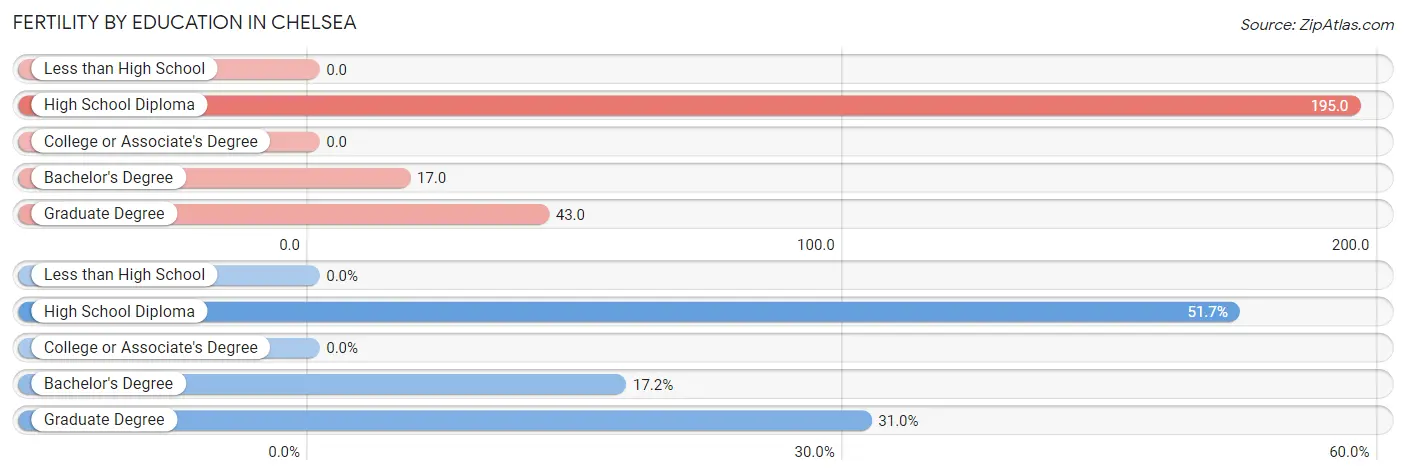
| Educational Attainment | Women with Births | Births / 1,000 Women |
| Less than High School | 0 (0.0%) | 0.0 |
| High School Diploma | 15 (51.7%) | 195.0 |
| College or Associate's Degree | 0 (0.0%) | 0.0 |
| Bachelor's Degree | 5 (17.2%) | 17.0 |
| Graduate Degree | 9 (31.0%) | 43.0 |
| Total | 29 (100.0%) | 30.0 |
Fertility by Education by Marriage Status in Chelsea
17.2% of women with births in Chelsea are unmarried. Women with the educational attainment of high school diploma are most likely to be married with 100.0% of them married at childbirth, while women with the educational attainment of bachelor's degree are least likely to be married with 100.0% of them unmarried at childbirth.
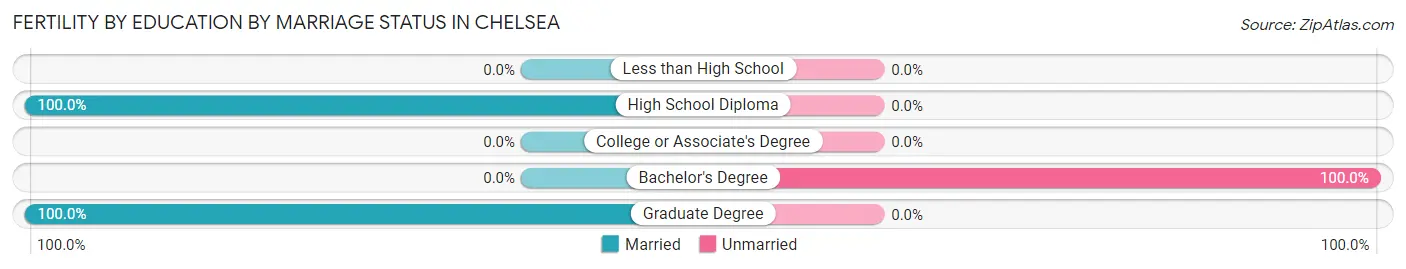
| Educational Attainment | Married | Unmarried |
| Less than High School | 0 (0.0%) | 0 (0.0%) |
| High School Diploma | 15 (100.0%) | 0 (0.0%) |
| College or Associate's Degree | 0 (0.0%) | 0 (0.0%) |
| Bachelor's Degree | 0 (0.0%) | 5 (100.0%) |
| Graduate Degree | 9 (100.0%) | 0 (0.0%) |
| Total | 24 (82.8%) | 5 (17.2%) |
Employment Characteristics in Chelsea
Employment by Class of Employer in Chelsea
Among the 2,481 employed individuals in Chelsea, private company employees (1,382 | 55.7%), not-for-profit organizations (533 | 21.5%), and state government employees (166 | 6.7%) make up the most common classes of employment.
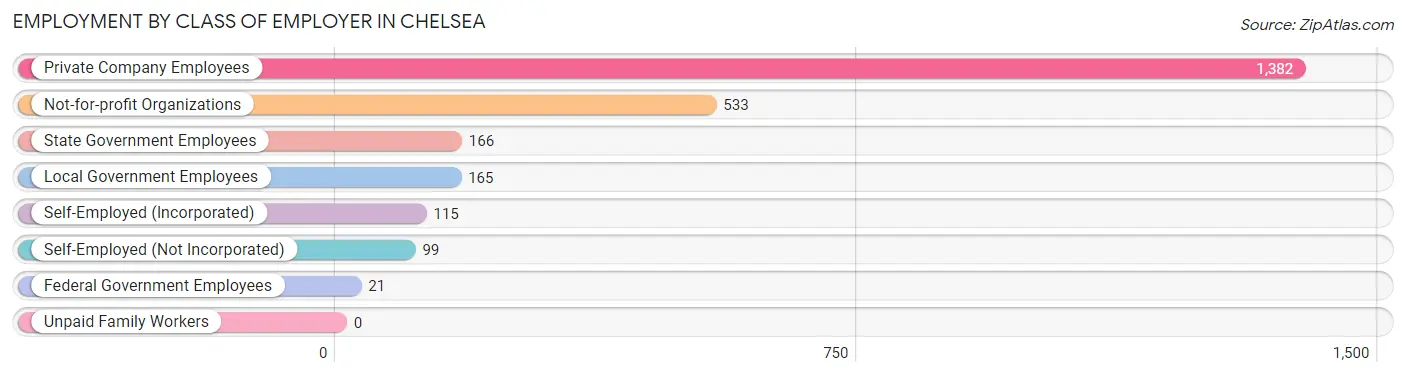
| Employer Class | # Employees | % Employees |
| Private Company Employees | 1,382 | 55.7% |
| Self-Employed (Incorporated) | 115 | 4.6% |
| Self-Employed (Not Incorporated) | 99 | 4.0% |
| Not-for-profit Organizations | 533 | 21.5% |
| Local Government Employees | 165 | 6.7% |
| State Government Employees | 166 | 6.7% |
| Federal Government Employees | 21 | 0.9% |
| Unpaid Family Workers | 0 | 0.0% |
| Total | 2,481 | 100.0% |
Employment Status by Age in Chelsea
According to the labor force statistics for Chelsea, out of the total population over 16 years of age (4,643), 54.5% or 2,530 individuals are in the labor force, with 1.3% or 33 of them unemployed. The age group with the highest labor force participation rate is 35 to 44 years, with 94.3% or 581 individuals in the labor force. Within the labor force, the 16 to 19 years age range has the highest percentage of unemployed individuals, with 23.2% or 22 of them being unemployed.
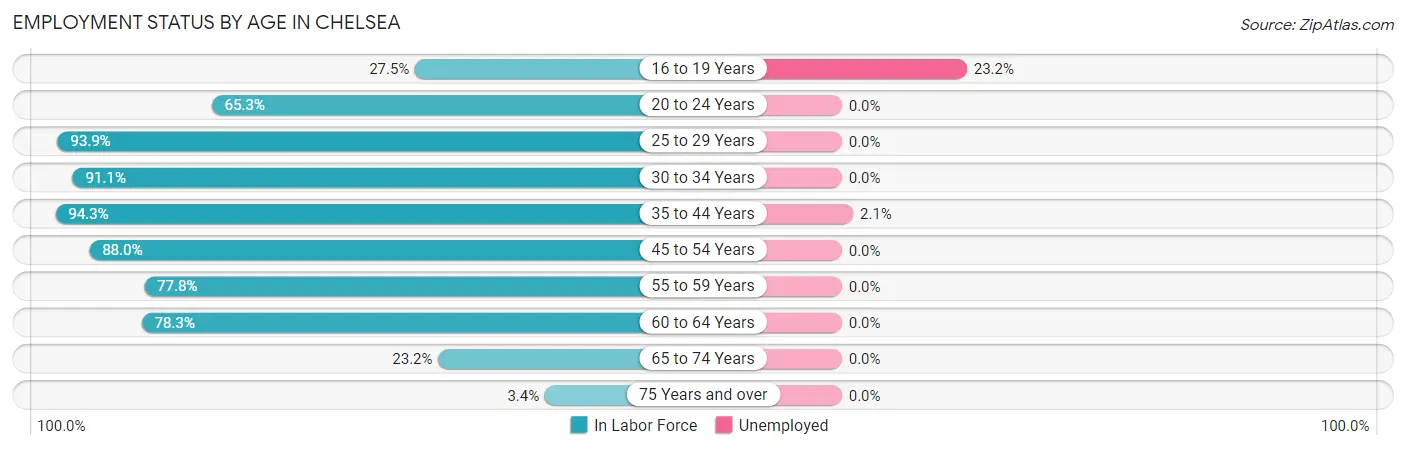
| Age Bracket | In Labor Force | Unemployed |
| 16 to 19 Years | 95 (27.5%) | 22 (23.2%) |
| 20 to 24 Years | 77 (65.3%) | 0 (0.0%) |
| 25 to 29 Years | 340 (93.9%) | 0 (0.0%) |
| 30 to 34 Years | 173 (91.1%) | 0 (0.0%) |
| 35 to 44 Years | 581 (94.3%) | 12 (2.1%) |
| 45 to 54 Years | 508 (88.0%) | 0 (0.0%) |
| 55 to 59 Years | 214 (77.8%) | 0 (0.0%) |
| 60 to 64 Years | 343 (78.3%) | 0 (0.0%) |
| 65 to 74 Years | 164 (23.2%) | 0 (0.0%) |
| 75 Years and over | 35 (3.4%) | 0 (0.0%) |
| Total | 2,530 (54.5%) | 33 (1.3%) |
Employment Status by Educational Attainment in Chelsea
According to labor force statistics for Chelsea, 87.8% of individuals (2,158) out of the total population between 25 and 64 years of age (2,458) are in the labor force, with 0.6% or 13 of them being unemployed. The group with the highest labor force participation rate are those with the educational attainment of bachelor's degree or higher, with 93.0% or 1,321 individuals in the labor force. Within the labor force, individuals with bachelor's degree or higher education have the highest percentage of unemployment, with 0.9% or 12 of them being unemployed.
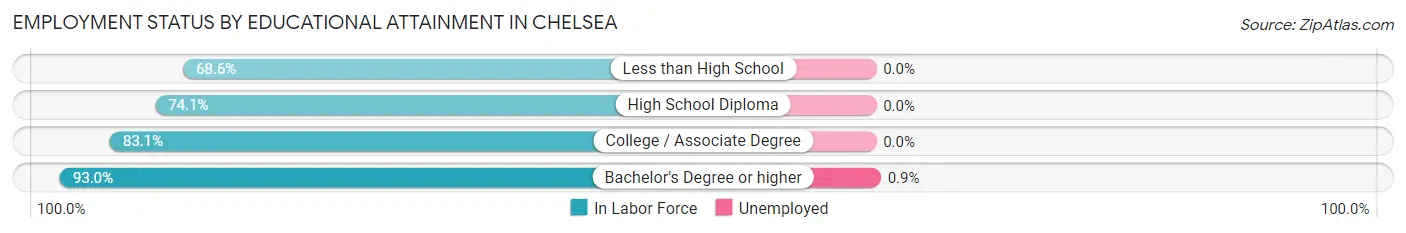
| Educational Attainment | In Labor Force | Unemployed |
| Less than High School | 24 (68.6%) | 0 (0.0%) |
| High School Diploma | 163 (74.1%) | 0 (0.0%) |
| College / Associate Degree | 651 (83.1%) | 0 (0.0%) |
| Bachelor's Degree or higher | 1,321 (93.0%) | 13 (0.9%) |
| Total | 2,158 (87.8%) | 15 (0.6%) |
Employment Occupations by Sex in Chelsea
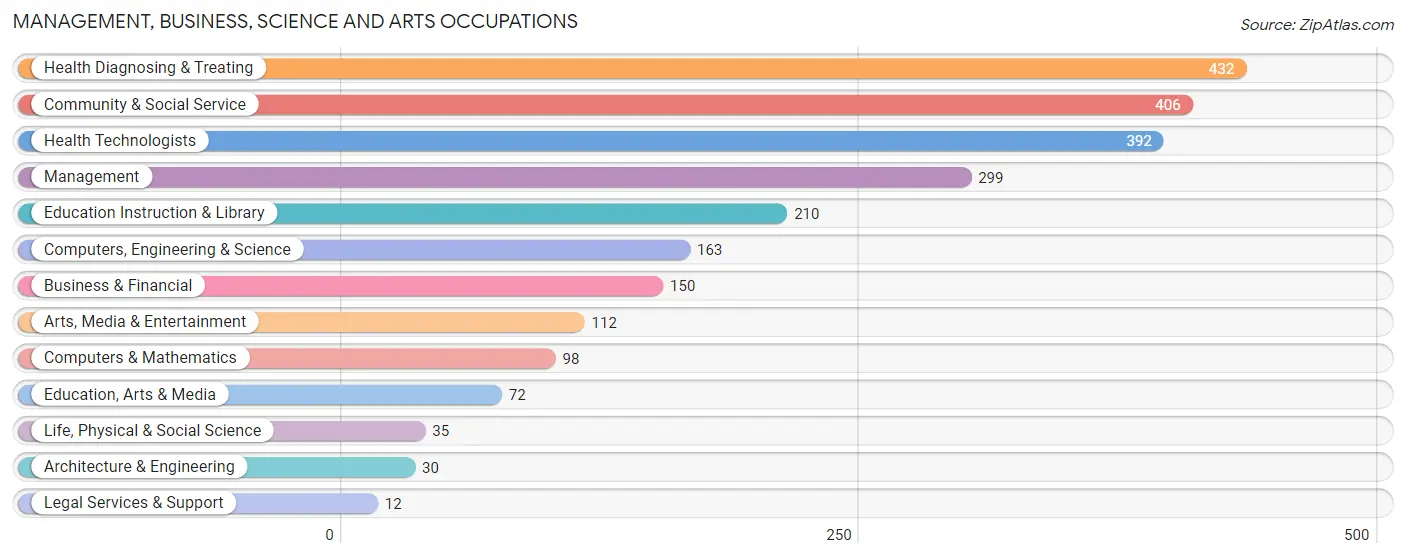
Management, Business, Science and Arts Occupations
The most common Management, Business, Science and Arts occupations in Chelsea are Health Diagnosing & Treating (432 | 17.3%), Community & Social Service (406 | 16.3%), Health Technologists (392 | 15.7%), Management (299 | 12.0%), and Education Instruction & Library (210 | 8.4%).
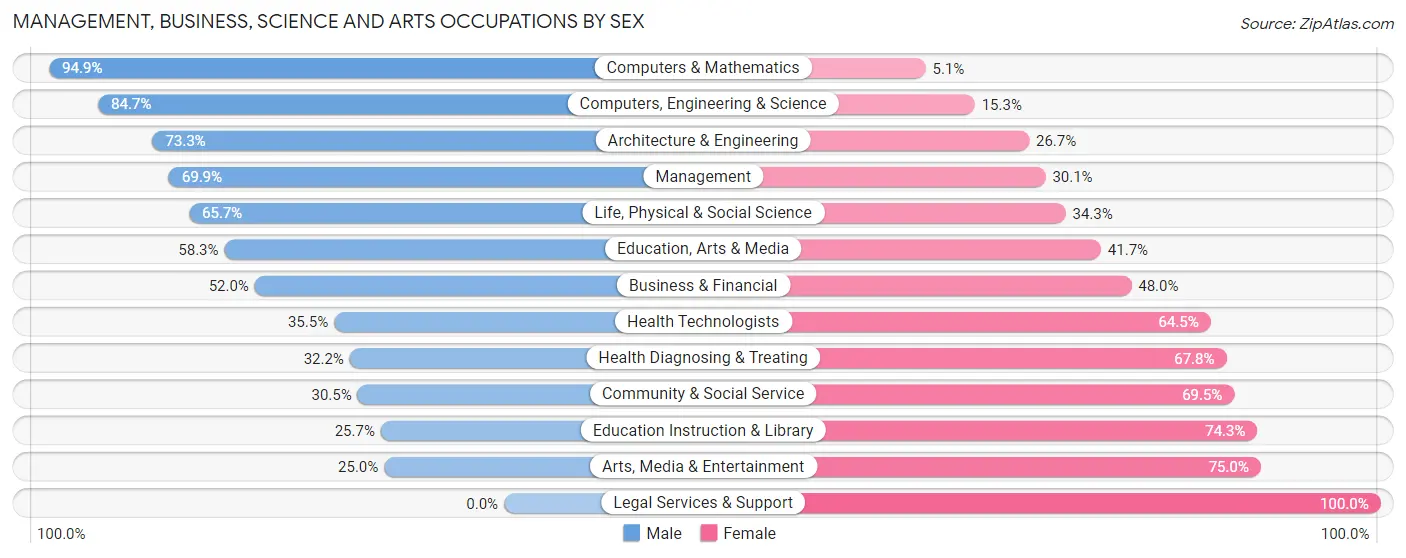
Management, Business, Science and Arts Occupations by Sex
Within the Management, Business, Science and Arts occupations in Chelsea, the most male-oriented occupations are Computers & Mathematics (94.9%), Computers, Engineering & Science (84.7%), and Architecture & Engineering (73.3%), while the most female-oriented occupations are Legal Services & Support (100.0%), Arts, Media & Entertainment (75.0%), and Education Instruction & Library (74.3%).
| Occupation | Male | Female |
| Management | 209 (69.9%) | 90 (30.1%) |
| Business & Financial | 78 (52.0%) | 72 (48.0%) |
| Computers, Engineering & Science | 138 (84.7%) | 25 (15.3%) |
| Computers & Mathematics | 93 (94.9%) | 5 (5.1%) |
| Architecture & Engineering | 22 (73.3%) | 8 (26.7%) |
| Life, Physical & Social Science | 23 (65.7%) | 12 (34.3%) |
| Community & Social Service | 124 (30.5%) | 282 (69.5%) |
| Education, Arts & Media | 42 (58.3%) | 30 (41.7%) |
| Legal Services & Support | 0 (0.0%) | 12 (100.0%) |
| Education Instruction & Library | 54 (25.7%) | 156 (74.3%) |
| Arts, Media & Entertainment | 28 (25.0%) | 84 (75.0%) |
| Health Diagnosing & Treating | 139 (32.2%) | 293 (67.8%) |
| Health Technologists | 139 (35.5%) | 253 (64.5%) |
| Total (Category) | 688 (47.4%) | 762 (52.5%) |
| Total (Overall) | 1,237 (49.6%) | 1,259 (50.4%) |
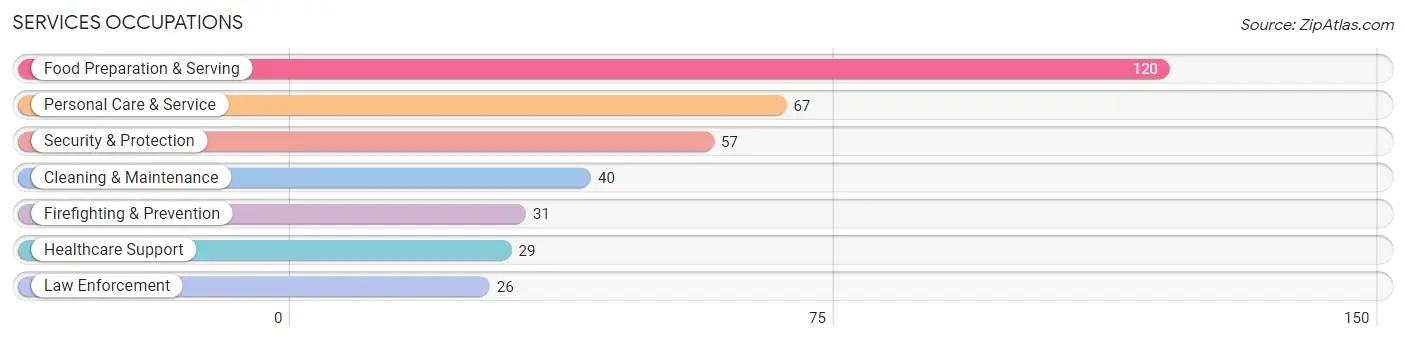
Services Occupations
The most common Services occupations in Chelsea are Food Preparation & Serving (120 | 4.8%), Personal Care & Service (67 | 2.7%), Security & Protection (57 | 2.3%), Cleaning & Maintenance (40 | 1.6%), and Firefighting & Prevention (31 | 1.2%).
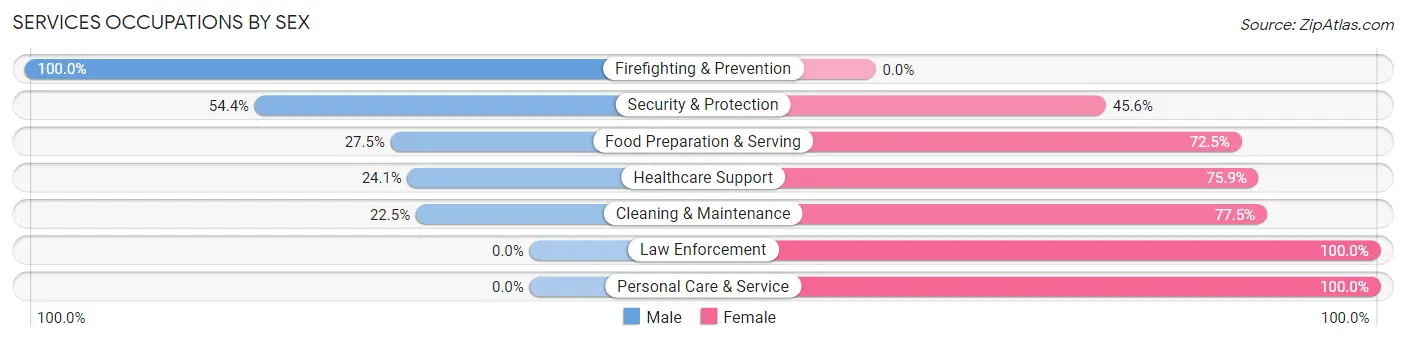
Services Occupations by Sex
Within the Services occupations in Chelsea, the most male-oriented occupations are Firefighting & Prevention (100.0%), Security & Protection (54.4%), and Food Preparation & Serving (27.5%), while the most female-oriented occupations are Law Enforcement (100.0%), Personal Care & Service (100.0%), and Cleaning & Maintenance (77.5%).
| Occupation | Male | Female |
| Healthcare Support | 7 (24.1%) | 22 (75.9%) |
| Security & Protection | 31 (54.4%) | 26 (45.6%) |
| Firefighting & Prevention | 31 (100.0%) | 0 (0.0%) |
| Law Enforcement | 0 (0.0%) | 26 (100.0%) |
| Food Preparation & Serving | 33 (27.5%) | 87 (72.5%) |
| Cleaning & Maintenance | 9 (22.5%) | 31 (77.5%) |
| Personal Care & Service | 0 (0.0%) | 67 (100.0%) |
| Total (Category) | 80 (25.6%) | 233 (74.4%) |
| Total (Overall) | 1,237 (49.6%) | 1,259 (50.4%) |
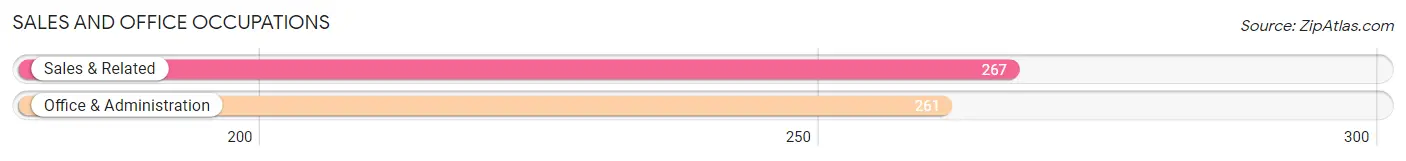
Sales and Office Occupations
The most common Sales and Office occupations in Chelsea are Sales & Related (267 | 10.7%), and Office & Administration (261 | 10.5%).
Sales and Office Occupations by Sex
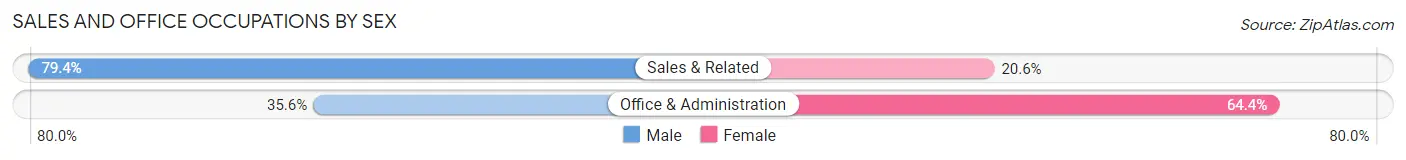
| Occupation | Male | Female |
| Sales & Related | 212 (79.4%) | 55 (20.6%) |
| Office & Administration | 93 (35.6%) | 168 (64.4%) |
| Total (Category) | 305 (57.8%) | 223 (42.2%) |
| Total (Overall) | 1,237 (49.6%) | 1,259 (50.4%) |
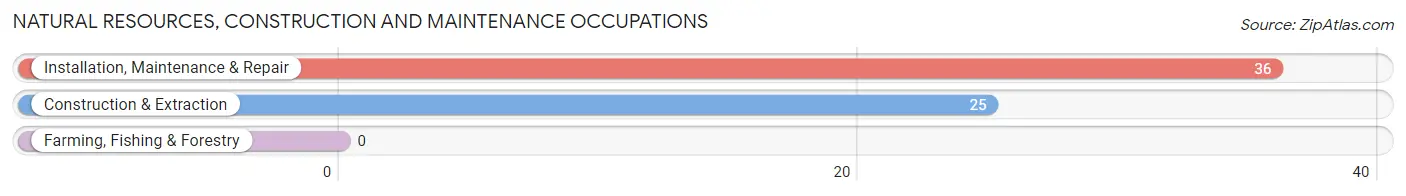
Natural Resources, Construction and Maintenance Occupations
The most common Natural Resources, Construction and Maintenance occupations in Chelsea are Installation, Maintenance & Repair (36 | 1.4%), and Construction & Extraction (25 | 1.0%).
Natural Resources, Construction and Maintenance Occupations by Sex
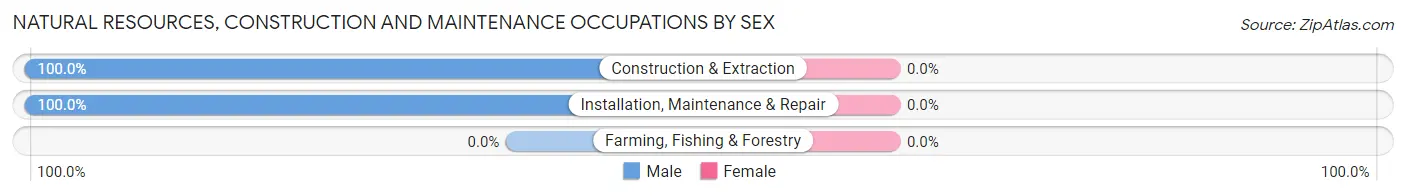
| Occupation | Male | Female |
| Farming, Fishing & Forestry | 0 (0.0%) | 0 (0.0%) |
| Construction & Extraction | 25 (100.0%) | 0 (0.0%) |
| Installation, Maintenance & Repair | 36 (100.0%) | 0 (0.0%) |
| Total (Category) | 61 (100.0%) | 0 (0.0%) |
| Total (Overall) | 1,237 (49.6%) | 1,259 (50.4%) |
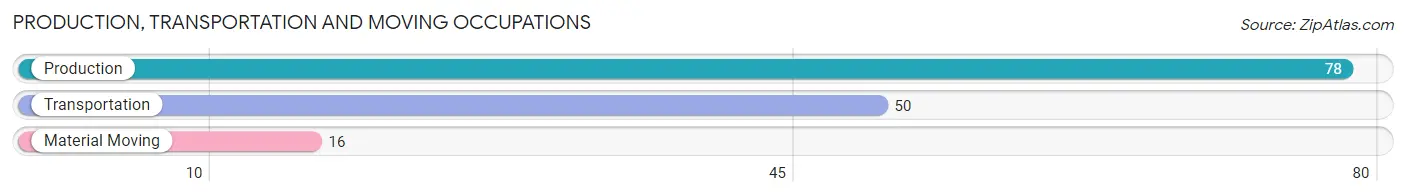
Production, Transportation and Moving Occupations
The most common Production, Transportation and Moving occupations in Chelsea are Production (78 | 3.1%), Transportation (50 | 2.0%), and Material Moving (16 | 0.6%).
Production, Transportation and Moving Occupations by Sex
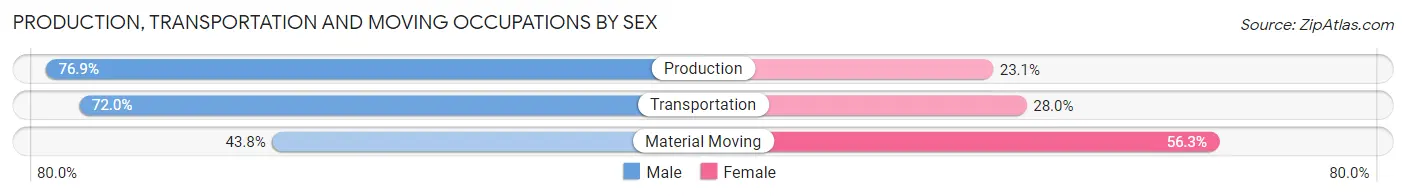
| Occupation | Male | Female |
| Production | 60 (76.9%) | 18 (23.1%) |
| Transportation | 36 (72.0%) | 14 (28.0%) |
| Material Moving | 7 (43.8%) | 9 (56.2%) |
| Total (Category) | 103 (71.5%) | 41 (28.5%) |
| Total (Overall) | 1,237 (49.6%) | 1,259 (50.4%) |
Employment Industries by Sex in Chelsea
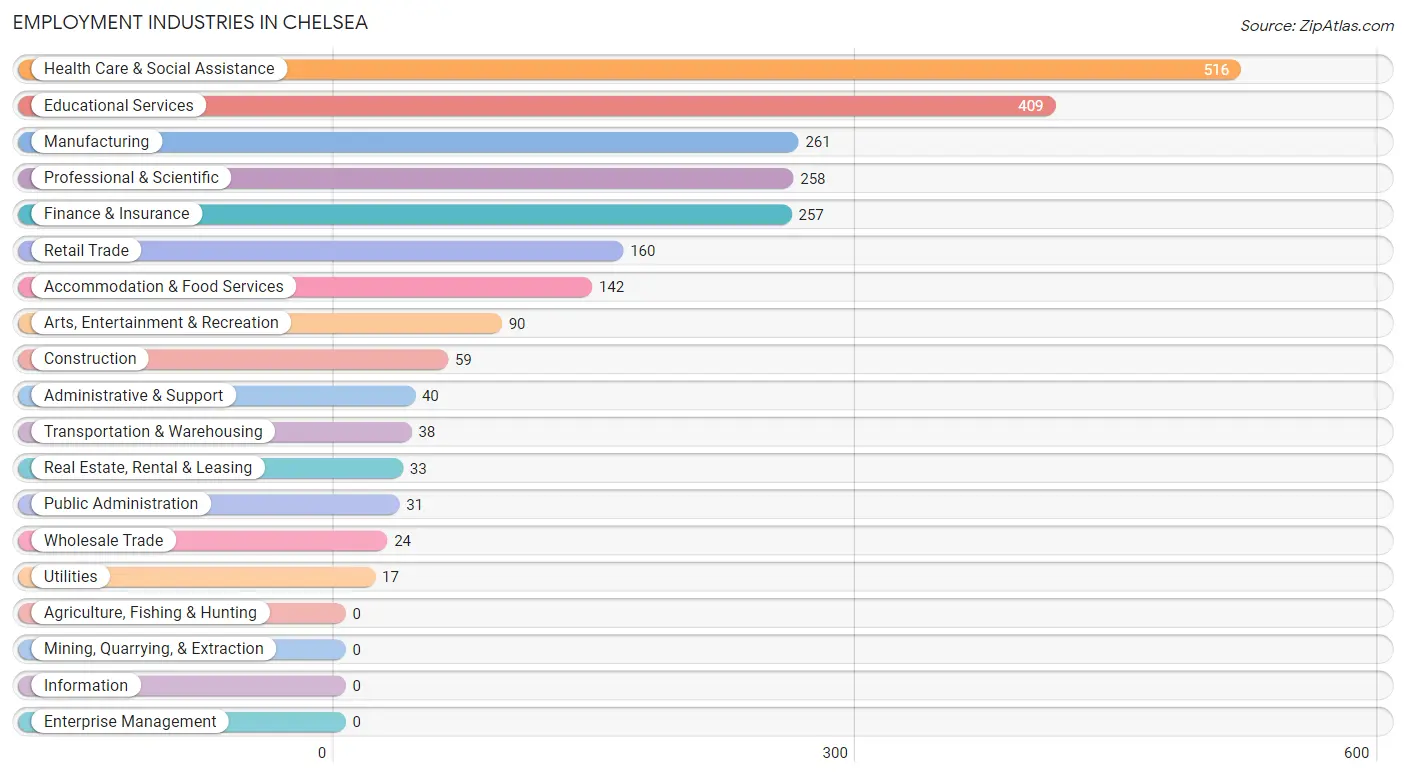
Employment Industries in Chelsea
The major employment industries in Chelsea include Health Care & Social Assistance (516 | 20.7%), Educational Services (409 | 16.4%), Manufacturing (261 | 10.5%), Professional & Scientific (258 | 10.3%), and Finance & Insurance (257 | 10.3%).
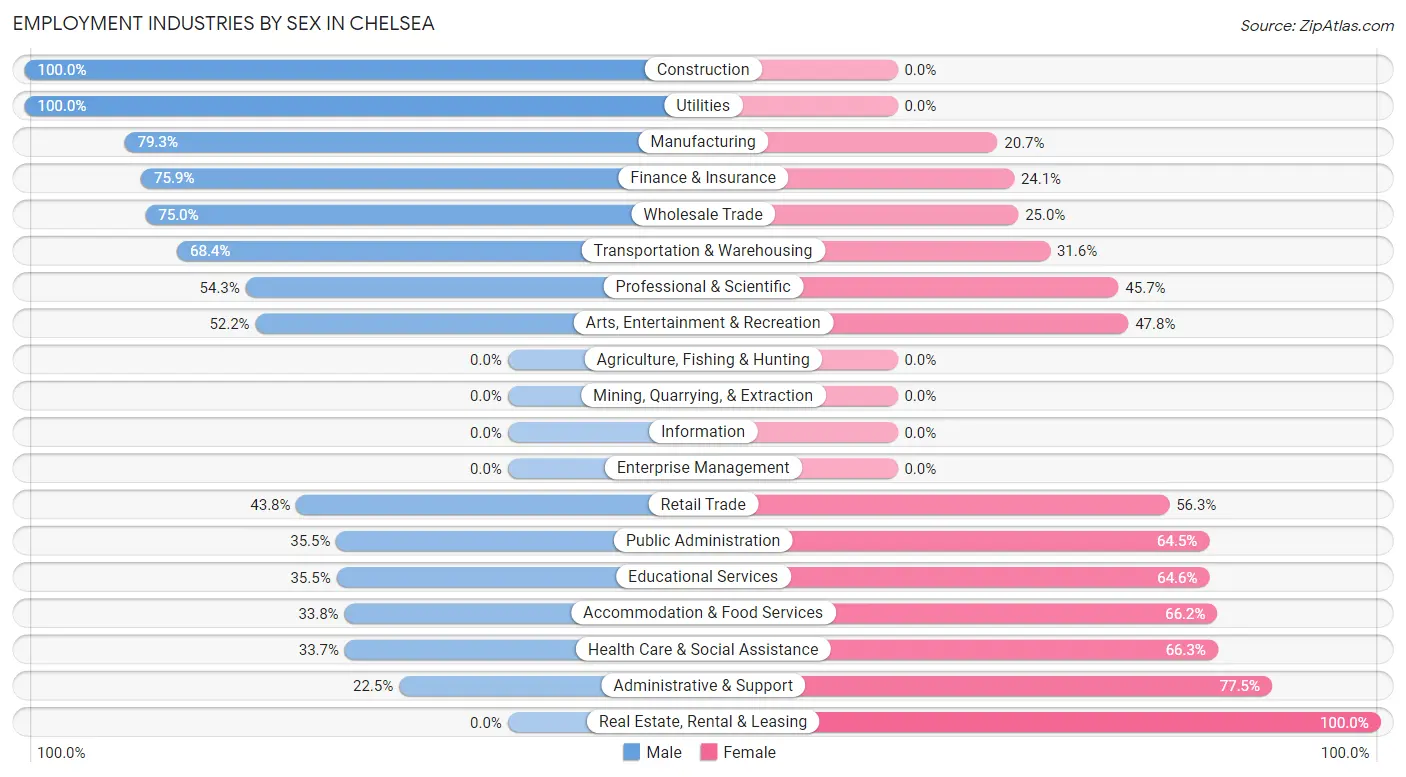
Employment Industries by Sex in Chelsea
The Chelsea industries that see more men than women are Construction (100.0%), Utilities (100.0%), and Manufacturing (79.3%), whereas the industries that tend to have a higher number of women are Real Estate, Rental & Leasing (100.0%), Administrative & Support (77.5%), and Health Care & Social Assistance (66.3%).
| Industry | Male | Female |
| Agriculture, Fishing & Hunting | 0 (0.0%) | 0 (0.0%) |
| Mining, Quarrying, & Extraction | 0 (0.0%) | 0 (0.0%) |
| Construction | 59 (100.0%) | 0 (0.0%) |
| Manufacturing | 207 (79.3%) | 54 (20.7%) |
| Wholesale Trade | 18 (75.0%) | 6 (25.0%) |
| Retail Trade | 70 (43.8%) | 90 (56.2%) |
| Transportation & Warehousing | 26 (68.4%) | 12 (31.6%) |
| Utilities | 17 (100.0%) | 0 (0.0%) |
| Information | 0 (0.0%) | 0 (0.0%) |
| Finance & Insurance | 195 (75.9%) | 62 (24.1%) |
| Real Estate, Rental & Leasing | 0 (0.0%) | 33 (100.0%) |
| Professional & Scientific | 140 (54.3%) | 118 (45.7%) |
| Enterprise Management | 0 (0.0%) | 0 (0.0%) |
| Administrative & Support | 9 (22.5%) | 31 (77.5%) |
| Educational Services | 145 (35.4%) | 264 (64.5%) |
| Health Care & Social Assistance | 174 (33.7%) | 342 (66.3%) |
| Arts, Entertainment & Recreation | 47 (52.2%) | 43 (47.8%) |
| Accommodation & Food Services | 48 (33.8%) | 94 (66.2%) |
| Public Administration | 11 (35.5%) | 20 (64.5%) |
| Total | 1,237 (49.6%) | 1,259 (50.4%) |
Education in Chelsea
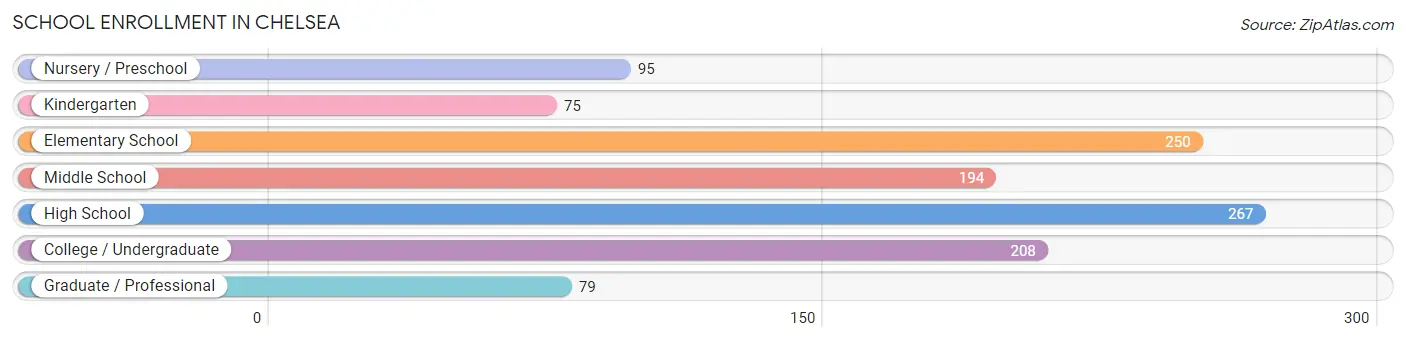
School Enrollment in Chelsea
The most common levels of schooling among the 1,168 students in Chelsea are high school (267 | 22.9%), elementary school (250 | 21.4%), and college / undergraduate (208 | 17.8%).
| School Level | # Students | % Students |
| Nursery / Preschool | 95 | 8.1% |
| Kindergarten | 75 | 6.4% |
| Elementary School | 250 | 21.4% |
| Middle School | 194 | 16.6% |
| High School | 267 | 22.9% |
| College / Undergraduate | 208 | 17.8% |
| Graduate / Professional | 79 | 6.8% |
| Total | 1,168 | 100.0% |
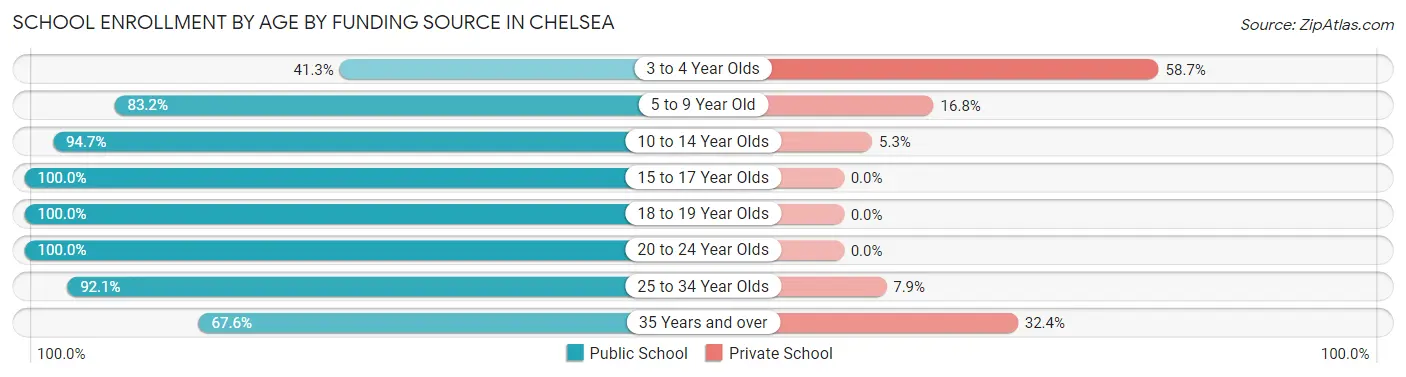
School Enrollment by Age by Funding Source in Chelsea
Out of a total of 1,168 students who are enrolled in schools in Chelsea, 130 (11.1%) attend a private institution, while the remaining 1,038 (88.9%) are enrolled in public schools. The age group of 3 to 4 year olds has the highest likelihood of being enrolled in private schools, with 44 (58.7% in the age bracket) enrolled. Conversely, the age group of 15 to 17 year olds has the lowest likelihood of being enrolled in a private school, with 170 (100.0% in the age bracket) attending a public institution.
| Age Bracket | Public School | Private School |
| 3 to 4 Year Olds | 31 (41.3%) | 44 (58.7%) |
| 5 to 9 Year Old | 293 (83.2%) | 59 (16.8%) |
| 10 to 14 Year Olds | 179 (94.7%) | 10 (5.3%) |
| 15 to 17 Year Olds | 170 (100.0%) | 0 (0.0%) |
| 18 to 19 Year Olds | 213 (100.0%) | 0 (0.0%) |
| 20 to 24 Year Olds | 69 (100.0%) | 0 (0.0%) |
| 25 to 34 Year Olds | 58 (92.1%) | 5 (7.9%) |
| 35 Years and over | 25 (67.6%) | 12 (32.4%) |
| Total | 1,038 (88.9%) | 130 (11.1%) |
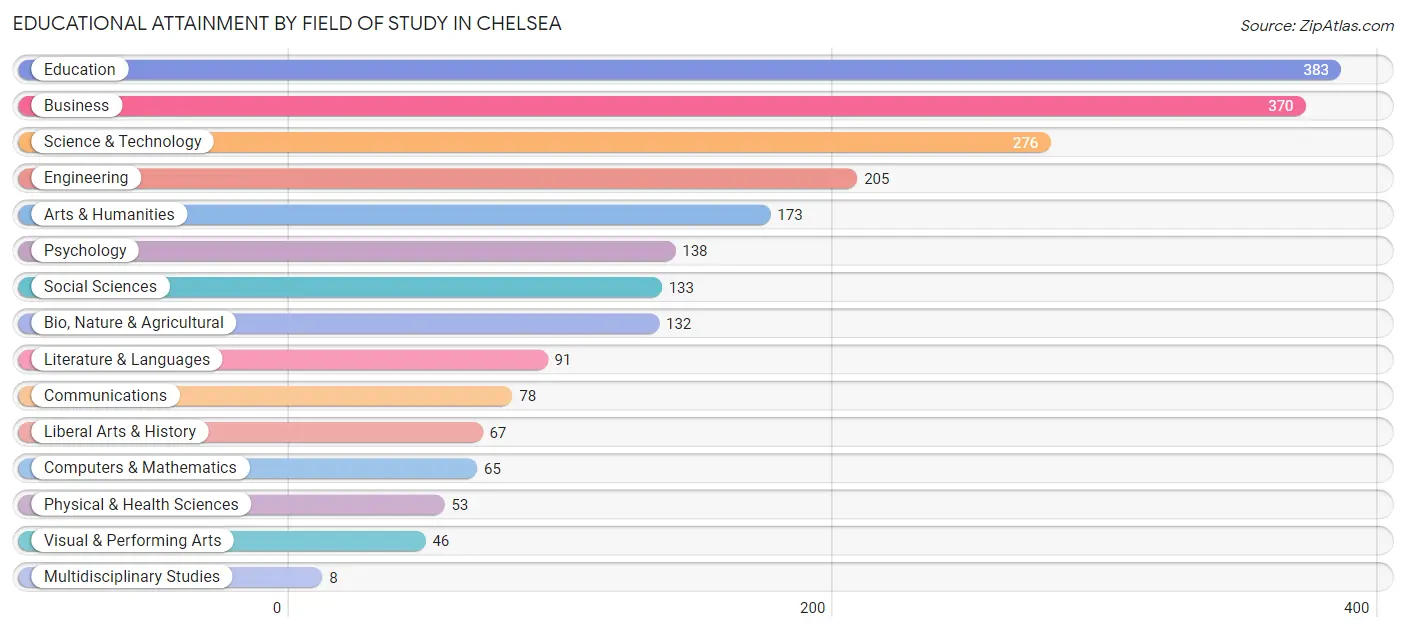
Educational Attainment by Field of Study in Chelsea
Education (383 | 17.3%), business (370 | 16.7%), science & technology (276 | 12.4%), engineering (205 | 9.2%), and arts & humanities (173 | 7.8%) are the most common fields of study among 2,218 individuals in Chelsea who have obtained a bachelor's degree or higher.
| Field of Study | # Graduates | % Graduates |
| Computers & Mathematics | 65 | 2.9% |
| Bio, Nature & Agricultural | 132 | 5.9% |
| Physical & Health Sciences | 53 | 2.4% |
| Psychology | 138 | 6.2% |
| Social Sciences | 133 | 6.0% |
| Engineering | 205 | 9.2% |
| Multidisciplinary Studies | 8 | 0.4% |
| Science & Technology | 276 | 12.4% |
| Business | 370 | 16.7% |
| Education | 383 | 17.3% |
| Literature & Languages | 91 | 4.1% |
| Liberal Arts & History | 67 | 3.0% |
| Visual & Performing Arts | 46 | 2.1% |
| Communications | 78 | 3.5% |
| Arts & Humanities | 173 | 7.8% |
| Total | 2,218 | 100.0% |
Transportation & Commute in Chelsea
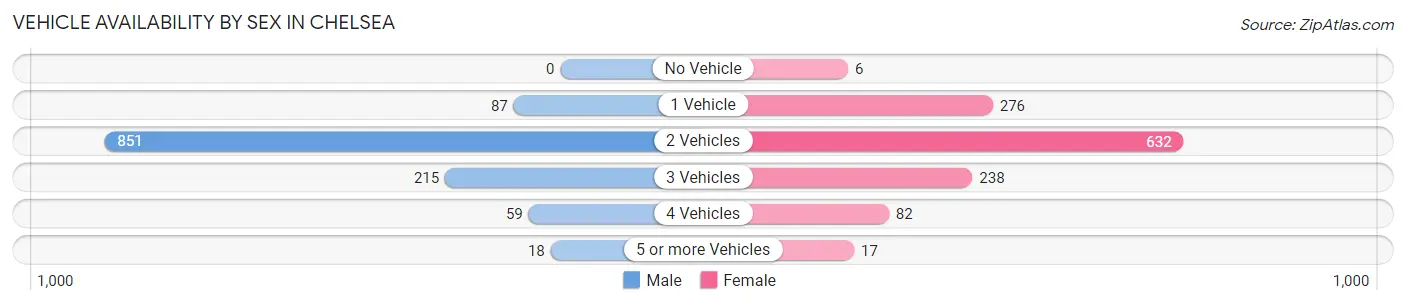
Vehicle Availability by Sex in Chelsea
The most prevalent vehicle ownership categories in Chelsea are males with 2 vehicles (851, accounting for 69.2%) and females with 2 vehicles (632, making up 68.0%).
| Vehicles Available | Male | Female |
| No Vehicle | 0 (0.0%) | 6 (0.5%) |
| 1 Vehicle | 87 (7.1%) | 276 (22.1%) |
| 2 Vehicles | 851 (69.2%) | 632 (50.5%) |
| 3 Vehicles | 215 (17.5%) | 238 (19.0%) |
| 4 Vehicles | 59 (4.8%) | 82 (6.6%) |
| 5 or more Vehicles | 18 (1.5%) | 17 (1.4%) |
| Total | 1,230 (100.0%) | 1,251 (100.0%) |
Commute Time in Chelsea
The most frequently occuring commute durations in Chelsea are 30 to 34 minutes (375 commuters, 18.0%), 25 to 29 minutes (334 commuters, 16.1%), and 5 to 9 minutes (324 commuters, 15.6%).
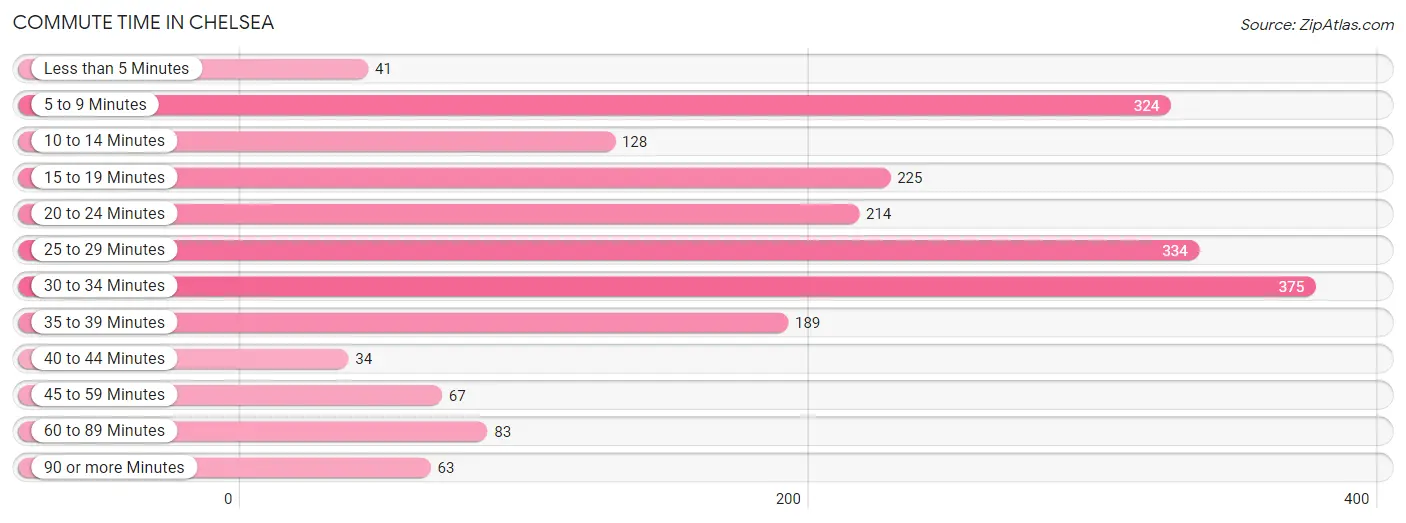
| Commute Time | # Commuters | % Commuters |
| Less than 5 Minutes | 41 | 2.0% |
| 5 to 9 Minutes | 324 | 15.6% |
| 10 to 14 Minutes | 128 | 6.2% |
| 15 to 19 Minutes | 225 | 10.8% |
| 20 to 24 Minutes | 214 | 10.3% |
| 25 to 29 Minutes | 334 | 16.1% |
| 30 to 34 Minutes | 375 | 18.0% |
| 35 to 39 Minutes | 189 | 9.1% |
| 40 to 44 Minutes | 34 | 1.6% |
| 45 to 59 Minutes | 67 | 3.2% |
| 60 to 89 Minutes | 83 | 4.0% |
| 90 or more Minutes | 63 | 3.0% |
Commute Time by Sex in Chelsea
The most common commute times in Chelsea are 25 to 29 minutes (267 commuters, 26.8%) for males and 30 to 34 minutes (249 commuters, 23.1%) for females.
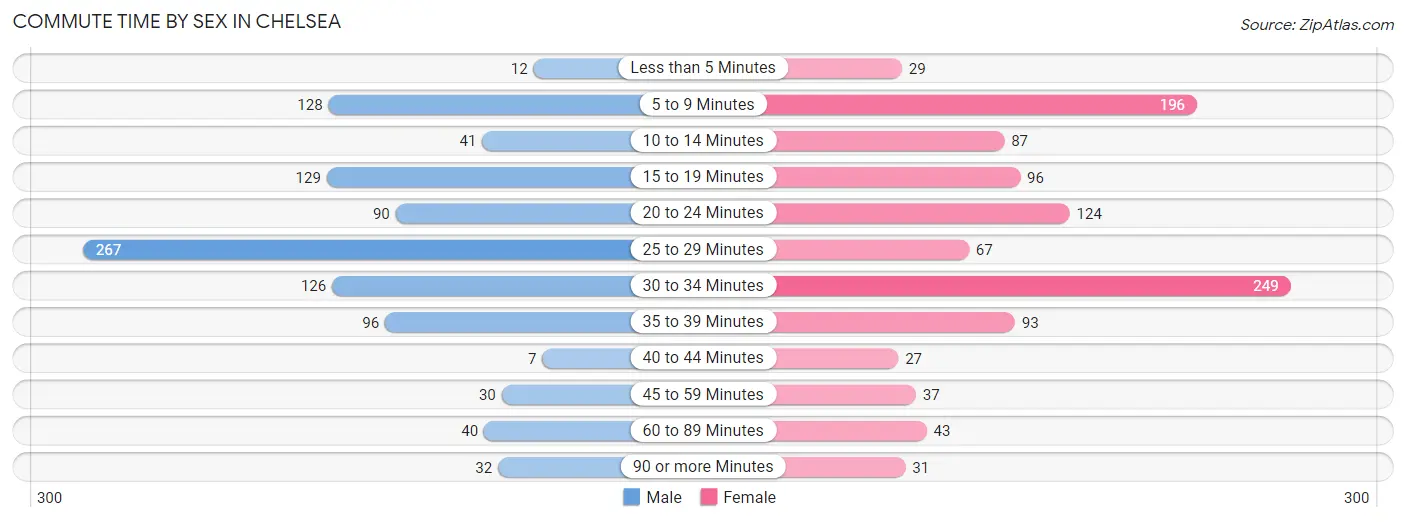
| Commute Time | Male | Female |
| Less than 5 Minutes | 12 (1.2%) | 29 (2.7%) |
| 5 to 9 Minutes | 128 (12.8%) | 196 (18.2%) |
| 10 to 14 Minutes | 41 (4.1%) | 87 (8.1%) |
| 15 to 19 Minutes | 129 (12.9%) | 96 (8.9%) |
| 20 to 24 Minutes | 90 (9.0%) | 124 (11.5%) |
| 25 to 29 Minutes | 267 (26.8%) | 67 (6.2%) |
| 30 to 34 Minutes | 126 (12.6%) | 249 (23.1%) |
| 35 to 39 Minutes | 96 (9.6%) | 93 (8.6%) |
| 40 to 44 Minutes | 7 (0.7%) | 27 (2.5%) |
| 45 to 59 Minutes | 30 (3.0%) | 37 (3.4%) |
| 60 to 89 Minutes | 40 (4.0%) | 43 (4.0%) |
| 90 or more Minutes | 32 (3.2%) | 31 (2.9%) |
Time of Departure to Work by Sex in Chelsea
The most frequent times of departure to work in Chelsea are 6:30 AM to 6:59 AM (246, 24.6%) for males and 7:30 AM to 7:59 AM (195, 18.1%) for females.
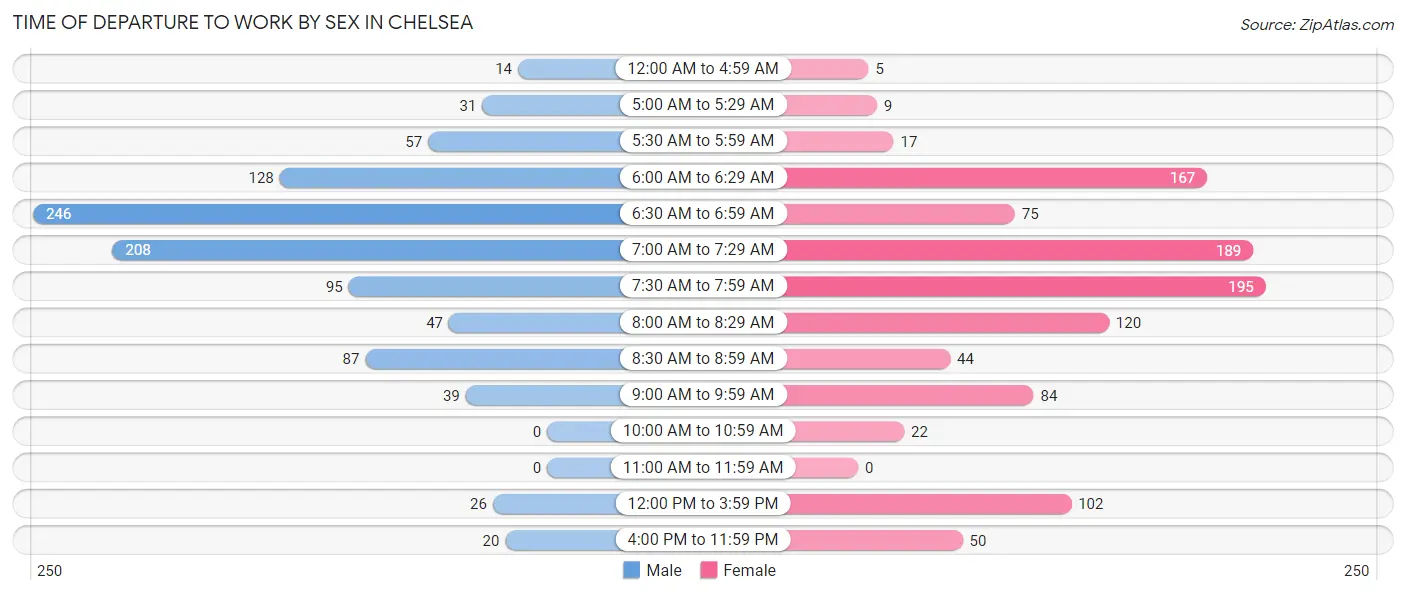
| Time of Departure | Male | Female |
| 12:00 AM to 4:59 AM | 14 (1.4%) | 5 (0.5%) |
| 5:00 AM to 5:29 AM | 31 (3.1%) | 9 (0.8%) |
| 5:30 AM to 5:59 AM | 57 (5.7%) | 17 (1.6%) |
| 6:00 AM to 6:29 AM | 128 (12.8%) | 167 (15.5%) |
| 6:30 AM to 6:59 AM | 246 (24.6%) | 75 (7.0%) |
| 7:00 AM to 7:29 AM | 208 (20.8%) | 189 (17.5%) |
| 7:30 AM to 7:59 AM | 95 (9.5%) | 195 (18.1%) |
| 8:00 AM to 8:29 AM | 47 (4.7%) | 120 (11.1%) |
| 8:30 AM to 8:59 AM | 87 (8.7%) | 44 (4.1%) |
| 9:00 AM to 9:59 AM | 39 (3.9%) | 84 (7.8%) |
| 10:00 AM to 10:59 AM | 0 (0.0%) | 22 (2.0%) |
| 11:00 AM to 11:59 AM | 0 (0.0%) | 0 (0.0%) |
| 12:00 PM to 3:59 PM | 26 (2.6%) | 102 (9.5%) |
| 4:00 PM to 11:59 PM | 20 (2.0%) | 50 (4.6%) |
| Total | 998 (100.0%) | 1,079 (100.0%) |
Housing Occupancy in Chelsea
Occupancy by Ownership in Chelsea
Of the total 2,617 dwellings in Chelsea, owner-occupied units account for 1,668 (63.7%), while renter-occupied units make up 949 (36.3%).
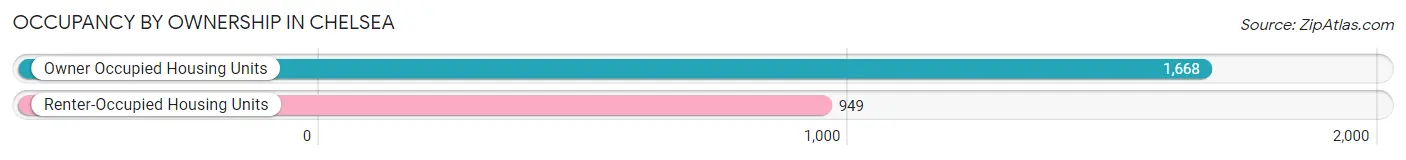
| Occupancy | # Housing Units | % Housing Units |
| Owner Occupied Housing Units | 1,668 | 63.7% |
| Renter-Occupied Housing Units | 949 | 36.3% |
| Total Occupied Housing Units | 2,617 | 100.0% |
Occupancy by Household Size in Chelsea
| Household Size | # Housing Units | % Housing Units |
| 1-Person Household | 1,207 | 46.1% |
| 2-Person Household | 705 | 26.9% |
| 3-Person Household | 268 | 10.2% |
| 4+ Person Household | 437 | 16.7% |
| Total Housing Units | 2,617 | 100.0% |
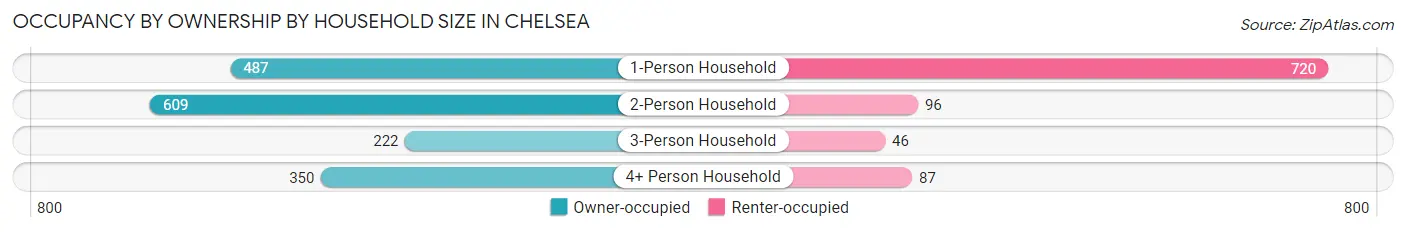
Occupancy by Ownership by Household Size in Chelsea
| Household Size | Owner-occupied | Renter-occupied |
| 1-Person Household | 487 (40.4%) | 720 (59.7%) |
| 2-Person Household | 609 (86.4%) | 96 (13.6%) |
| 3-Person Household | 222 (82.8%) | 46 (17.2%) |
| 4+ Person Household | 350 (80.1%) | 87 (19.9%) |
| Total Housing Units | 1,668 (63.7%) | 949 (36.3%) |
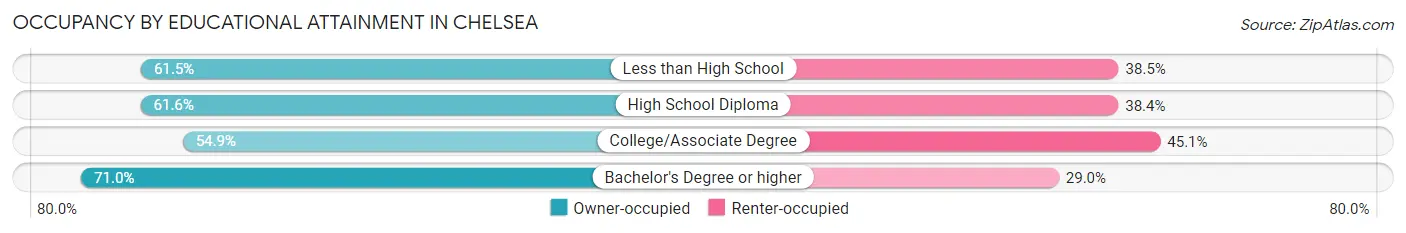
Occupancy by Educational Attainment in Chelsea
| Household Size | Owner-occupied | Renter-occupied |
| Less than High School | 24 (61.5%) | 15 (38.5%) |
| High School Diploma | 194 (61.6%) | 121 (38.4%) |
| College/Associate Degree | 536 (54.9%) | 440 (45.1%) |
| Bachelor's Degree or higher | 914 (71.0%) | 373 (29.0%) |
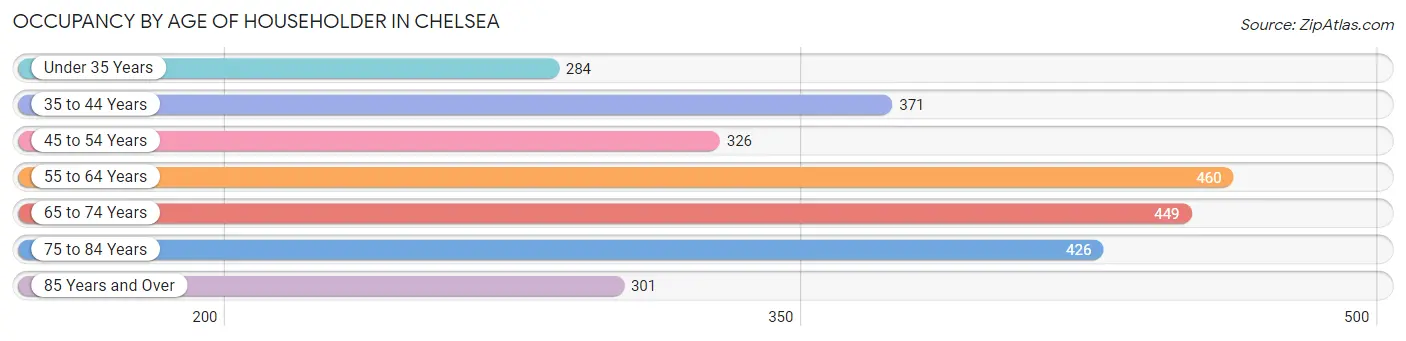
Occupancy by Age of Householder in Chelsea
| Age Bracket | # Households | % Households |
| Under 35 Years | 284 | 10.8% |
| 35 to 44 Years | 371 | 14.2% |
| 45 to 54 Years | 326 | 12.5% |
| 55 to 64 Years | 460 | 17.6% |
| 65 to 74 Years | 449 | 17.2% |
| 75 to 84 Years | 426 | 16.3% |
| 85 Years and Over | 301 | 11.5% |
| Total | 2,617 | 100.0% |
Housing Finances in Chelsea
Median Income by Occupancy in Chelsea
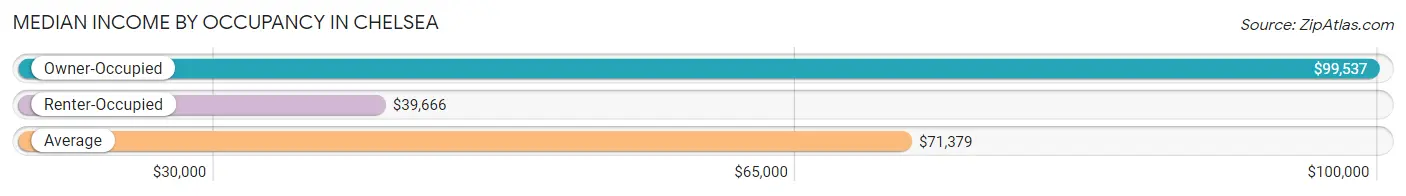
| Occupancy Type | # Households | Median Income |
| Owner-Occupied | 1,668 (63.7%) | $99,537 |
| Renter-Occupied | 949 (36.3%) | $39,666 |
| Average | 2,617 (100.0%) | $71,379 |
Occupancy by Householder Income Bracket in Chelsea
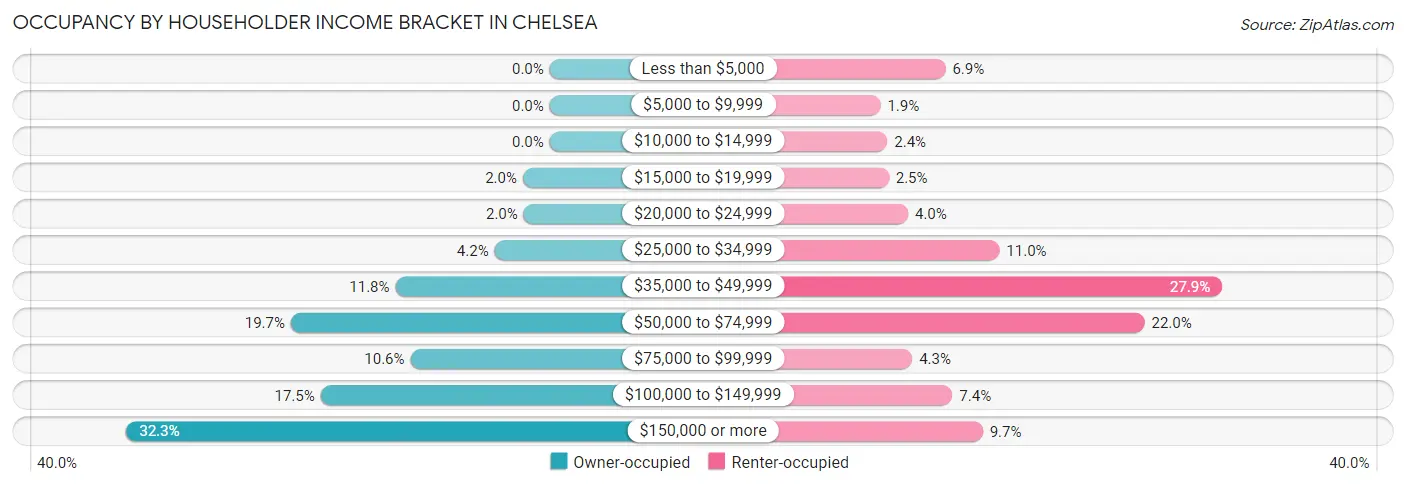
| Income Bracket | Owner-occupied | Renter-occupied |
| Less than $5,000 | 0 (0.0%) | 65 (6.9%) |
| $5,000 to $9,999 | 0 (0.0%) | 18 (1.9%) |
| $10,000 to $14,999 | 0 (0.0%) | 23 (2.4%) |
| $15,000 to $19,999 | 34 (2.0%) | 24 (2.5%) |
| $20,000 to $24,999 | 33 (2.0%) | 38 (4.0%) |
| $25,000 to $34,999 | 70 (4.2%) | 104 (11.0%) |
| $35,000 to $49,999 | 196 (11.7%) | 265 (27.9%) |
| $50,000 to $74,999 | 329 (19.7%) | 209 (22.0%) |
| $75,000 to $99,999 | 177 (10.6%) | 41 (4.3%) |
| $100,000 to $149,999 | 291 (17.4%) | 70 (7.4%) |
| $150,000 or more | 538 (32.3%) | 92 (9.7%) |
| Total | 1,668 (100.0%) | 949 (100.0%) |
Monthly Housing Cost Tiers in Chelsea
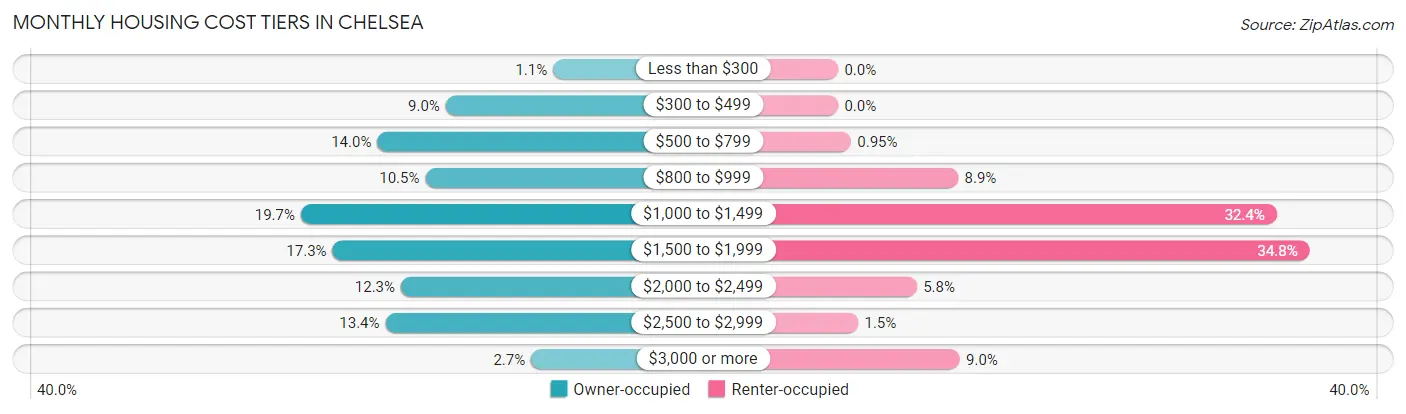
| Monthly Cost | Owner-occupied | Renter-occupied |
| Less than $300 | 18 (1.1%) | 0 (0.0%) |
| $300 to $499 | 150 (9.0%) | 0 (0.0%) |
| $500 to $799 | 234 (14.0%) | 9 (0.9%) |
| $800 to $999 | 175 (10.5%) | 84 (8.8%) |
| $1,000 to $1,499 | 328 (19.7%) | 307 (32.4%) |
| $1,500 to $1,999 | 289 (17.3%) | 330 (34.8%) |
| $2,000 to $2,499 | 205 (12.3%) | 55 (5.8%) |
| $2,500 to $2,999 | 224 (13.4%) | 14 (1.5%) |
| $3,000 or more | 45 (2.7%) | 85 (9.0%) |
| Total | 1,668 (100.0%) | 949 (100.0%) |
Physical Housing Characteristics in Chelsea
Housing Structures in Chelsea
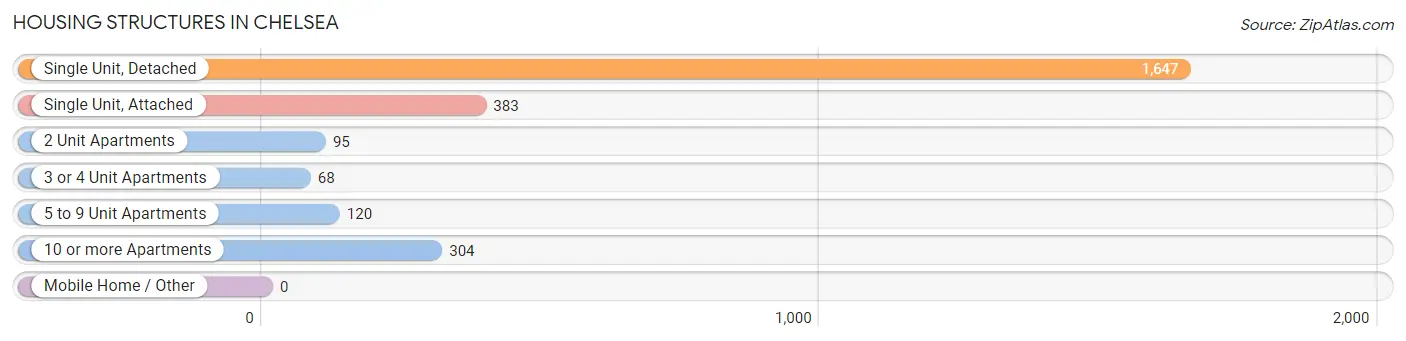
| Structure Type | # Housing Units | % Housing Units |
| Single Unit, Detached | 1,647 | 62.9% |
| Single Unit, Attached | 383 | 14.6% |
| 2 Unit Apartments | 95 | 3.6% |
| 3 or 4 Unit Apartments | 68 | 2.6% |
| 5 to 9 Unit Apartments | 120 | 4.6% |
| 10 or more Apartments | 304 | 11.6% |
| Mobile Home / Other | 0 | 0.0% |
| Total | 2,617 | 100.0% |
Housing Structures by Occupancy in Chelsea
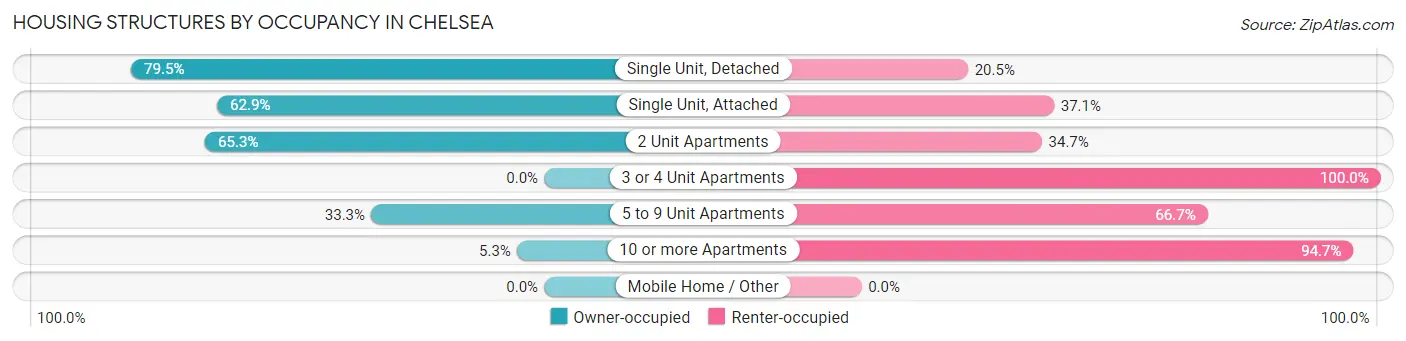
| Structure Type | Owner-occupied | Renter-occupied |
| Single Unit, Detached | 1,309 (79.5%) | 338 (20.5%) |
| Single Unit, Attached | 241 (62.9%) | 142 (37.1%) |
| 2 Unit Apartments | 62 (65.3%) | 33 (34.7%) |
| 3 or 4 Unit Apartments | 0 (0.0%) | 68 (100.0%) |
| 5 to 9 Unit Apartments | 40 (33.3%) | 80 (66.7%) |
| 10 or more Apartments | 16 (5.3%) | 288 (94.7%) |
| Mobile Home / Other | 0 (0.0%) | 0 (0.0%) |
| Total | 1,668 (63.7%) | 949 (36.3%) |
Housing Structures by Number of Rooms in Chelsea
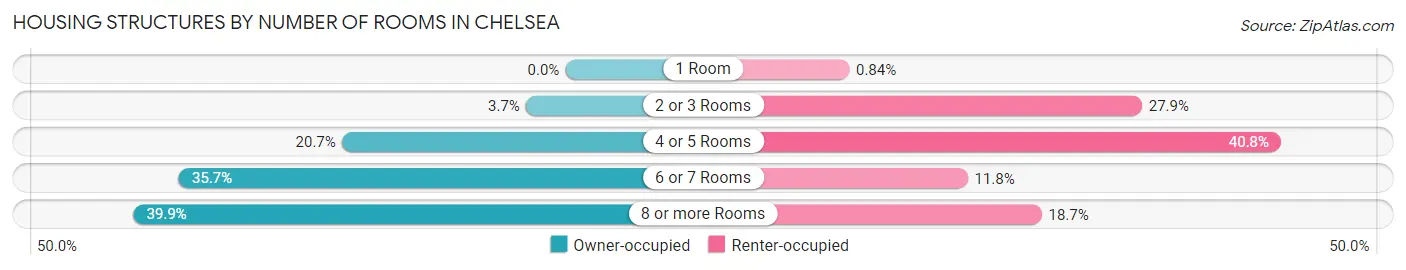
| Number of Rooms | Owner-occupied | Renter-occupied |
| 1 Room | 0 (0.0%) | 8 (0.8%) |
| 2 or 3 Rooms | 61 (3.7%) | 265 (27.9%) |
| 4 or 5 Rooms | 345 (20.7%) | 387 (40.8%) |
| 6 or 7 Rooms | 596 (35.7%) | 112 (11.8%) |
| 8 or more Rooms | 666 (39.9%) | 177 (18.6%) |
| Total | 1,668 (100.0%) | 949 (100.0%) |
Housing Structure by Heating Type in Chelsea
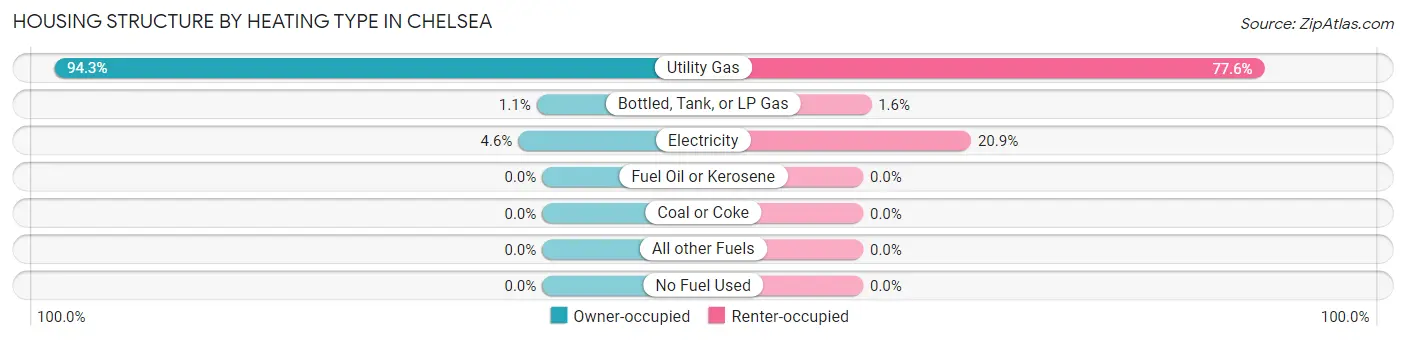
| Heating Type | Owner-occupied | Renter-occupied |
| Utility Gas | 1,573 (94.3%) | 736 (77.6%) |
| Bottled, Tank, or LP Gas | 18 (1.1%) | 15 (1.6%) |
| Electricity | 77 (4.6%) | 198 (20.9%) |
| Fuel Oil or Kerosene | 0 (0.0%) | 0 (0.0%) |
| Coal or Coke | 0 (0.0%) | 0 (0.0%) |
| All other Fuels | 0 (0.0%) | 0 (0.0%) |
| No Fuel Used | 0 (0.0%) | 0 (0.0%) |
| Total | 1,668 (100.0%) | 949 (100.0%) |
Household Vehicle Usage in Chelsea
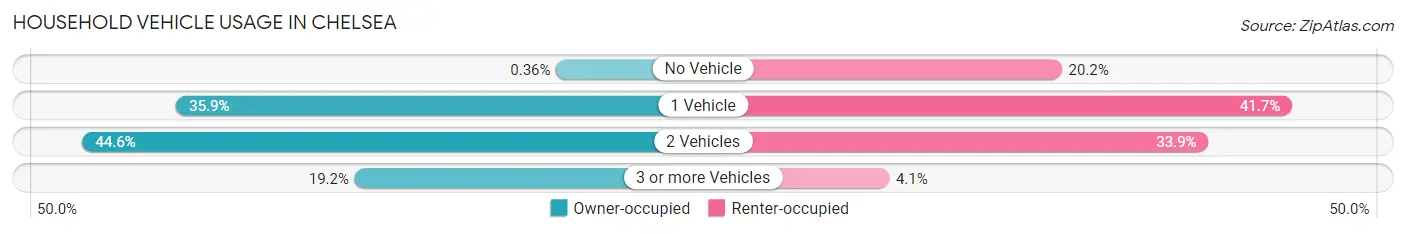
| Vehicles per Household | Owner-occupied | Renter-occupied |
| No Vehicle | 6 (0.4%) | 192 (20.2%) |
| 1 Vehicle | 598 (35.8%) | 396 (41.7%) |
| 2 Vehicles | 744 (44.6%) | 322 (33.9%) |
| 3 or more Vehicles | 320 (19.2%) | 39 (4.1%) |
| Total | 1,668 (100.0%) | 949 (100.0%) |
Real Estate & Mortgages in Chelsea
Real Estate and Mortgage Overview in Chelsea
| Characteristic | Without Mortgage | With Mortgage |
| Housing Units | 616 | 1,052 |
| Median Property Value | $260,900 | $308,400 |
| Median Household Income | $66,111 | $440 |
| Monthly Housing Costs | $721 | $45 |
| Real Estate Taxes | $4,238 | $0 |
Property Value by Mortgage Status in Chelsea
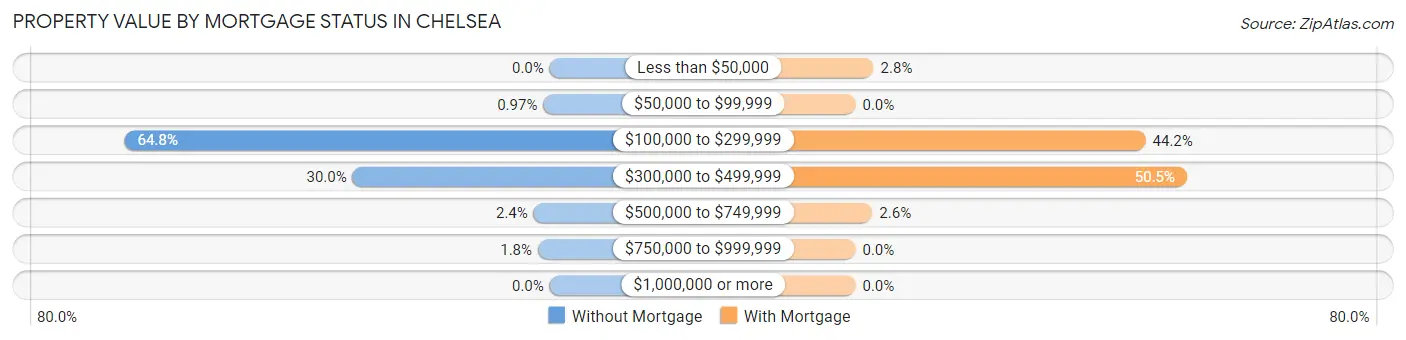
| Property Value | Without Mortgage | With Mortgage |
| Less than $50,000 | 0 (0.0%) | 29 (2.8%) |
| $50,000 to $99,999 | 6 (1.0%) | 0 (0.0%) |
| $100,000 to $299,999 | 399 (64.8%) | 465 (44.2%) |
| $300,000 to $499,999 | 185 (30.0%) | 531 (50.5%) |
| $500,000 to $749,999 | 15 (2.4%) | 27 (2.6%) |
| $750,000 to $999,999 | 11 (1.8%) | 0 (0.0%) |
| $1,000,000 or more | 0 (0.0%) | 0 (0.0%) |
| Total | 616 (100.0%) | 1,052 (100.0%) |
Household Income by Mortgage Status in Chelsea
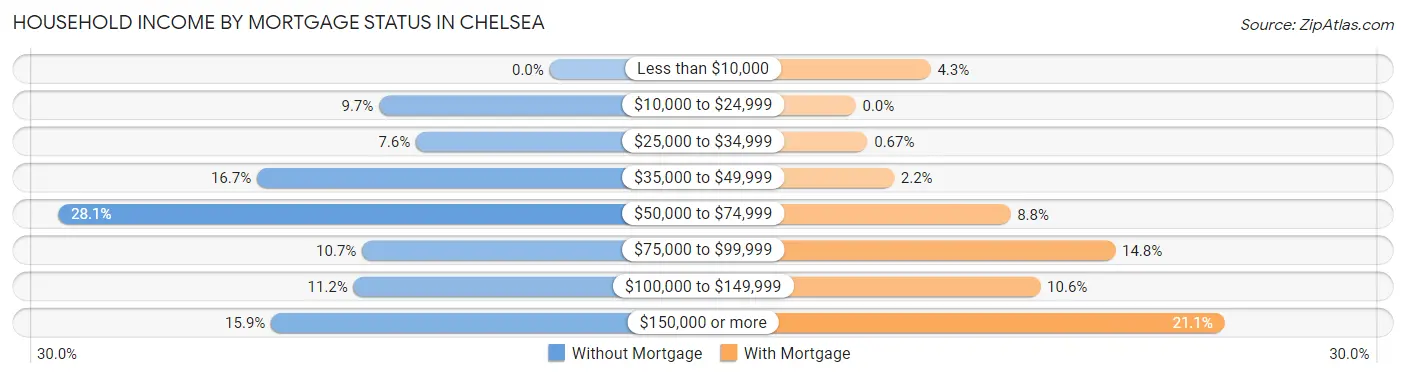
| Household Income | Without Mortgage | With Mortgage |
| Less than $10,000 | 0 (0.0%) | 45 (4.3%) |
| $10,000 to $24,999 | 60 (9.7%) | 0 (0.0%) |
| $25,000 to $34,999 | 47 (7.6%) | 7 (0.7%) |
| $35,000 to $49,999 | 103 (16.7%) | 23 (2.2%) |
| $50,000 to $74,999 | 173 (28.1%) | 93 (8.8%) |
| $75,000 to $99,999 | 66 (10.7%) | 156 (14.8%) |
| $100,000 to $149,999 | 69 (11.2%) | 111 (10.5%) |
| $150,000 or more | 98 (15.9%) | 222 (21.1%) |
| Total | 616 (100.0%) | 1,052 (100.0%) |
Property Value to Household Income Ratio in Chelsea
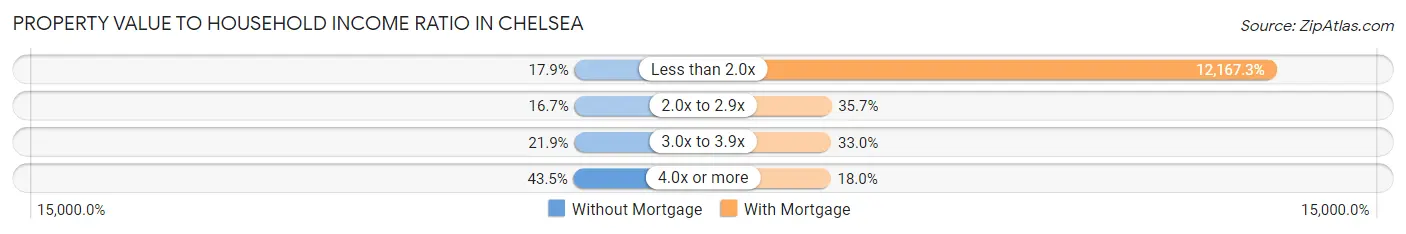
| Value-to-Income Ratio | Without Mortgage | With Mortgage |
| Less than 2.0x | 110 (17.9%) | 128,000 (12,167.3%) |
| 2.0x to 2.9x | 103 (16.7%) | 375 (35.6%) |
| 3.0x to 3.9x | 135 (21.9%) | 347 (33.0%) |
| 4.0x or more | 268 (43.5%) | 189 (18.0%) |
| Total | 616 (100.0%) | 1,052 (100.0%) |
Real Estate Taxes by Mortgage Status in Chelsea
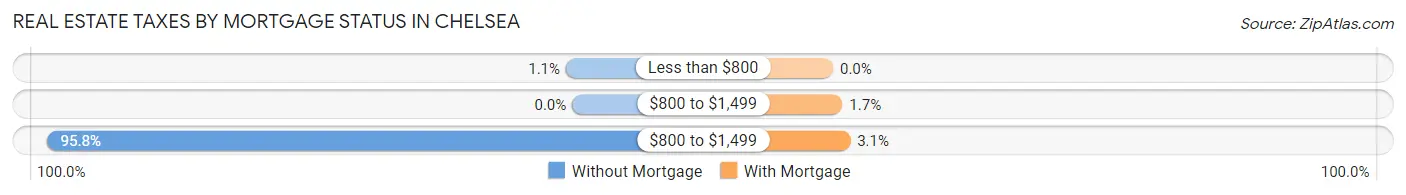
| Property Taxes | Without Mortgage | With Mortgage |
| Less than $800 | 7 (1.1%) | 0 (0.0%) |
| $800 to $1,499 | 0 (0.0%) | 18 (1.7%) |
| $800 to $1,499 | 590 (95.8%) | 33 (3.1%) |
| Total | 616 (100.0%) | 1,052 (100.0%) |
Health & Disability in Chelsea
Health Insurance Coverage by Age in Chelsea
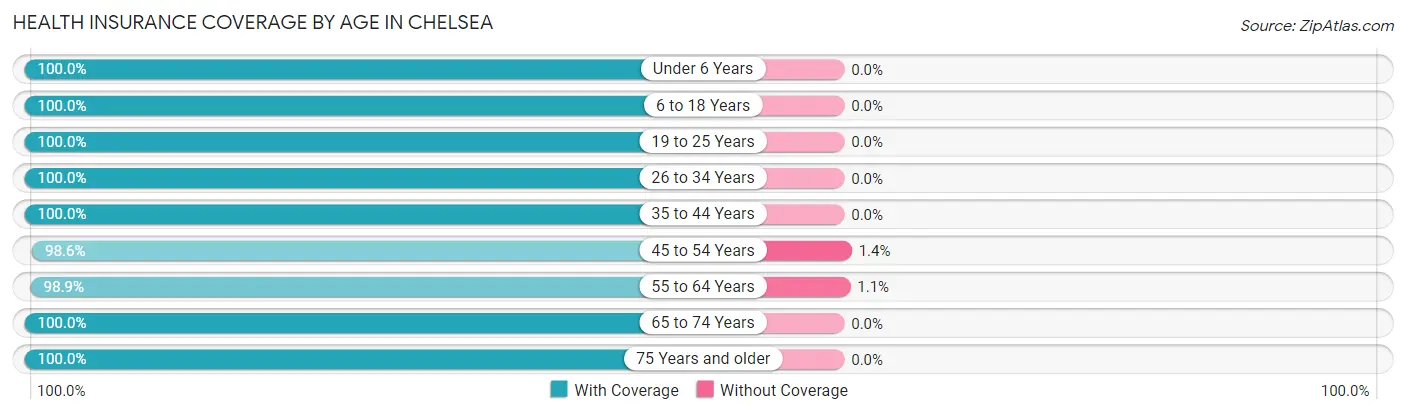
| Age Bracket | With Coverage | Without Coverage |
| Under 6 Years | 204 (100.0%) | 0 (0.0%) |
| 6 to 18 Years | 829 (100.0%) | 0 (0.0%) |
| 19 to 25 Years | 264 (100.0%) | 0 (0.0%) |
| 26 to 34 Years | 512 (100.0%) | 0 (0.0%) |
| 35 to 44 Years | 616 (100.0%) | 0 (0.0%) |
| 45 to 54 Years | 569 (98.6%) | 8 (1.4%) |
| 55 to 64 Years | 699 (98.9%) | 8 (1.1%) |
| 65 to 74 Years | 667 (100.0%) | 0 (0.0%) |
| 75 Years and older | 920 (100.0%) | 0 (0.0%) |
| Total | 5,280 (99.7%) | 16 (0.3%) |
Health Insurance Coverage by Citizenship Status in Chelsea
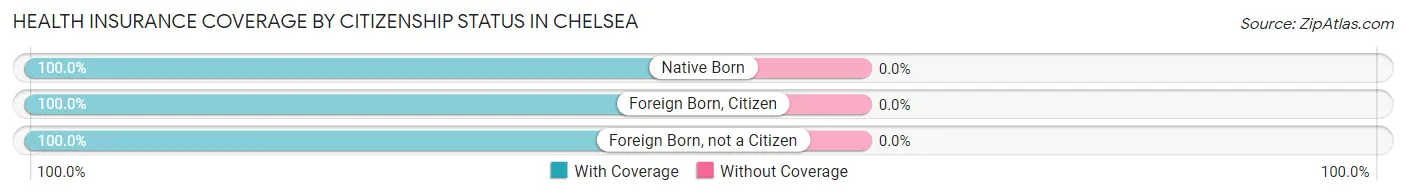
| Citizenship Status | With Coverage | Without Coverage |
| Native Born | 204 (100.0%) | 0 (0.0%) |
| Foreign Born, Citizen | 829 (100.0%) | 0 (0.0%) |
| Foreign Born, not a Citizen | 264 (100.0%) | 0 (0.0%) |
Health Insurance Coverage by Household Income in Chelsea
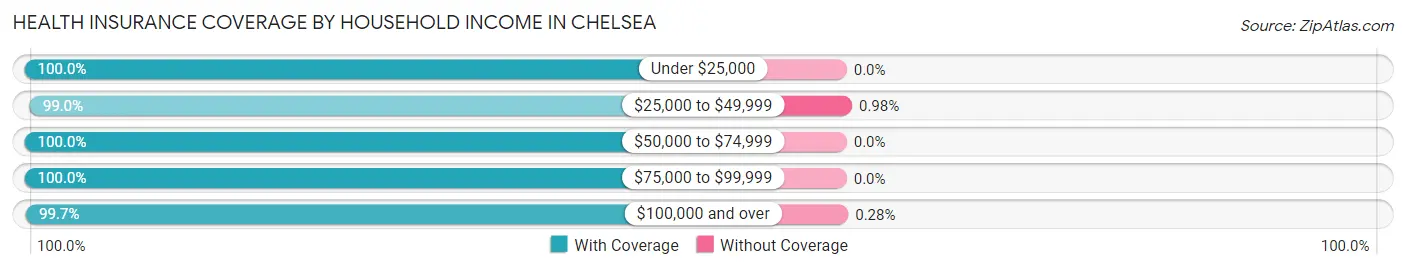
| Household Income | With Coverage | Without Coverage |
| Under $25,000 | 271 (100.0%) | 0 (0.0%) |
| $25,000 to $49,999 | 808 (99.0%) | 8 (1.0%) |
| $50,000 to $74,999 | 899 (100.0%) | 0 (0.0%) |
| $75,000 to $99,999 | 448 (100.0%) | 0 (0.0%) |
| $100,000 and over | 2,848 (99.7%) | 8 (0.3%) |
Public vs Private Health Insurance Coverage by Age in Chelsea
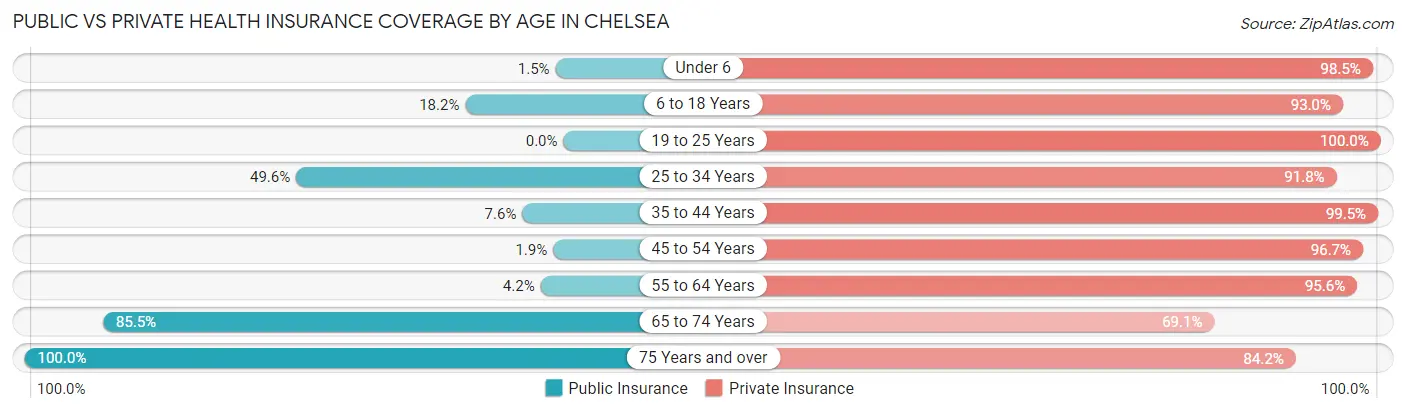
| Age Bracket | Public Insurance | Private Insurance |
| Under 6 | 3 (1.5%) | 201 (98.5%) |
| 6 to 18 Years | 151 (18.2%) | 771 (93.0%) |
| 19 to 25 Years | 0 (0.0%) | 264 (100.0%) |
| 25 to 34 Years | 254 (49.6%) | 470 (91.8%) |
| 35 to 44 Years | 47 (7.6%) | 613 (99.5%) |
| 45 to 54 Years | 11 (1.9%) | 558 (96.7%) |
| 55 to 64 Years | 30 (4.2%) | 676 (95.6%) |
| 65 to 74 Years | 570 (85.5%) | 461 (69.1%) |
| 75 Years and over | 920 (100.0%) | 775 (84.2%) |
| Total | 1,986 (37.5%) | 4,789 (90.4%) |
Disability Status by Sex by Age in Chelsea
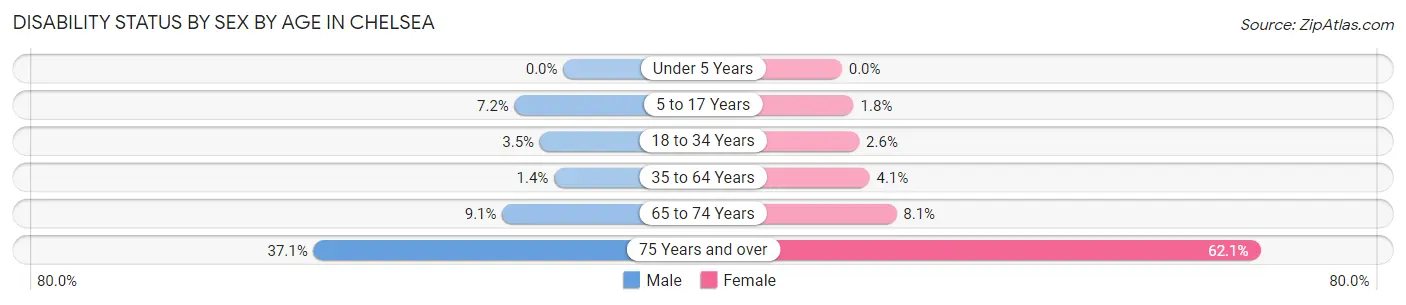
| Age Bracket | Male | Female |
| Under 5 Years | 0 (0.0%) | 0 (0.0%) |
| 5 to 17 Years | 30 (7.2%) | 6 (1.8%) |
| 18 to 34 Years | 16 (3.5%) | 11 (2.6%) |
| 35 to 64 Years | 12 (1.4%) | 42 (4.1%) |
| 65 to 74 Years | 28 (9.1%) | 29 (8.1%) |
| 75 Years and over | 112 (37.1%) | 384 (62.1%) |
Disability Class by Sex by Age in Chelsea
Disability Class: Hearing Difficulty
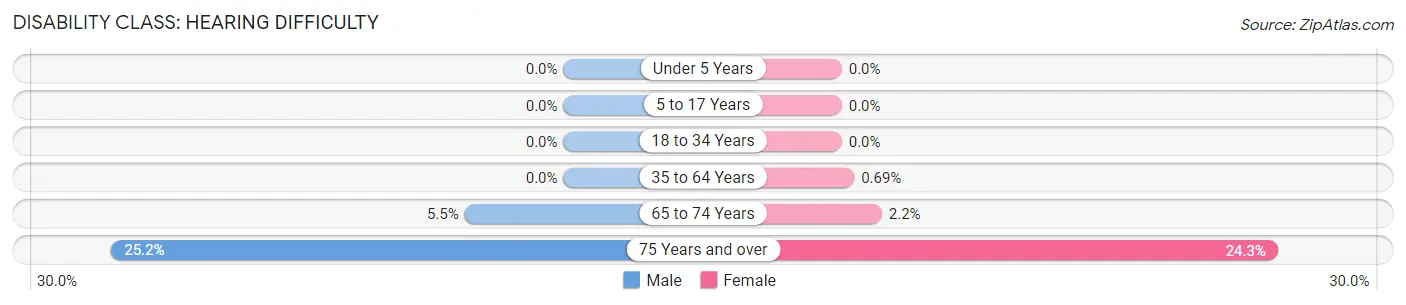
| Age Bracket | Male | Female |
| Under 5 Years | 0 (0.0%) | 0 (0.0%) |
| 5 to 17 Years | 0 (0.0%) | 0 (0.0%) |
| 18 to 34 Years | 0 (0.0%) | 0 (0.0%) |
| 35 to 64 Years | 0 (0.0%) | 7 (0.7%) |
| 65 to 74 Years | 17 (5.5%) | 8 (2.2%) |
| 75 Years and over | 76 (25.2%) | 150 (24.3%) |
Disability Class: Vision Difficulty
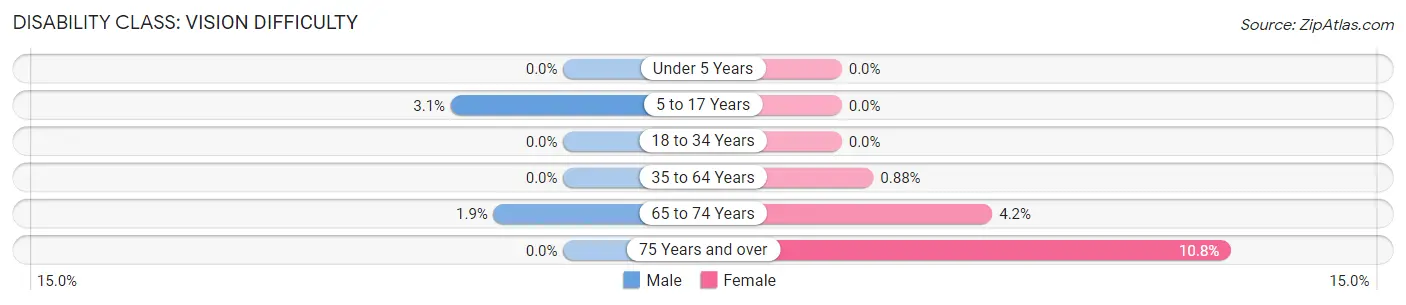
| Age Bracket | Male | Female |
| Under 5 Years | 0 (0.0%) | 0 (0.0%) |
| 5 to 17 Years | 13 (3.1%) | 0 (0.0%) |
| 18 to 34 Years | 0 (0.0%) | 0 (0.0%) |
| 35 to 64 Years | 0 (0.0%) | 9 (0.9%) |
| 65 to 74 Years | 6 (1.9%) | 15 (4.2%) |
| 75 Years and over | 0 (0.0%) | 67 (10.8%) |
Disability Class: Cognitive Difficulty
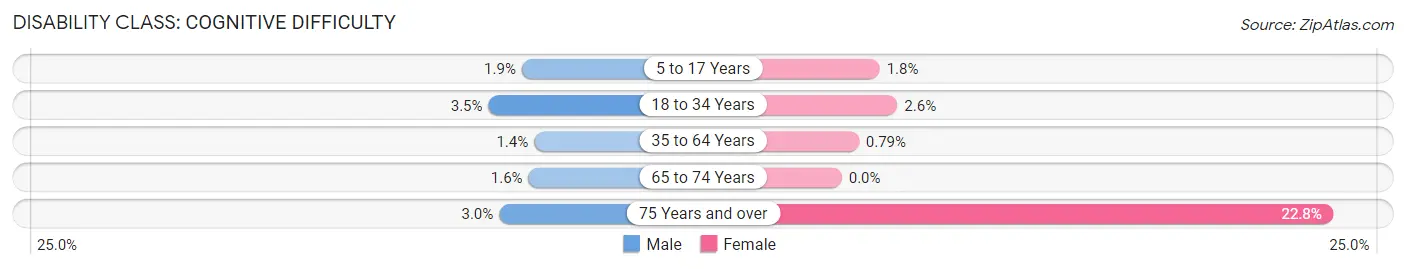
| Age Bracket | Male | Female |
| 5 to 17 Years | 8 (1.9%) | 6 (1.8%) |
| 18 to 34 Years | 16 (3.5%) | 11 (2.6%) |
| 35 to 64 Years | 12 (1.4%) | 8 (0.8%) |
| 65 to 74 Years | 5 (1.6%) | 0 (0.0%) |
| 75 Years and over | 9 (3.0%) | 141 (22.8%) |
Disability Class: Ambulatory Difficulty
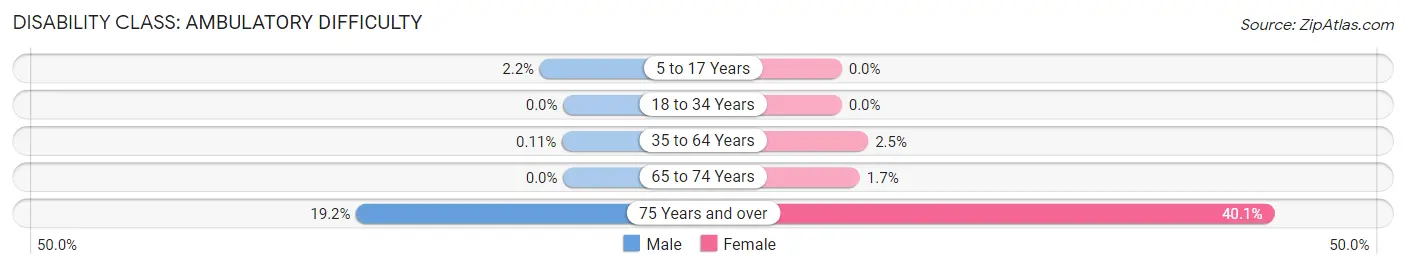
| Age Bracket | Male | Female |
| 5 to 17 Years | 9 (2.2%) | 0 (0.0%) |
| 18 to 34 Years | 0 (0.0%) | 0 (0.0%) |
| 35 to 64 Years | 1 (0.1%) | 25 (2.5%) |
| 65 to 74 Years | 0 (0.0%) | 6 (1.7%) |
| 75 Years and over | 58 (19.2%) | 248 (40.1%) |
Disability Class: Self-Care Difficulty
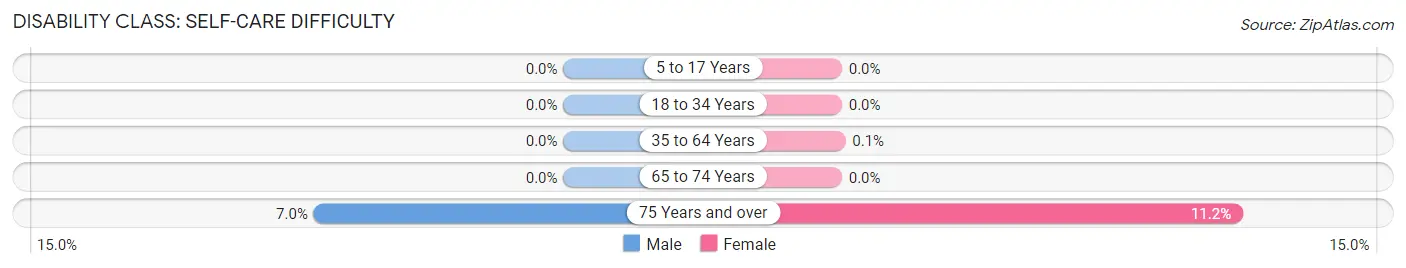
| Age Bracket | Male | Female |
| 5 to 17 Years | 0 (0.0%) | 0 (0.0%) |
| 18 to 34 Years | 0 (0.0%) | 0 (0.0%) |
| 35 to 64 Years | 0 (0.0%) | 1 (0.1%) |
| 65 to 74 Years | 0 (0.0%) | 0 (0.0%) |
| 75 Years and over | 21 (7.0%) | 69 (11.2%) |
Technology Access in Chelsea
Computing Device Access in Chelsea
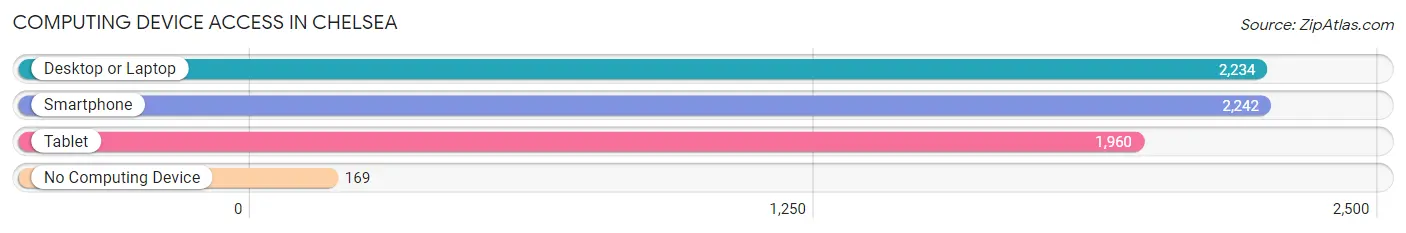
| Device Type | # Households | % Households |
| Desktop or Laptop | 2,234 | 85.4% |
| Smartphone | 2,242 | 85.7% |
| Tablet | 1,960 | 74.9% |
| No Computing Device | 169 | 6.5% |
| Total | 2,617 | 100.0% |
Internet Access in Chelsea
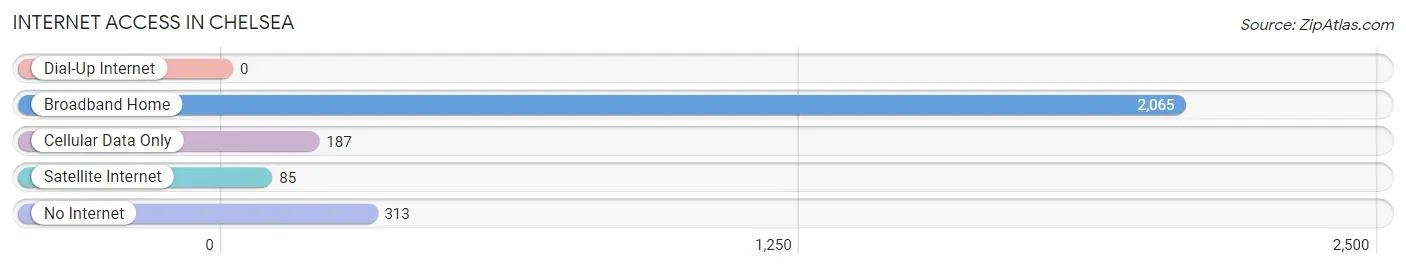
| Internet Type | # Households | % Households |
| Dial-Up Internet | 0 | 0.0% |
| Broadband Home | 2,065 | 78.9% |
| Cellular Data Only | 187 | 7.1% |
| Satellite Internet | 85 | 3.3% |
| No Internet | 313 | 12.0% |
| Total | 2,617 | 100.0% |
Chelsea Summary
Chelsea, Michigan is a small city located in Washtenaw County, Michigan. It is situated about 15 miles west of Ann Arbor and about 30 miles west of Detroit. The city has a population of about 5,000 people and is part of the Ann Arbor Metropolitan Statistical Area.
History
The area that is now Chelsea was first settled in 1834 by a group of settlers from New York. The settlement was originally called “Buckley” after the first settler, John Buckley. In 1836, the settlement was renamed “Chelsea” after the town of Chelsea, Massachusetts. The town was officially incorporated in 1867.
In the late 19th century, Chelsea was a thriving agricultural community. The town was known for its production of apples, peaches, and other fruits. In the early 20th century, the town began to diversify its economy with the addition of several factories. These factories included a canning factory, a furniture factory, and a paper mill.
Geography
Chelsea is located in southeastern Michigan, about 15 miles west of Ann Arbor and 30 miles west of Detroit. The city is situated on the banks of the Huron River, which flows through the city. The city is surrounded by rolling hills and is located in a region of Michigan known as the “Irish Hills”.
The city has a total area of 2.6 square miles, all of which is land. The city is located in a humid continental climate zone, with hot summers and cold winters. The average annual temperature is about 48 degrees Fahrenheit.
Economy
The economy of Chelsea is largely based on manufacturing and tourism. The city is home to several factories, including a furniture factory, a paper mill, and a canning factory. The city is also home to several tourist attractions, including the Chelsea Milling Company, the Chelsea Depot Museum, and the Chelsea Alehouse Brewery.
The city is also home to several small businesses, including restaurants, retail stores, and professional services. The city is also home to several educational institutions, including the University of Michigan-Dearborn, Cleary University, and Washtenaw Community College.
Demographics
As of the 2010 census, the population of Chelsea was 5,000. The racial makeup of the city was 94.3% White, 1.7% African American, 0.3% Native American, 1.2% Asian, 0.1% Pacific Islander, 0.7% from other races, and 1.9% from two or more races. Hispanic or Latino of any race were 2.3% of the population.
The median income for a household in the city was $50,000, and the median income for a family was $60,000. The per capita income for the city was $25,000. About 8.3% of families and 10.3% of the population were below the poverty line, including 14.3% of those under age 18 and 5.3% of those age 65 or over.
Chelsea is a small city with a rich history and a diverse economy. The city is home to several factories, tourist attractions, and small businesses. The city is also home to several educational institutions and has a diverse population. Chelsea is a great place to live, work, and visit.
Common Questions
What is Per Capita Income in Chelsea?
Per Capita income in Chelsea is $50,479.
What is the Median Family Income in Chelsea?
Median Family Income in Chelsea is $135,685.
What is the Median Household income in Chelsea?
Median Household Income in Chelsea is $71,379.
What is Income or Wage Gap in Chelsea?
Income or Wage Gap in Chelsea is 38.0%.
Women in Chelsea earn 62.0 cents for every dollar earned by a man.
What is Inequality or Gini Index in Chelsea?
Inequality or Gini Index in Chelsea is 0.44.
What is the Total Population of Chelsea?
Total Population of Chelsea is 5,440.
What is the Total Male Population of Chelsea?
Total Male Population of Chelsea is 2,506.
What is the Total Female Population of Chelsea?
Total Female Population of Chelsea is 2,934.
What is the Ratio of Males per 100 Females in Chelsea?
There are 85.41 Males per 100 Females in Chelsea.
What is the Ratio of Females per 100 Males in Chelsea?
There are 117.08 Females per 100 Males in Chelsea.
What is the Median Population Age in Chelsea?
Median Population Age in Chelsea is 50.1 Years.
What is the Average Family Size in Chelsea
Average Family Size in Chelsea is 2.9 People.
What is the Average Household Size in Chelsea
Average Household Size in Chelsea is 2.0 People.
How Large is the Labor Force in Chelsea?
There are 2,530 People in the Labor Forcein in Chelsea.
What is the Percentage of People in the Labor Force in Chelsea?
54.5% of People are in the Labor Force in Chelsea.
What is the Unemployment Rate in Chelsea?
Unemployment Rate in Chelsea is 1.3%.