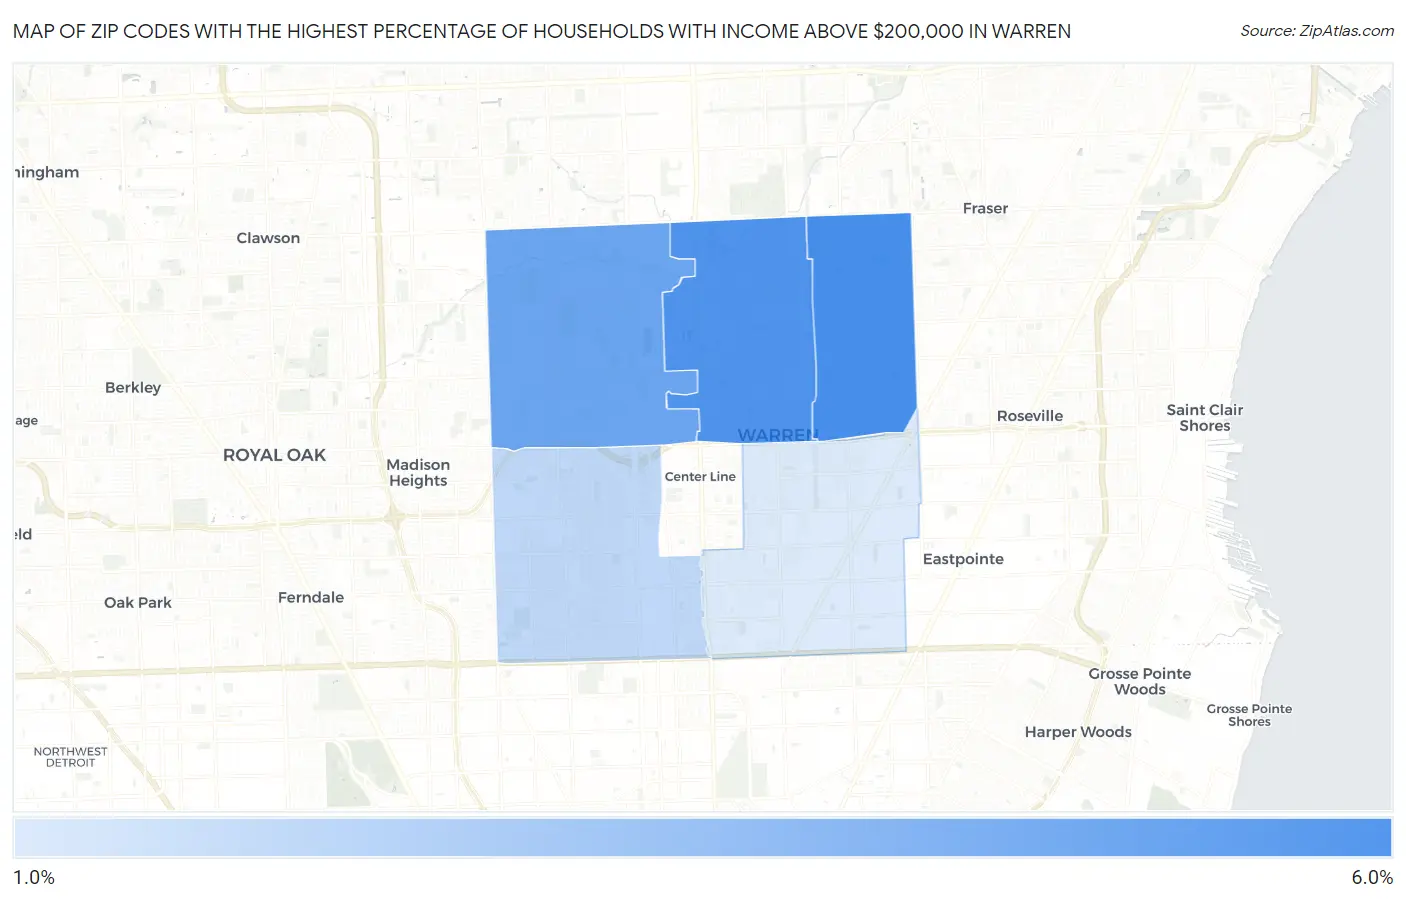
Zip Codes with the Highest Percentage of Households with Income Above $200,000 in Warren, MI
RELATED REPORTS & OPTIONS
Household Income | $200k+
Warren
Compare Zip Codes
Map of Zip Codes with the Highest Percentage of Households with Income Above $200,000 in Warren
1.8%
5.9%
Zip Codes with the Highest Percentage of Households with Income Above $200,000 in Warren, MI
| Zip Code | Households with Income > $200k | vs State | vs National | |
| 1. | 48088 | 5.9% | 8.2%(-2.30)#333 | 11.4%(-5.50)#13,651 |
| 2. | 48093 | 5.7% | 8.2%(-2.50)#345 | 11.4%(-5.70)#14,078 |
| 3. | 48092 | 4.9% | 8.2%(-3.30)#406 | 11.4%(-6.50)#15,833 |
| 4. | 48091 | 2.6% | 8.2%(-5.60)#656 | 11.4%(-8.80)#22,011 |
| 5. | 48089 | 1.8% | 8.2%(-6.40)#783 | 11.4%(-9.60)#24,295 |
1
Common Questions
What are the Top 3 Zip Codes with the Highest Percentage of Households with Income Above $200,000 in Warren, MI?
Top 3 Zip Codes with the Highest Percentage of Households with Income Above $200,000 in Warren, MI are:
What zip code has the Highest Percentage of Households with Income Above $200,000 in Warren, MI?
48088 has the Highest Percentage of Households with Income Above $200,000 in Warren, MI with 5.9%.
What is the Percentage of Households with Income Above $200,000 in Warren, MI?
Percentage of Households with Income Above $200,000 in Warren is 4.0%.
What is the Percentage of Households with Income Above $200,000 in Michigan?
Percentage of Households with Income Above $200,000 in Michigan is 8.2%.
What is the Percentage of Households with Income Above $200,000 in the United States?
Percentage of Households with Income Above $200,000 in the United States is 11.4%.