Linden, MI Map & Demographics
Linden Map
Linden Overview
$39,188
PER CAPITA INCOME
$97,554
AVG FAMILY INCOME
$85,917
AVG HOUSEHOLD INCOME
13.6%
WAGE / INCOME GAP [ % ]
86.4¢/ $1
WAGE / INCOME GAP [ $ ]
0.40
INEQUALITY / GINI INDEX
4,125
TOTAL POPULATION
1,764
MALE POPULATION
2,361
FEMALE POPULATION
74.71
MALES / 100 FEMALES
133.84
FEMALES / 100 MALES
40.0
MEDIAN AGE
3.3
AVG FAMILY SIZE
2.7
AVG HOUSEHOLD SIZE
1,860
LABOR FORCE [ PEOPLE ]
57.6%
PERCENT IN LABOR FORCE
9.7%
UNEMPLOYMENT RATE
Linden Zip Codes
Linden Area Codes
Income in Linden
Income Overview in Linden
Per Capita Income in Linden is $39,188, while median incomes of families and households are $97,554 and $85,917 respectively.
| Characteristic | Number | Measure |
| Per Capita Income | 4,125 | $39,188 |
| Median Family Income | 969 | $97,554 |
| Mean Family Income | 969 | $124,718 |
| Median Household Income | 1,501 | $85,917 |
| Mean Household Income | 1,501 | $103,626 |
| Income Deficit | 969 | $0 |
| Wage / Income Gap (%) | 4,125 | 13.60% |
| Wage / Income Gap ($) | 4,125 | 86.40¢ per $1 |
| Gini / Inequality Index | 4,125 | 0.40 |
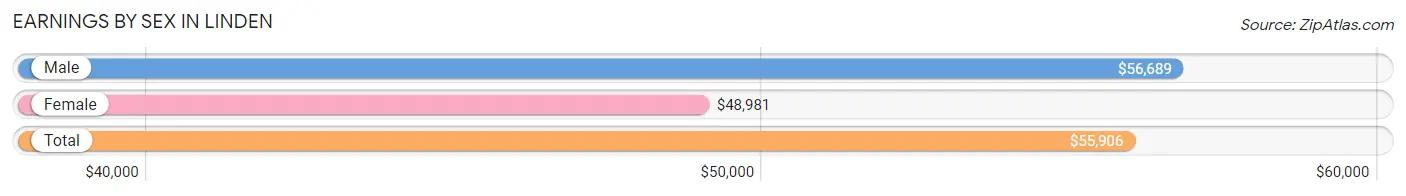
Earnings by Sex in Linden
Average Earnings in Linden are $55,906, $56,689 for men and $48,981 for women, a difference of 13.6%.
| Sex | Number | Average Earnings |
| Male | 1,080 (55.7%) | $56,689 |
| Female | 859 (44.3%) | $48,981 |
| Total | 1,939 (100.0%) | $55,906 |
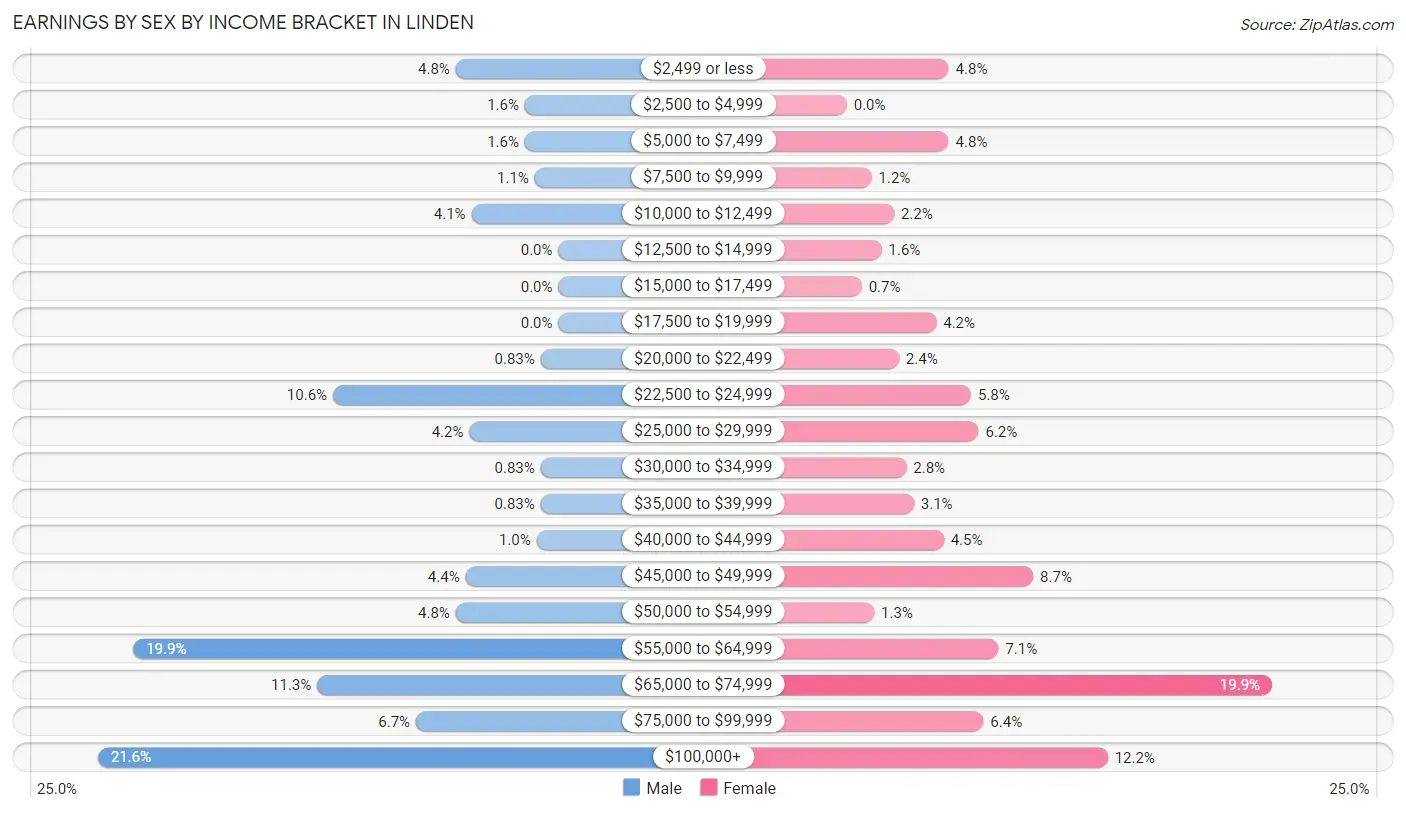
Earnings by Sex by Income Bracket in Linden
The most common earnings brackets in Linden are $100,000+ for men (233 | 21.6%) and $65,000 to $74,999 for women (171 | 19.9%).
| Income | Male | Female |
| $2,499 or less | 52 (4.8%) | 41 (4.8%) |
| $2,500 to $4,999 | 17 (1.6%) | 0 (0.0%) |
| $5,000 to $7,499 | 17 (1.6%) | 41 (4.8%) |
| $7,500 to $9,999 | 12 (1.1%) | 10 (1.2%) |
| $10,000 to $12,499 | 44 (4.1%) | 19 (2.2%) |
| $12,500 to $14,999 | 0 (0.0%) | 14 (1.6%) |
| $15,000 to $17,499 | 0 (0.0%) | 6 (0.7%) |
| $17,500 to $19,999 | 0 (0.0%) | 36 (4.2%) |
| $20,000 to $22,499 | 9 (0.8%) | 21 (2.4%) |
| $22,500 to $24,999 | 114 (10.6%) | 50 (5.8%) |
| $25,000 to $29,999 | 45 (4.2%) | 53 (6.2%) |
| $30,000 to $34,999 | 9 (0.8%) | 24 (2.8%) |
| $35,000 to $39,999 | 9 (0.8%) | 27 (3.1%) |
| $40,000 to $44,999 | 11 (1.0%) | 39 (4.5%) |
| $45,000 to $49,999 | 47 (4.3%) | 75 (8.7%) |
| $50,000 to $54,999 | 52 (4.8%) | 11 (1.3%) |
| $55,000 to $64,999 | 215 (19.9%) | 61 (7.1%) |
| $65,000 to $74,999 | 122 (11.3%) | 171 (19.9%) |
| $75,000 to $99,999 | 72 (6.7%) | 55 (6.4%) |
| $100,000+ | 233 (21.6%) | 105 (12.2%) |
| Total | 1,080 (100.0%) | 859 (100.0%) |
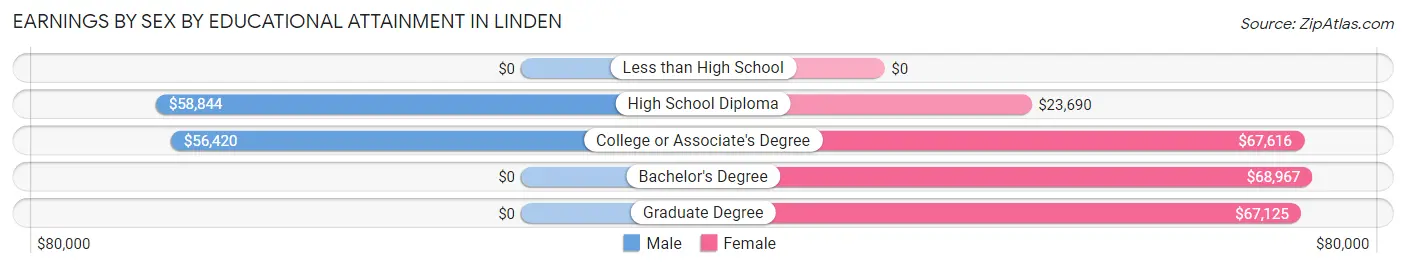
Earnings by Sex by Educational Attainment in Linden
Average earnings in Linden are $59,955 for men and $55,926 for women, a difference of 6.7%. Men with an educational attainment of high school diploma enjoy the highest average annual earnings of $58,844, while those with college or associate's degree education earn the least with $56,420. Women with an educational attainment of bachelor's degree earn the most with the average annual earnings of $68,967, while those with high school diploma education have the smallest earnings of $23,690.
| Educational Attainment | Male Income | Female Income |
| Less than High School | - | - |
| High School Diploma | $58,844 | $23,690 |
| College or Associate's Degree | $56,420 | $67,616 |
| Bachelor's Degree | - | - |
| Graduate Degree | - | - |
| Total | $59,955 | $55,926 |
Family Income in Linden
Family Income Brackets in Linden
According to the Linden family income data, there are 313 families falling into the $50,000 to $74,999 income range, which is the most common income bracket and makes up 32.3% of all families.
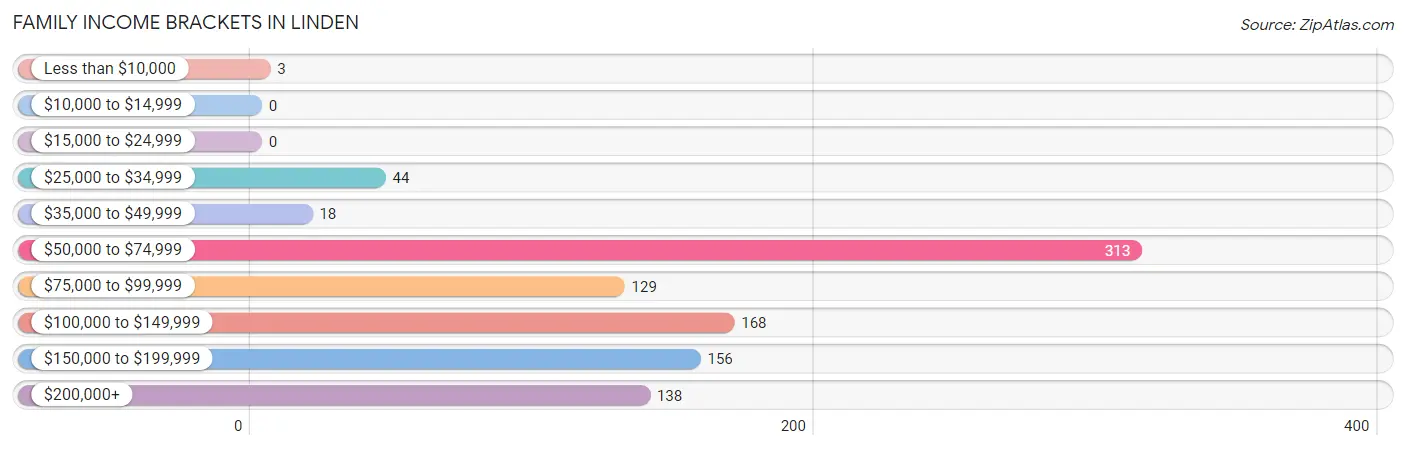
| Income Bracket | # Families | % Families |
| Less than $10,000 | 3 | 0.3% |
| $10,000 to $14,999 | 0 | 0.0% |
| $15,000 to $24,999 | 0 | 0.0% |
| $25,000 to $34,999 | 44 | 4.5% |
| $35,000 to $49,999 | 18 | 1.9% |
| $50,000 to $74,999 | 313 | 32.3% |
| $75,000 to $99,999 | 129 | 13.3% |
| $100,000 to $149,999 | 168 | 17.3% |
| $150,000 to $199,999 | 156 | 16.1% |
| $200,000+ | 138 | 14.2% |
Family Income by Famaliy Size in Linden
5-person families (49 | 5.1%) account for the highest median family income in Linden with $168,661 per family, while 2-person families (421 | 43.4%) have the highest median income of $42,266 per family member.
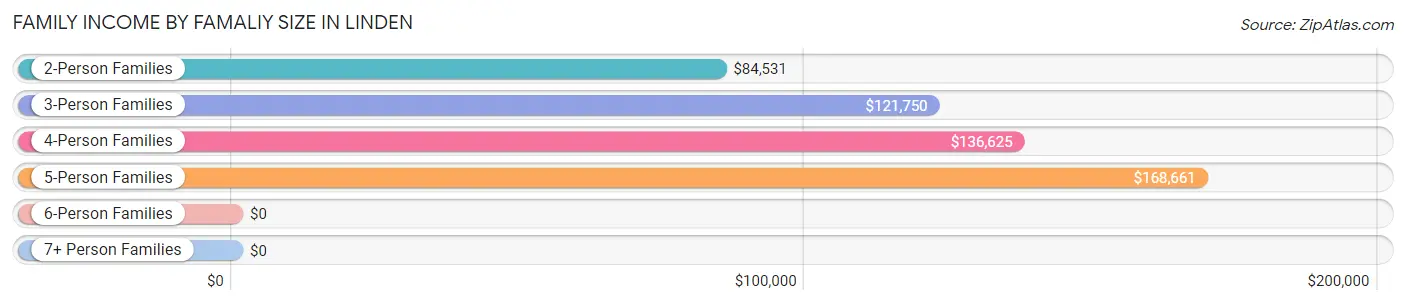
| Income Bracket | # Families | Median Income |
| 2-Person Families | 421 (43.4%) | $84,531 |
| 3-Person Families | 163 (16.8%) | $121,750 |
| 4-Person Families | 329 (34.0%) | $136,625 |
| 5-Person Families | 49 (5.1%) | $168,661 |
| 6-Person Families | 7 (0.7%) | $0 |
| 7+ Person Families | 0 (0.0%) | $0 |
| Total | 969 (100.0%) | $97,554 |
Family Income by Number of Earners in Linden
The median family income in Linden is $97,554, with families comprising 3+ earners (162) having the highest median family income of $158,646, while families with 1 earner (378) have the lowest median family income of $67,772, accounting for 16.7% and 39.0% of families, respectively.
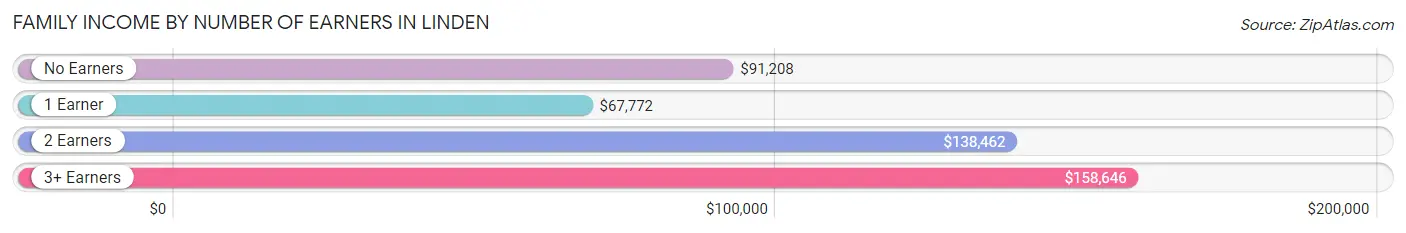
| Number of Earners | # Families | Median Income |
| No Earners | 131 (13.5%) | $91,208 |
| 1 Earner | 378 (39.0%) | $67,772 |
| 2 Earners | 298 (30.7%) | $138,462 |
| 3+ Earners | 162 (16.7%) | $158,646 |
| Total | 969 (100.0%) | $97,554 |
Household Income in Linden
Household Income Brackets in Linden
With 347 households falling in the category, the $50,000 to $74,999 income range is the most frequent in Linden, accounting for 23.1% of all households. In contrast, only 29 households (1.9%) fall into the $15,000 to $24,999 income bracket, making it the least populous group.
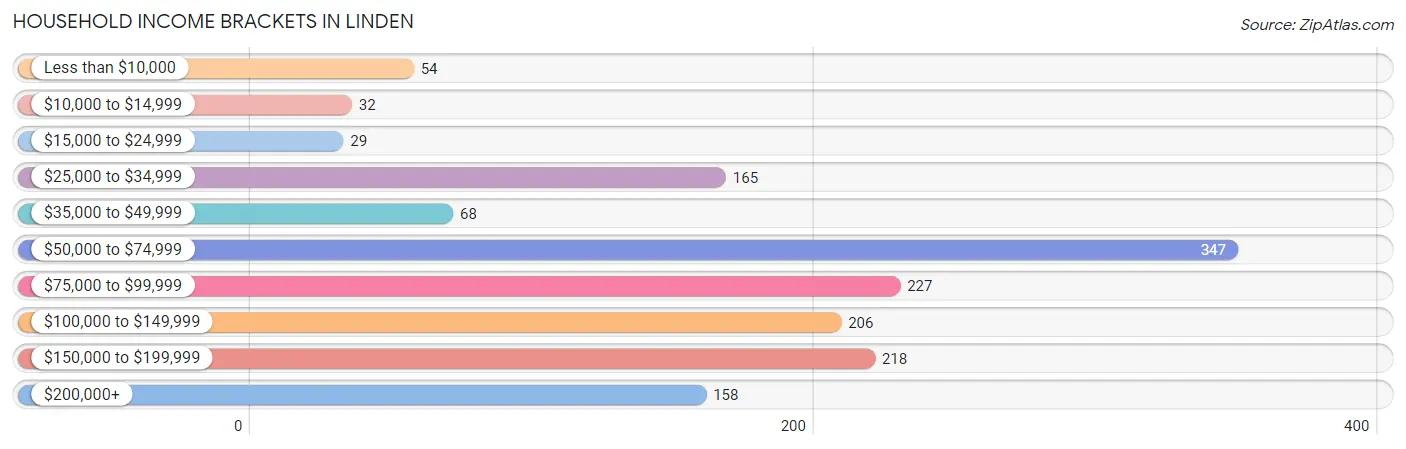
| Income Bracket | # Households | % Households |
| Less than $10,000 | 54 | 3.6% |
| $10,000 to $14,999 | 32 | 2.1% |
| $15,000 to $24,999 | 29 | 1.9% |
| $25,000 to $34,999 | 165 | 11.0% |
| $35,000 to $49,999 | 68 | 4.5% |
| $50,000 to $74,999 | 347 | 23.1% |
| $75,000 to $99,999 | 227 | 15.1% |
| $100,000 to $149,999 | 206 | 13.7% |
| $150,000 to $199,999 | 218 | 14.5% |
| $200,000+ | 158 | 10.5% |
Household Income by Householder Age in Linden
The median household income in Linden is $85,917, with the highest median household income of $151,176 found in the 45 to 64 years age bracket for the primary householder. A total of 526 households (35.0%) fall into this category. Meanwhile, the 15 to 24 years age bracket for the primary householder has the lowest median household income of $0, with 8 households (0.5%) in this group.
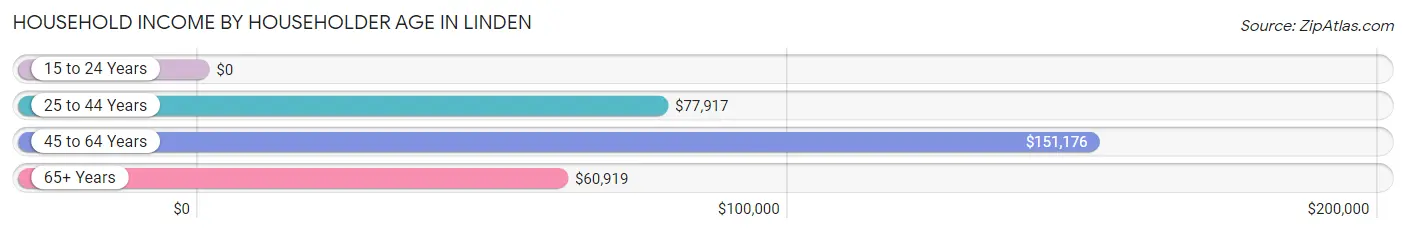
| Income Bracket | # Households | Median Income |
| 15 to 24 Years | 8 (0.5%) | $0 |
| 25 to 44 Years | 416 (27.7%) | $77,917 |
| 45 to 64 Years | 526 (35.0%) | $151,176 |
| 65+ Years | 551 (36.7%) | $60,919 |
| Total | 1,501 (100.0%) | $85,917 |
Poverty in Linden
Income Below Poverty by Sex and Age in Linden
With 4.3% poverty level for males and 4.8% for females among the residents of Linden, 16 and 17 year old males and 55 to 64 year old females are the most vulnerable to poverty, with 26 males (21.5%) and 32 females (21.0%) in their respective age groups living below the poverty level.
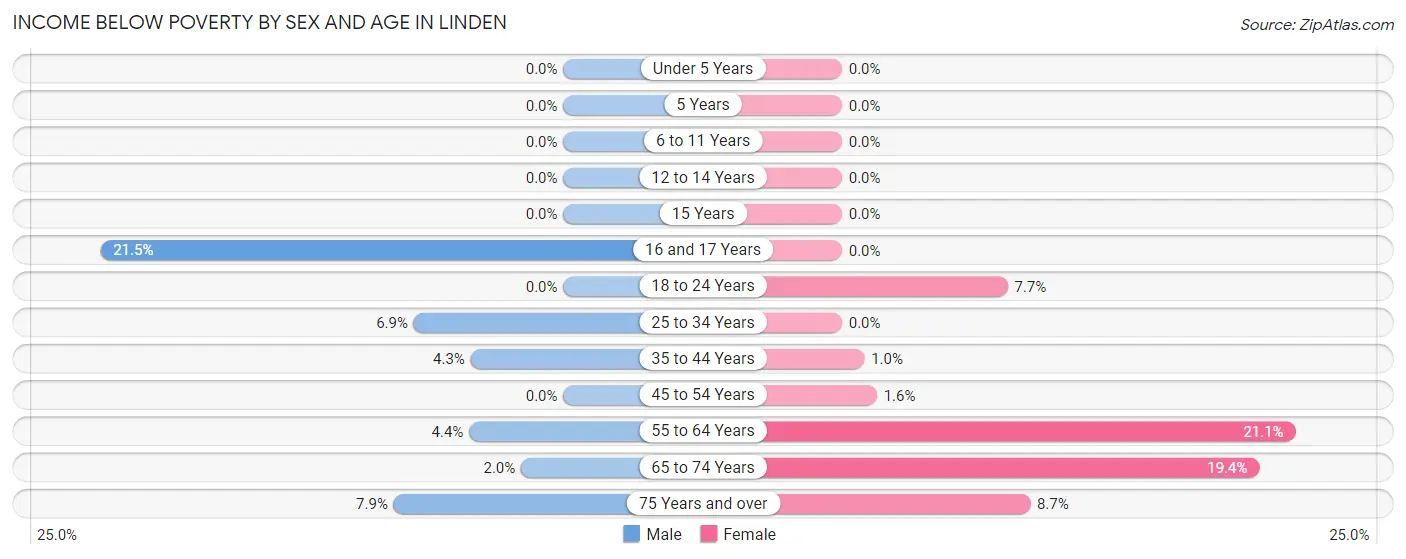
| Age Bracket | Male | Female |
| Under 5 Years | 0 (0.0%) | 0 (0.0%) |
| 5 Years | 0 (0.0%) | 0 (0.0%) |
| 6 to 11 Years | 0 (0.0%) | 0 (0.0%) |
| 12 to 14 Years | 0 (0.0%) | 0 (0.0%) |
| 15 Years | 0 (0.0%) | 0 (0.0%) |
| 16 and 17 Years | 26 (21.5%) | 0 (0.0%) |
| 18 to 24 Years | 0 (0.0%) | 8 (7.7%) |
| 25 to 34 Years | 15 (6.9%) | 0 (0.0%) |
| 35 to 44 Years | 8 (4.3%) | 2 (1.0%) |
| 45 to 54 Years | 0 (0.0%) | 7 (1.6%) |
| 55 to 64 Years | 8 (4.4%) | 32 (21.0%) |
| 65 to 74 Years | 3 (2.0%) | 43 (19.4%) |
| 75 Years and over | 14 (7.9%) | 20 (8.7%) |
| Total | 74 (4.3%) | 112 (4.8%) |
Income Above Poverty by Sex and Age in Linden
According to the poverty statistics in Linden, males aged under 5 years and females aged under 5 years are the age groups that are most secure financially, with 100.0% of males and 100.0% of females in these age groups living above the poverty line.
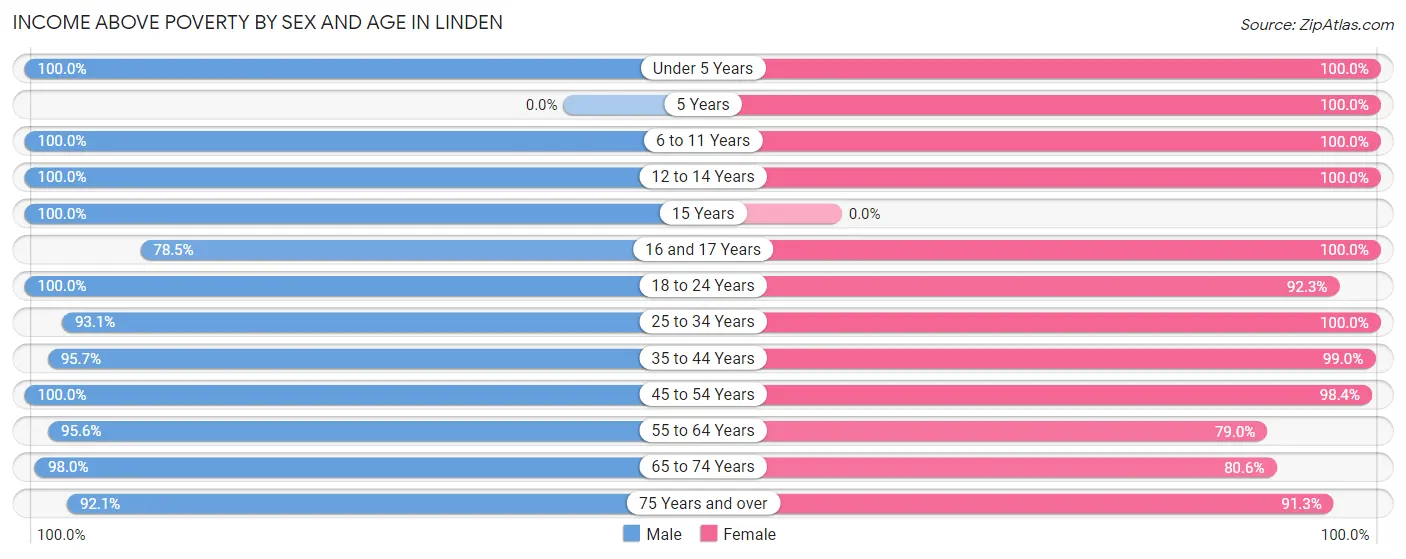
| Age Bracket | Male | Female |
| Under 5 Years | 5 (100.0%) | 267 (100.0%) |
| 5 Years | 0 (0.0%) | 16 (100.0%) |
| 6 to 11 Years | 62 (100.0%) | 302 (100.0%) |
| 12 to 14 Years | 76 (100.0%) | 48 (100.0%) |
| 15 Years | 67 (100.0%) | 0 (0.0%) |
| 16 and 17 Years | 95 (78.5%) | 71 (100.0%) |
| 18 to 24 Years | 184 (100.0%) | 96 (92.3%) |
| 25 to 34 Years | 201 (93.1%) | 299 (100.0%) |
| 35 to 44 Years | 178 (95.7%) | 190 (99.0%) |
| 45 to 54 Years | 296 (100.0%) | 425 (98.4%) |
| 55 to 64 Years | 175 (95.6%) | 120 (78.9%) |
| 65 to 74 Years | 150 (98.0%) | 179 (80.6%) |
| 75 Years and over | 164 (92.1%) | 209 (91.3%) |
| Total | 1,653 (95.7%) | 2,222 (95.2%) |
Income Below Poverty Among Married-Couple Families in Linden
The poverty statistics for married-couple families in Linden show that 0.4% or 3 of the total 769 families live below the poverty line. Families with no children have the highest poverty rate of 0.9%, comprising of 3 families. On the other hand, families with 1 or 2 children have the lowest poverty rate of 0.0%, which includes 0 families.
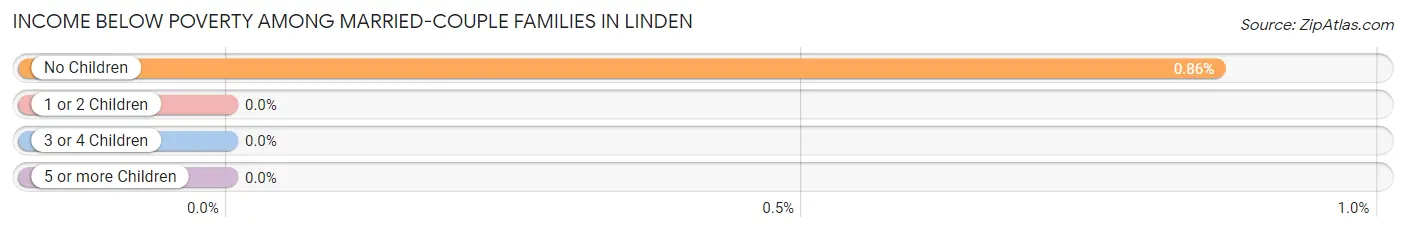
| Children | Above Poverty | Below Poverty |
| No Children | 347 (99.1%) | 3 (0.9%) |
| 1 or 2 Children | 374 (100.0%) | 0 (0.0%) |
| 3 or 4 Children | 45 (100.0%) | 0 (0.0%) |
| 5 or more Children | 0 (0.0%) | 0 (0.0%) |
| Total | 766 (99.6%) | 3 (0.4%) |
Income Below Poverty Among Single-Parent Households in Linden
| Children | Single Father | Single Mother |
| No Children | 0 (0.0%) | 0 (0.0%) |
| 1 or 2 Children | 0 (0.0%) | 0 (0.0%) |
| 3 or 4 Children | 0 (0.0%) | 0 (0.0%) |
| 5 or more Children | 0 (0.0%) | 0 (0.0%) |
| Total | 0 (0.0%) | 0 (0.0%) |
Income Below Poverty Among Married-Couple vs Single-Parent Households in Linden
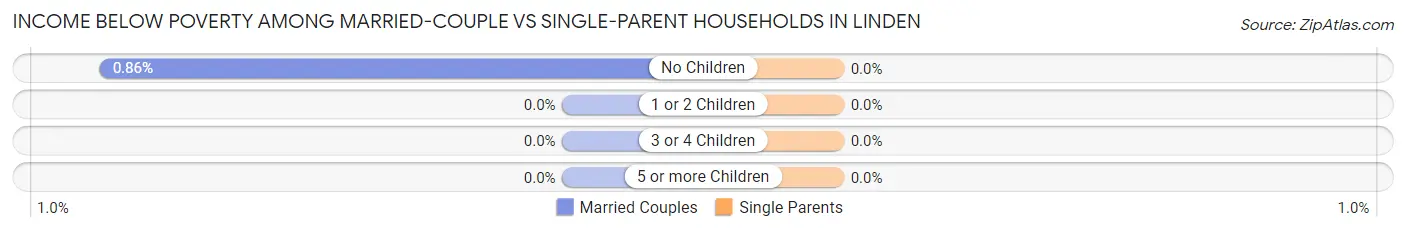
| Children | Married-Couple Families | Single-Parent Households |
| No Children | 3 (0.9%) | 0 (0.0%) |
| 1 or 2 Children | 0 (0.0%) | 0 (0.0%) |
| 3 or 4 Children | 0 (0.0%) | 0 (0.0%) |
| 5 or more Children | 0 (0.0%) | 0 (0.0%) |
| Total | 3 (0.4%) | 0 (0.0%) |
Race in Linden
The most populous races in Linden are White / Caucasian (3,984 | 96.6%), Black / African American (62 | 1.5%), and Hispanic or Latino (53 | 1.3%).
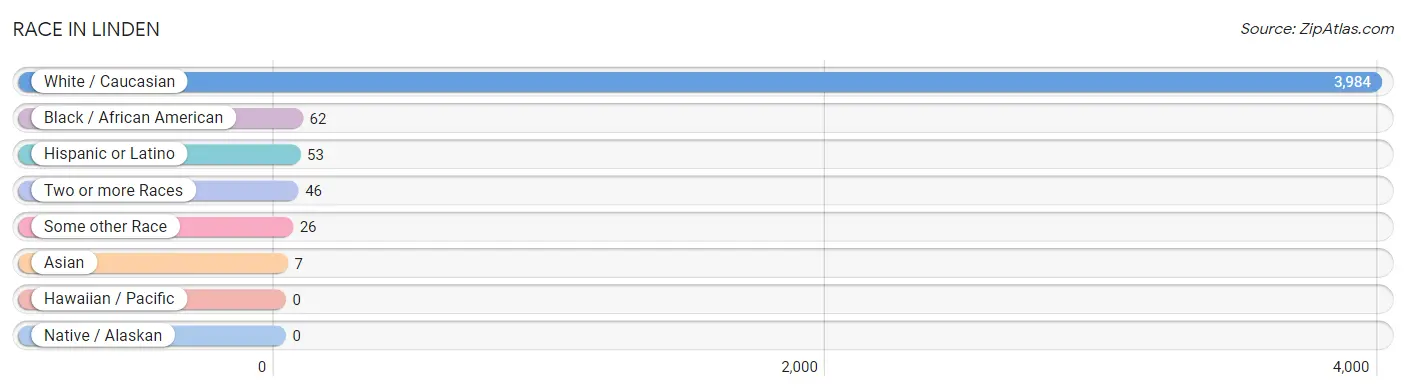
| Race | # Population | % Population |
| Asian | 7 | 0.2% |
| Black / African American | 62 | 1.5% |
| Hawaiian / Pacific | 0 | 0.0% |
| Hispanic or Latino | 53 | 1.3% |
| Native / Alaskan | 0 | 0.0% |
| White / Caucasian | 3,984 | 96.6% |
| Two or more Races | 46 | 1.1% |
| Some other Race | 26 | 0.6% |
| Total | 4,125 | 100.0% |
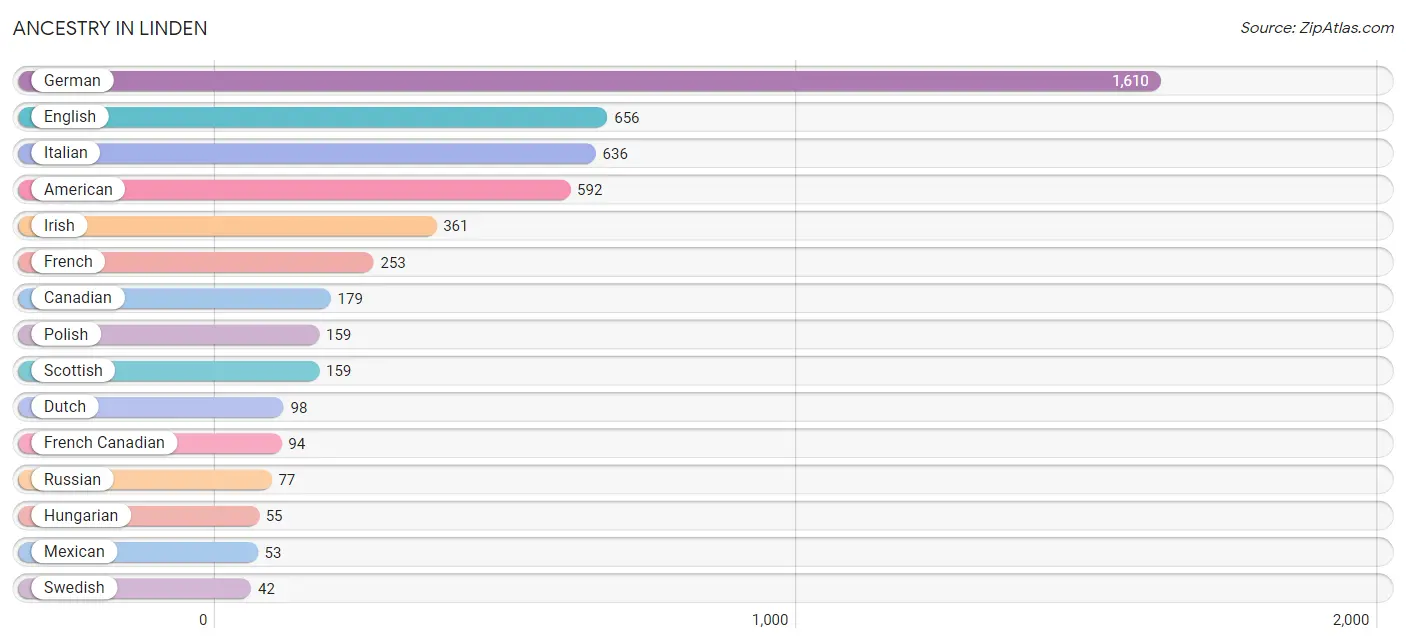
Ancestry in Linden
The most populous ancestries reported in Linden are German (1,610 | 39.0%), English (656 | 15.9%), Italian (636 | 15.4%), American (592 | 14.3%), and Irish (361 | 8.7%), together accounting for 93.4% of all Linden residents.
| Ancestry | # Population | % Population |
| American | 592 | 14.3% |
| Arab | 37 | 0.9% |
| Austrian | 8 | 0.2% |
| Belgian | 20 | 0.5% |
| British | 23 | 0.6% |
| Canadian | 179 | 4.3% |
| Cherokee | 19 | 0.5% |
| Czech | 9 | 0.2% |
| Czechoslovakian | 15 | 0.4% |
| Danish | 10 | 0.2% |
| Dutch | 98 | 2.4% |
| Eastern European | 16 | 0.4% |
| English | 656 | 15.9% |
| French | 253 | 6.1% |
| French Canadian | 94 | 2.3% |
| German | 1,610 | 39.0% |
| Greek | 8 | 0.2% |
| Hungarian | 55 | 1.3% |
| Iraqi | 10 | 0.2% |
| Irish | 361 | 8.7% |
| Italian | 636 | 15.4% |
| Korean | 7 | 0.2% |
| Lebanese | 18 | 0.4% |
| Lithuanian | 9 | 0.2% |
| Maltese | 27 | 0.6% |
| Mexican | 53 | 1.3% |
| Norwegian | 25 | 0.6% |
| Palestinian | 9 | 0.2% |
| Pennsylvania German | 5 | 0.1% |
| Polish | 159 | 3.8% |
| Portuguese | 9 | 0.2% |
| Romanian | 21 | 0.5% |
| Russian | 77 | 1.9% |
| Scotch-Irish | 10 | 0.2% |
| Scottish | 159 | 3.8% |
| Swedish | 42 | 1.0% |
| Ukrainian | 27 | 0.6% |
| Welsh | 15 | 0.4% |
| Yugoslavian | 8 | 0.2% | View All 39 Rows |
Immigrants in Linden
The most numerous immigrant groups reported in Linden came from Canada (16 | 0.4%), Belgium (9 | 0.2%), Europe (9 | 0.2%), Western Europe (9 | 0.2%), and Asia (7 | 0.2%), together accounting for 1.2% of all Linden residents.
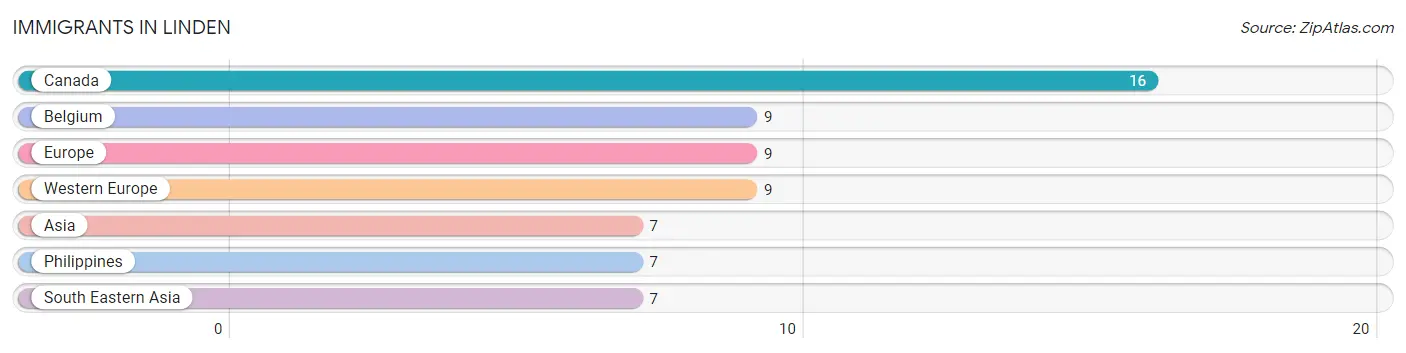
| Immigration Origin | # Population | % Population |
| Asia | 7 | 0.2% |
| Belgium | 9 | 0.2% |
| Canada | 16 | 0.4% |
| Europe | 9 | 0.2% |
| Philippines | 7 | 0.2% |
| South Eastern Asia | 7 | 0.2% |
| Western Europe | 9 | 0.2% | View All 7 Rows |
Sex and Age in Linden
Sex and Age in Linden
The most populous age groups in Linden are 15 to 19 Years (206 | 11.7%) for men and 5 to 9 Years (296 | 12.5%) for women.
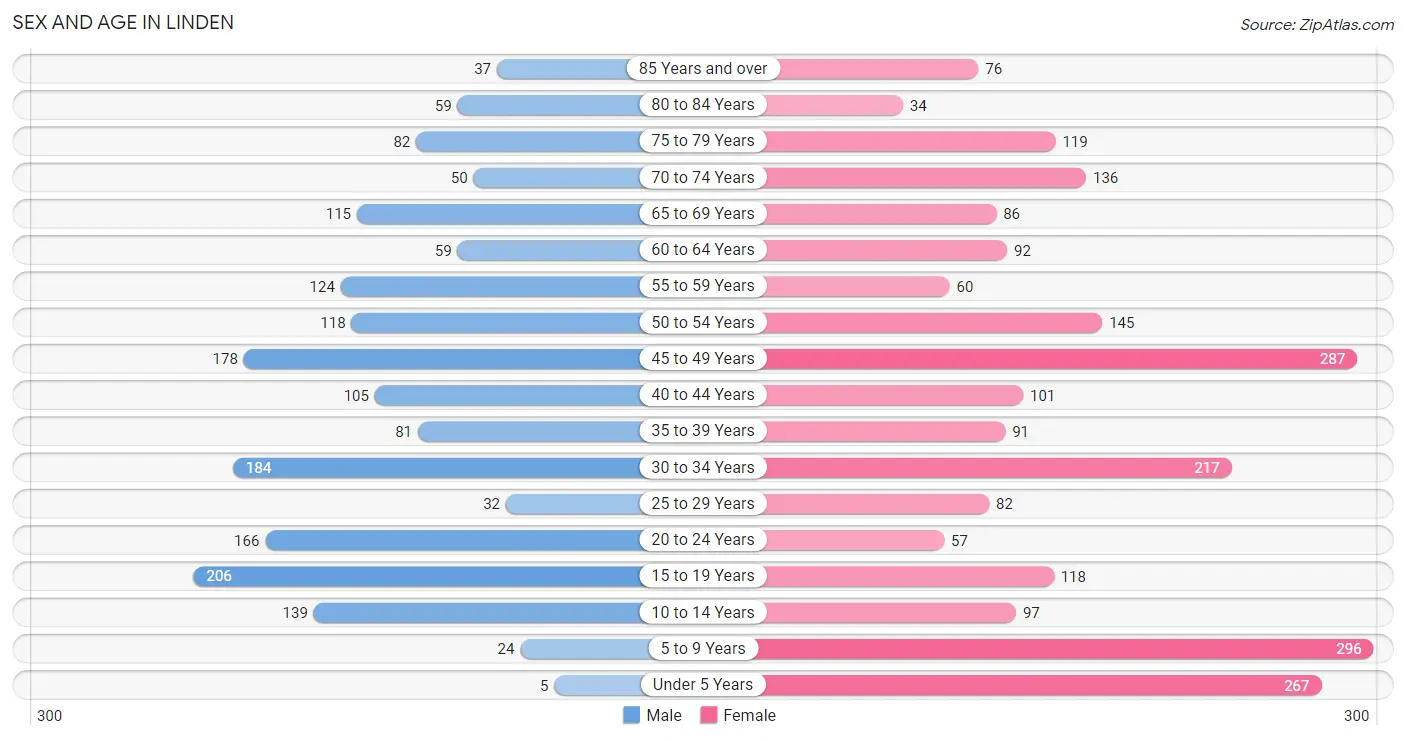
| Age Bracket | Male | Female |
| Under 5 Years | 5 (0.3%) | 267 (11.3%) |
| 5 to 9 Years | 24 (1.4%) | 296 (12.5%) |
| 10 to 14 Years | 139 (7.9%) | 97 (4.1%) |
| 15 to 19 Years | 206 (11.7%) | 118 (5.0%) |
| 20 to 24 Years | 166 (9.4%) | 57 (2.4%) |
| 25 to 29 Years | 32 (1.8%) | 82 (3.5%) |
| 30 to 34 Years | 184 (10.4%) | 217 (9.2%) |
| 35 to 39 Years | 81 (4.6%) | 91 (3.8%) |
| 40 to 44 Years | 105 (5.9%) | 101 (4.3%) |
| 45 to 49 Years | 178 (10.1%) | 287 (12.2%) |
| 50 to 54 Years | 118 (6.7%) | 145 (6.1%) |
| 55 to 59 Years | 124 (7.0%) | 60 (2.5%) |
| 60 to 64 Years | 59 (3.3%) | 92 (3.9%) |
| 65 to 69 Years | 115 (6.5%) | 86 (3.6%) |
| 70 to 74 Years | 50 (2.8%) | 136 (5.8%) |
| 75 to 79 Years | 82 (4.6%) | 119 (5.0%) |
| 80 to 84 Years | 59 (3.3%) | 34 (1.4%) |
| 85 Years and over | 37 (2.1%) | 76 (3.2%) |
| Total | 1,764 (100.0%) | 2,361 (100.0%) |
Families and Households in Linden
Median Family Size in Linden
The median family size in Linden is 3.33 persons per family, with married-couple families (769 | 79.4%) accounting for the largest median family size of 3.57 persons per family. On the other hand, single male/father families (99 | 10.2%) represent the smallest median family size with 2.39 persons per family.
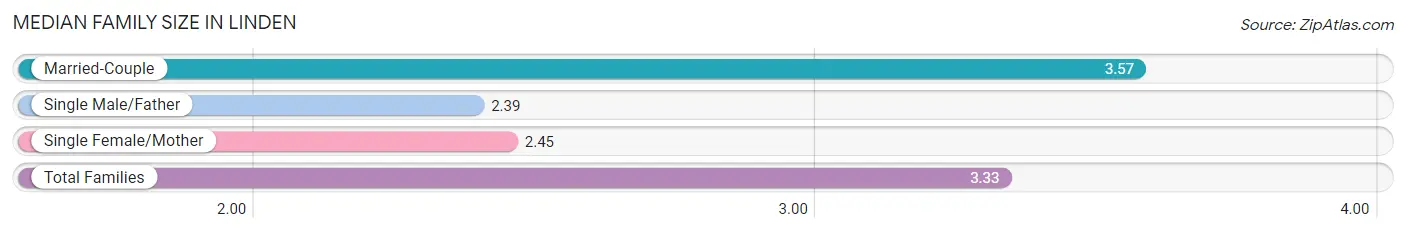
| Family Type | # Families | Family Size |
| Married-Couple | 769 (79.4%) | 3.57 |
| Single Male/Father | 99 (10.2%) | 2.39 |
| Single Female/Mother | 101 (10.4%) | 2.45 |
| Total Families | 969 (100.0%) | 3.33 |
Median Household Size in Linden
The median household size in Linden is 2.69 persons per household, with single male/father households (99 | 6.6%) accounting for the largest median household size of 3.71 persons per household. non-family households (532 | 35.4%) represent the smallest median household size with 1.20 persons per household.
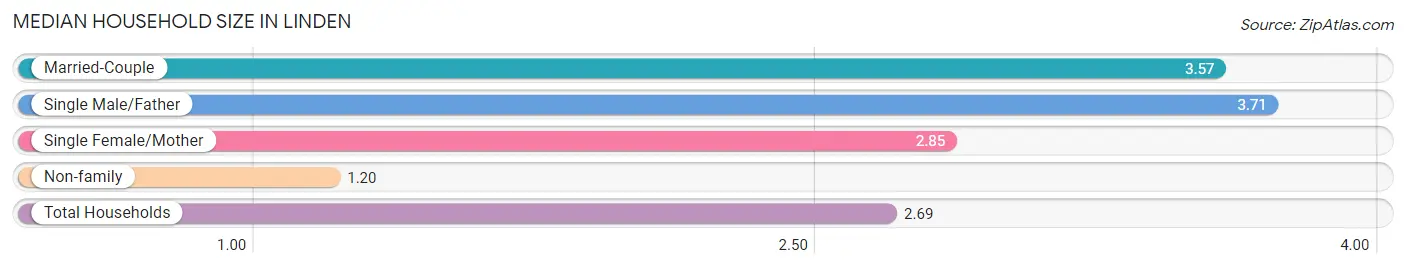
| Household Type | # Households | Household Size |
| Married-Couple | 769 (51.2%) | 3.57 |
| Single Male/Father | 99 (6.6%) | 3.71 |
| Single Female/Mother | 101 (6.7%) | 2.85 |
| Non-family | 532 (35.4%) | 1.20 |
| Total Households | 1,501 (100.0%) | 2.69 |
Household Size by Marriage Status in Linden
Out of a total of 1,501 households in Linden, 969 (64.6%) are family households, while 532 (35.4%) are nonfamily households. The most numerous type of family households are 2-person households, comprising 366, and the most common type of nonfamily households are 1-person households, comprising 450.
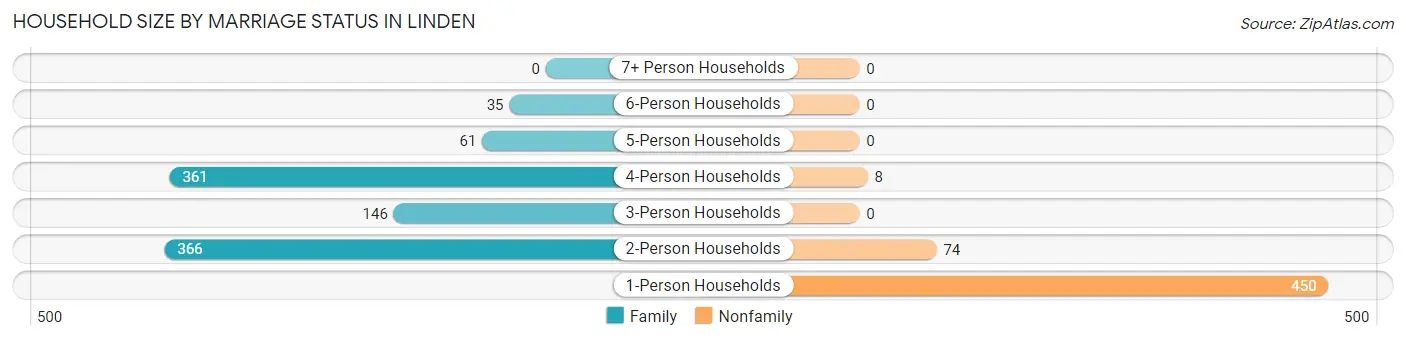
| Household Size | Family Households | Nonfamily Households |
| 1-Person Households | - | 450 (30.0%) |
| 2-Person Households | 366 (24.4%) | 74 (4.9%) |
| 3-Person Households | 146 (9.7%) | 0 (0.0%) |
| 4-Person Households | 361 (24.0%) | 8 (0.5%) |
| 5-Person Households | 61 (4.1%) | 0 (0.0%) |
| 6-Person Households | 35 (2.3%) | 0 (0.0%) |
| 7+ Person Households | 0 (0.0%) | 0 (0.0%) |
| Total | 969 (64.6%) | 532 (35.4%) |
Female Fertility in Linden
Fertility by Age in Linden
Average fertility rate in Linden is 16.0 births per 1,000 women. Women in the age bracket of 20 to 34 years have the highest fertility rate with 22.0 births per 1,000 women. Women in the age bracket of 20 to 34 years acount for 50.0% of all women with births.
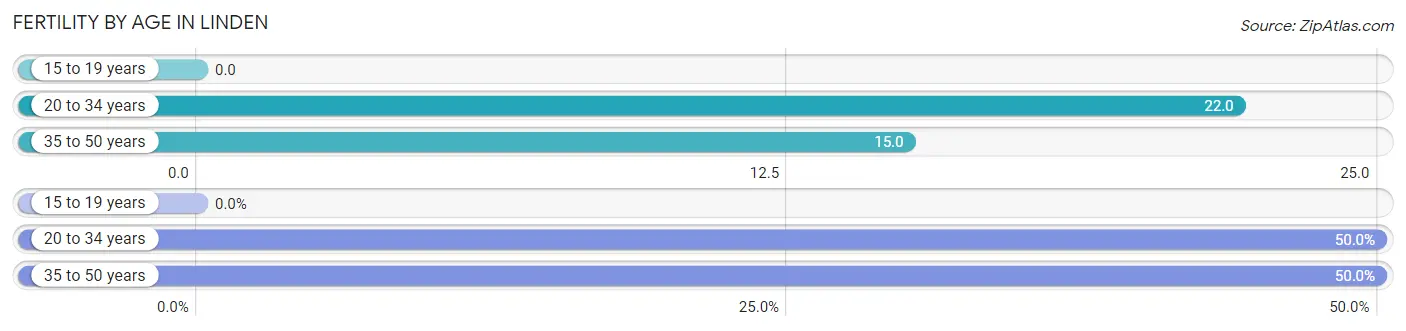
| Age Bracket | Women with Births | Births / 1,000 Women |
| 15 to 19 years | 0 (0.0%) | 0.0 |
| 20 to 34 years | 8 (50.0%) | 22.0 |
| 35 to 50 years | 8 (50.0%) | 15.0 |
| Total | 16 (100.0%) | 16.0 |
Fertility by Age by Marriage Status in Linden
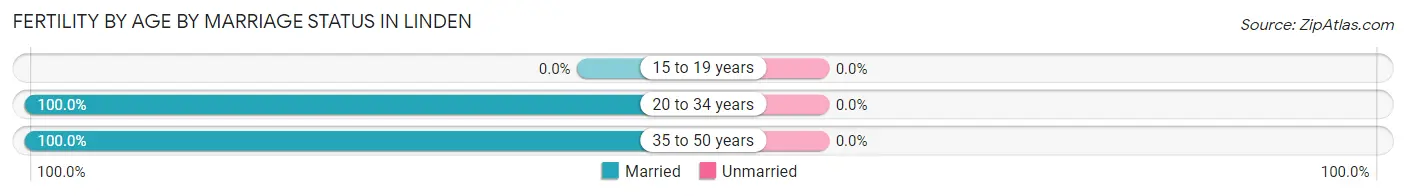
| Age Bracket | Married | Unmarried |
| 15 to 19 years | 0 (0.0%) | 0 (0.0%) |
| 20 to 34 years | 8 (100.0%) | 0 (0.0%) |
| 35 to 50 years | 8 (100.0%) | 0 (0.0%) |
| Total | 16 (100.0%) | 0 (0.0%) |
Fertility by Education in Linden
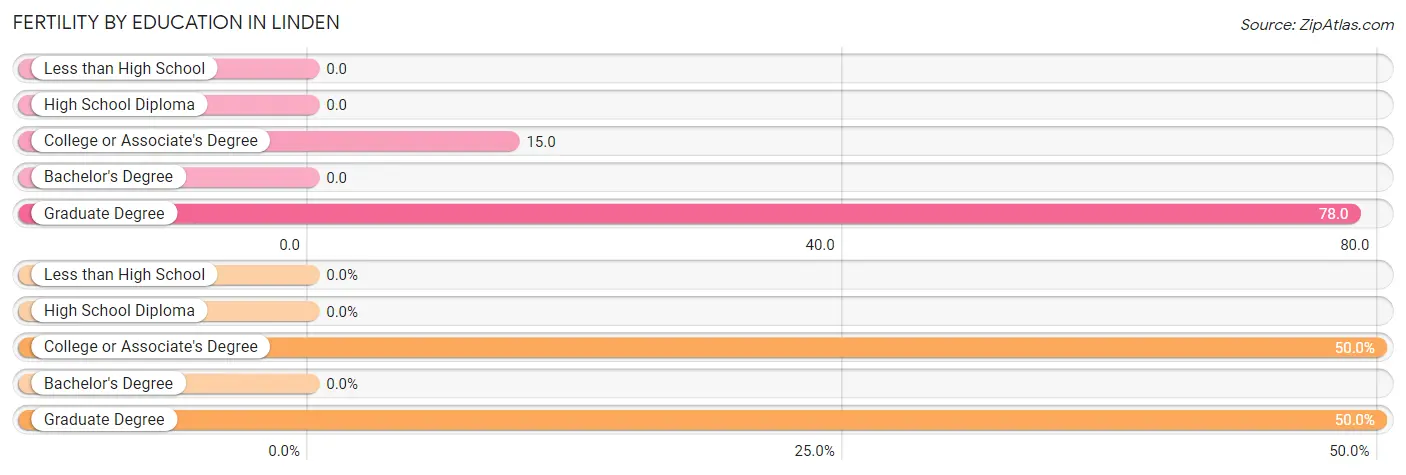
| Educational Attainment | Women with Births | Births / 1,000 Women |
| Less than High School | 0 (0.0%) | 0.0 |
| High School Diploma | 0 (0.0%) | 0.0 |
| College or Associate's Degree | 8 (50.0%) | 15.0 |
| Bachelor's Degree | 0 (0.0%) | 0.0 |
| Graduate Degree | 8 (50.0%) | 78.0 |
| Total | 16 (100.0%) | 16.0 |
Fertility by Education by Marriage Status in Linden
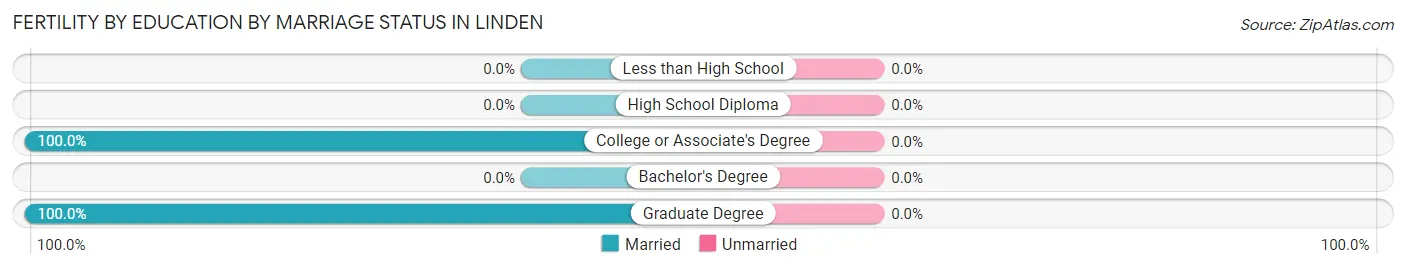
| Educational Attainment | Married | Unmarried |
| Less than High School | 0 (0.0%) | 0 (0.0%) |
| High School Diploma | 0 (0.0%) | 0 (0.0%) |
| College or Associate's Degree | 8 (100.0%) | 0 (0.0%) |
| Bachelor's Degree | 0 (0.0%) | 0 (0.0%) |
| Graduate Degree | 8 (100.0%) | 0 (0.0%) |
| Total | 16 (100.0%) | 0 (0.0%) |
Employment Characteristics in Linden
Employment by Class of Employer in Linden
Among the 1,660 employed individuals in Linden, private company employees (954 | 57.5%), not-for-profit organizations (377 | 22.7%), and local government employees (112 | 6.8%) make up the most common classes of employment.
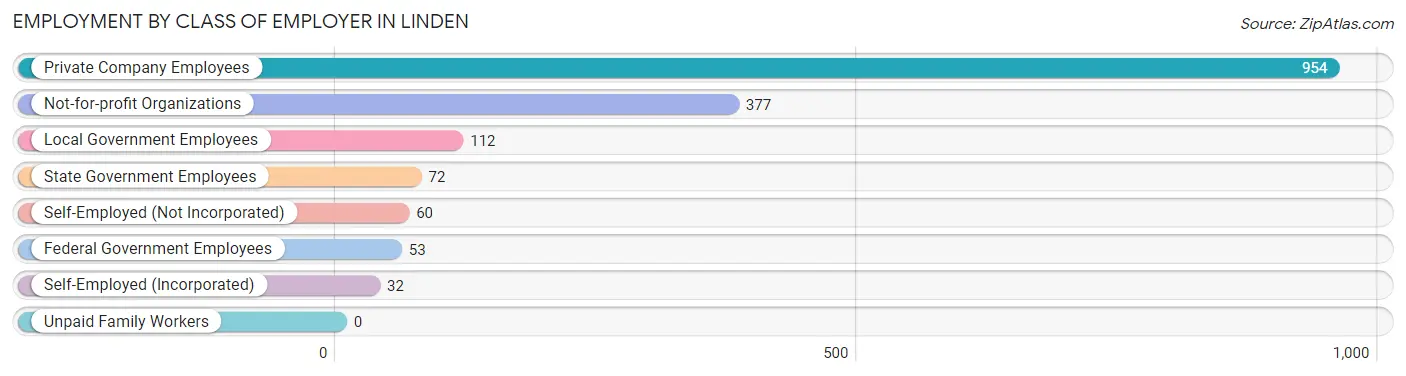
| Employer Class | # Employees | % Employees |
| Private Company Employees | 954 | 57.5% |
| Self-Employed (Incorporated) | 32 | 1.9% |
| Self-Employed (Not Incorporated) | 60 | 3.6% |
| Not-for-profit Organizations | 377 | 22.7% |
| Local Government Employees | 112 | 6.8% |
| State Government Employees | 72 | 4.3% |
| Federal Government Employees | 53 | 3.2% |
| Unpaid Family Workers | 0 | 0.0% |
| Total | 1,660 | 100.0% |
Employment Status by Age in Linden
According to the labor force statistics for Linden, out of the total population over 16 years of age (3,230), 57.6% or 1,860 individuals are in the labor force, with 9.7% or 180 of them unemployed. The age group with the highest labor force participation rate is 35 to 44 years, with 97.1% or 367 individuals in the labor force. Within the labor force, the 30 to 34 years age range has the highest percentage of unemployed individuals, with 60.6% or 126 of them being unemployed.
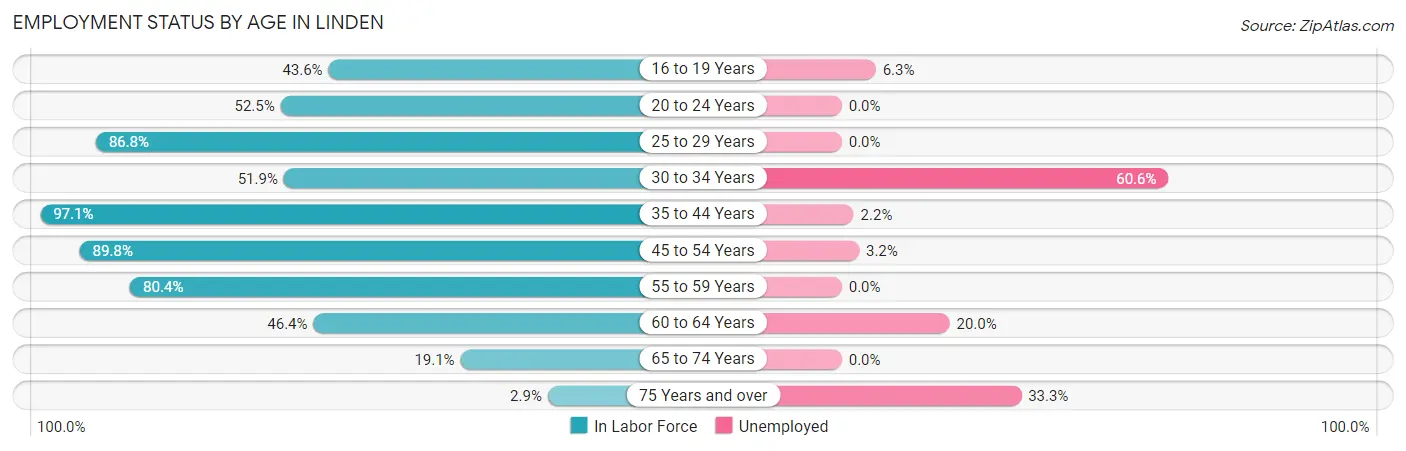
| Age Bracket | In Labor Force | Unemployed |
| 16 to 19 Years | 112 (43.6%) | 7 (6.3%) |
| 20 to 24 Years | 117 (52.5%) | 0 (0.0%) |
| 25 to 29 Years | 99 (86.8%) | 0 (0.0%) |
| 30 to 34 Years | 208 (51.9%) | 126 (60.6%) |
| 35 to 44 Years | 367 (97.1%) | 8 (2.2%) |
| 45 to 54 Years | 654 (89.8%) | 21 (3.2%) |
| 55 to 59 Years | 148 (80.4%) | 0 (0.0%) |
| 60 to 64 Years | 70 (46.4%) | 14 (20.0%) |
| 65 to 74 Years | 74 (19.1%) | 0 (0.0%) |
| 75 Years and over | 12 (2.9%) | 4 (33.3%) |
| Total | 1,860 (57.6%) | 180 (9.7%) |
Employment Status by Educational Attainment in Linden
According to labor force statistics for Linden, 79.0% of individuals (1,545) out of the total population between 25 and 64 years of age (1,956) are in the labor force, with 10.9% or 168 of them being unemployed. The group with the highest labor force participation rate are those with the educational attainment of bachelor's degree or higher, with 91.8% or 558 individuals in the labor force. Within the labor force, individuals with college / associate degree education have the highest percentage of unemployment, with 19.1% or 125 of them being unemployed.
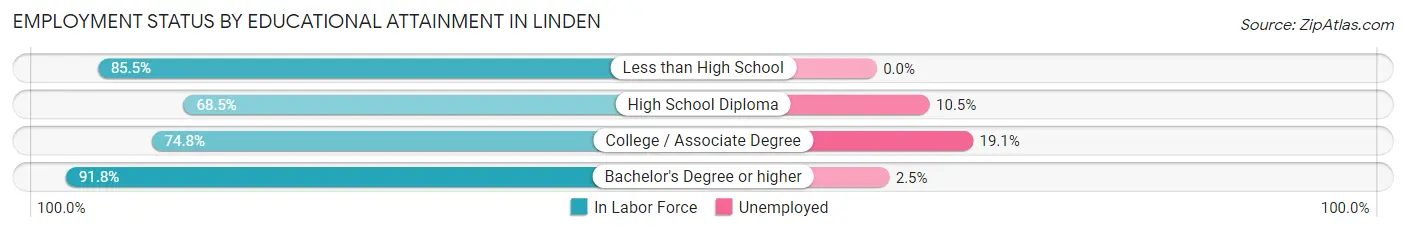
| Educational Attainment | In Labor Force | Unemployed |
| Less than High School | 47 (85.5%) | 0 (0.0%) |
| High School Diploma | 287 (68.5%) | 44 (10.5%) |
| College / Associate Degree | 654 (74.8%) | 167 (19.1%) |
| Bachelor's Degree or higher | 558 (91.8%) | 15 (2.5%) |
| Total | 1,545 (79.0%) | 213 (10.9%) |
Employment Occupations by Sex in Linden
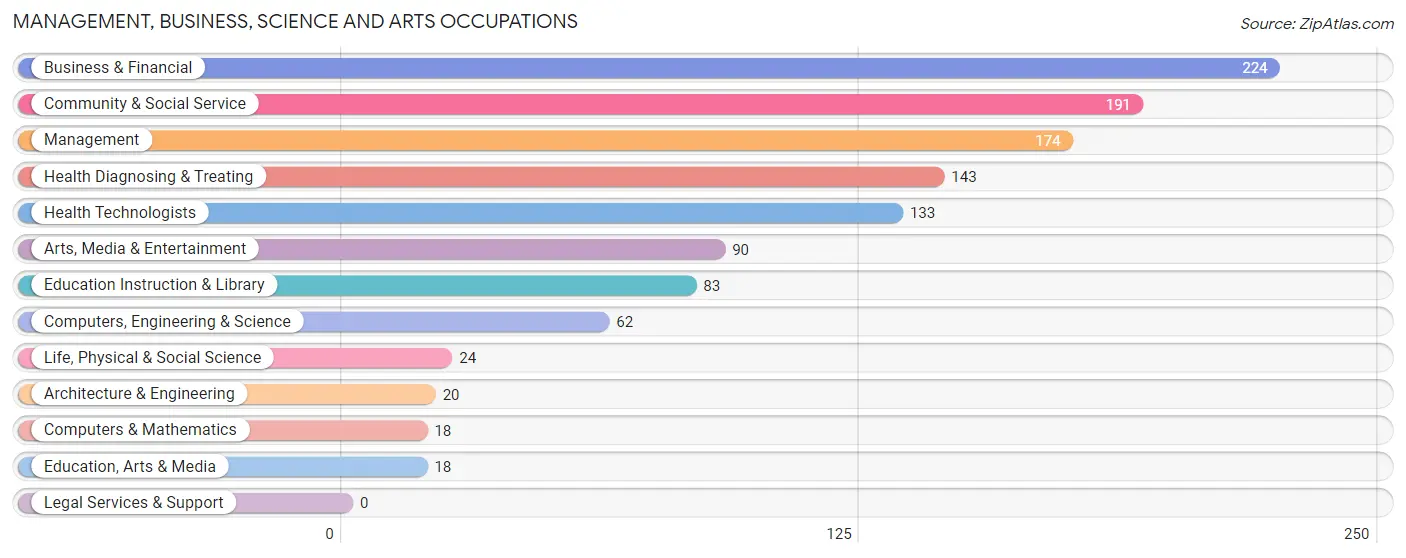
Management, Business, Science and Arts Occupations
The most common Management, Business, Science and Arts occupations in Linden are Business & Financial (224 | 13.3%), Community & Social Service (191 | 11.4%), Management (174 | 10.3%), Health Diagnosing & Treating (143 | 8.5%), and Health Technologists (133 | 7.9%).
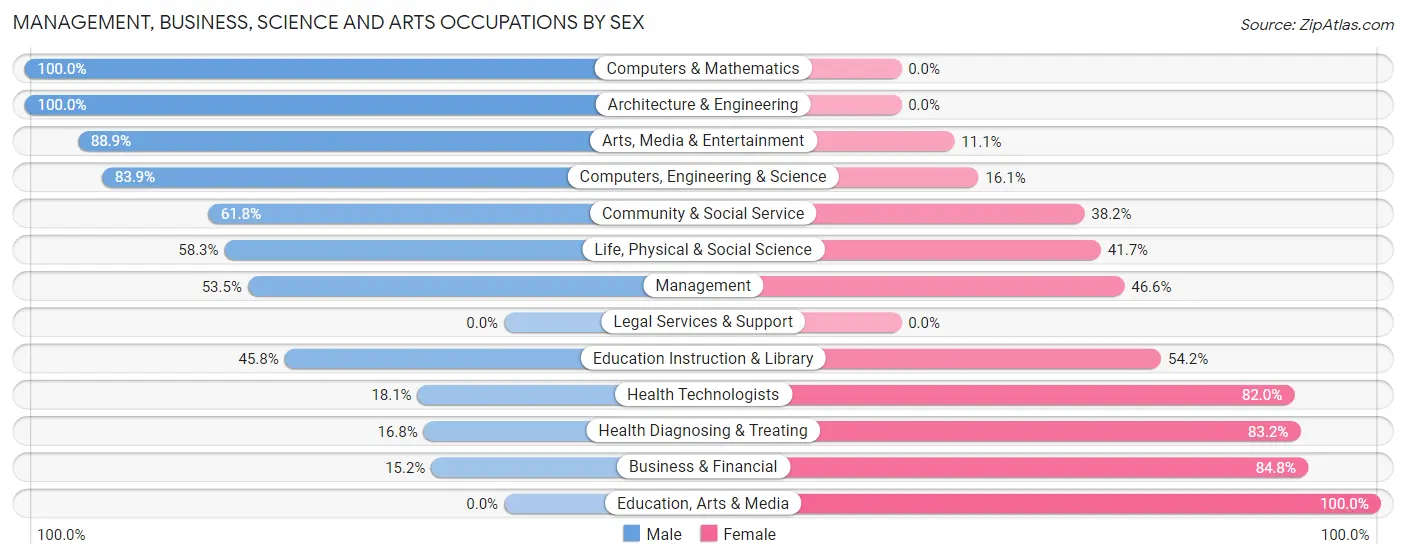
Management, Business, Science and Arts Occupations by Sex
Within the Management, Business, Science and Arts occupations in Linden, the most male-oriented occupations are Computers & Mathematics (100.0%), Architecture & Engineering (100.0%), and Arts, Media & Entertainment (88.9%), while the most female-oriented occupations are Education, Arts & Media (100.0%), Business & Financial (84.8%), and Health Diagnosing & Treating (83.2%).
| Occupation | Male | Female |
| Management | 93 (53.4%) | 81 (46.6%) |
| Business & Financial | 34 (15.2%) | 190 (84.8%) |
| Computers, Engineering & Science | 52 (83.9%) | 10 (16.1%) |
| Computers & Mathematics | 18 (100.0%) | 0 (0.0%) |
| Architecture & Engineering | 20 (100.0%) | 0 (0.0%) |
| Life, Physical & Social Science | 14 (58.3%) | 10 (41.7%) |
| Community & Social Service | 118 (61.8%) | 73 (38.2%) |
| Education, Arts & Media | 0 (0.0%) | 18 (100.0%) |
| Legal Services & Support | 0 (0.0%) | 0 (0.0%) |
| Education Instruction & Library | 38 (45.8%) | 45 (54.2%) |
| Arts, Media & Entertainment | 80 (88.9%) | 10 (11.1%) |
| Health Diagnosing & Treating | 24 (16.8%) | 119 (83.2%) |
| Health Technologists | 24 (18.0%) | 109 (82.0%) |
| Total (Category) | 321 (40.4%) | 473 (59.6%) |
| Total (Overall) | 842 (50.1%) | 839 (49.9%) |
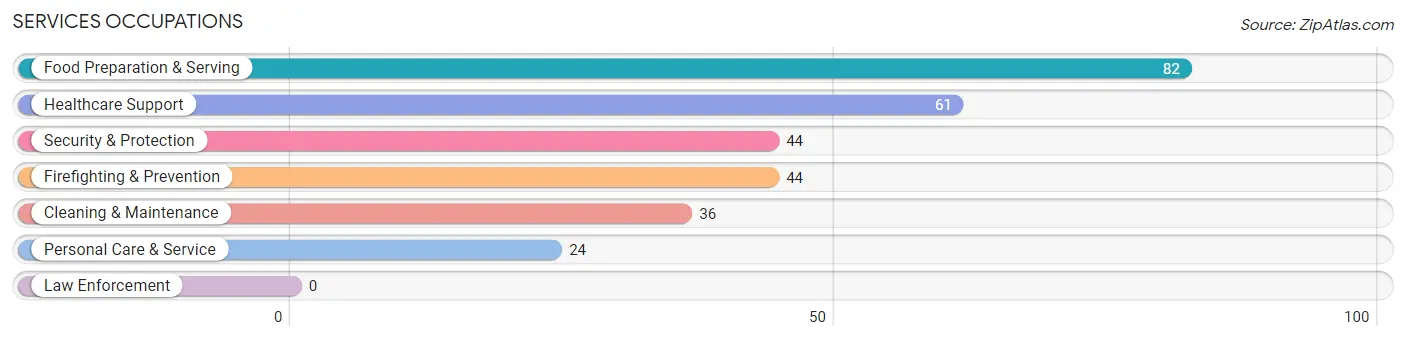
Services Occupations
The most common Services occupations in Linden are Food Preparation & Serving (82 | 4.9%), Healthcare Support (61 | 3.6%), Security & Protection (44 | 2.6%), Firefighting & Prevention (44 | 2.6%), and Cleaning & Maintenance (36 | 2.1%).
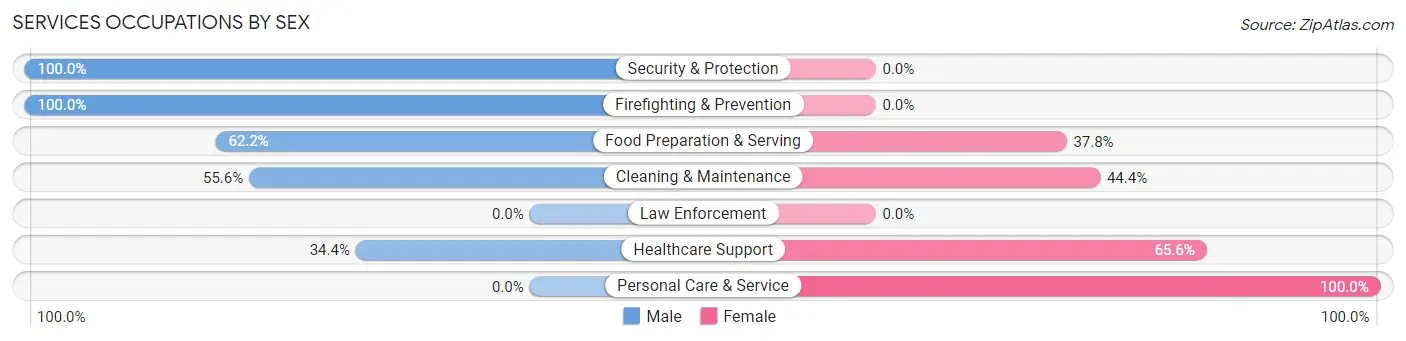
Services Occupations by Sex
Within the Services occupations in Linden, the most male-oriented occupations are Security & Protection (100.0%), Firefighting & Prevention (100.0%), and Food Preparation & Serving (62.2%), while the most female-oriented occupations are Personal Care & Service (100.0%), Healthcare Support (65.6%), and Cleaning & Maintenance (44.4%).
| Occupation | Male | Female |
| Healthcare Support | 21 (34.4%) | 40 (65.6%) |
| Security & Protection | 44 (100.0%) | 0 (0.0%) |
| Firefighting & Prevention | 44 (100.0%) | 0 (0.0%) |
| Law Enforcement | 0 (0.0%) | 0 (0.0%) |
| Food Preparation & Serving | 51 (62.2%) | 31 (37.8%) |
| Cleaning & Maintenance | 20 (55.6%) | 16 (44.4%) |
| Personal Care & Service | 0 (0.0%) | 24 (100.0%) |
| Total (Category) | 136 (55.1%) | 111 (44.9%) |
| Total (Overall) | 842 (50.1%) | 839 (49.9%) |
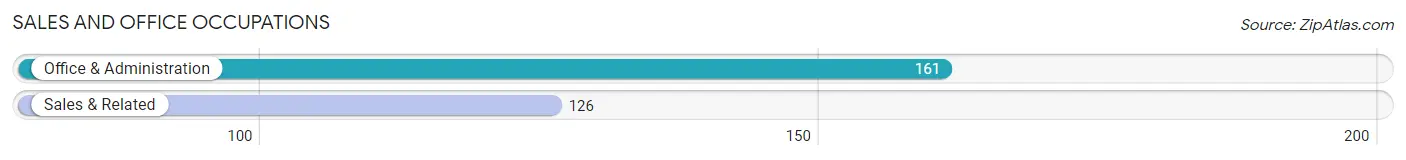
Sales and Office Occupations
The most common Sales and Office occupations in Linden are Office & Administration (161 | 9.6%), and Sales & Related (126 | 7.5%).
Sales and Office Occupations by Sex
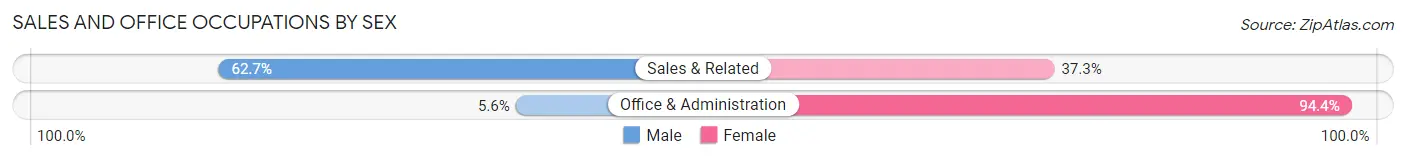
| Occupation | Male | Female |
| Sales & Related | 79 (62.7%) | 47 (37.3%) |
| Office & Administration | 9 (5.6%) | 152 (94.4%) |
| Total (Category) | 88 (30.7%) | 199 (69.3%) |
| Total (Overall) | 842 (50.1%) | 839 (49.9%) |
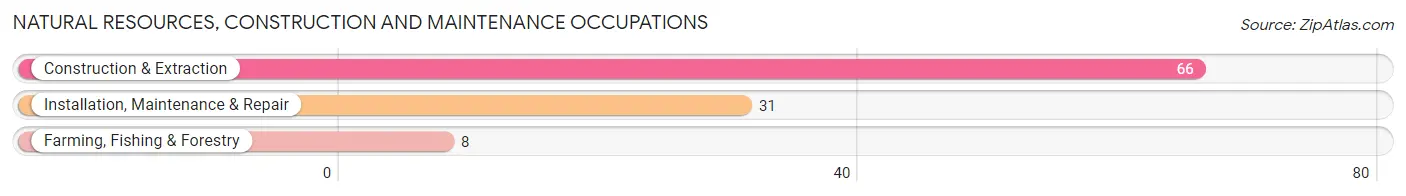
Natural Resources, Construction and Maintenance Occupations
The most common Natural Resources, Construction and Maintenance occupations in Linden are Construction & Extraction (66 | 3.9%), Installation, Maintenance & Repair (31 | 1.8%), and Farming, Fishing & Forestry (8 | 0.5%).
Natural Resources, Construction and Maintenance Occupations by Sex
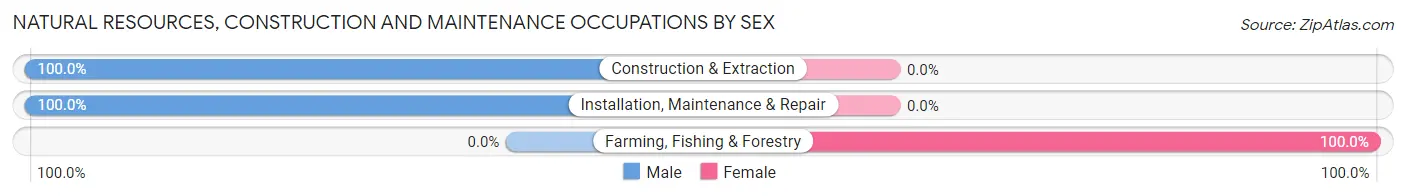
| Occupation | Male | Female |
| Farming, Fishing & Forestry | 0 (0.0%) | 8 (100.0%) |
| Construction & Extraction | 66 (100.0%) | 0 (0.0%) |
| Installation, Maintenance & Repair | 31 (100.0%) | 0 (0.0%) |
| Total (Category) | 97 (92.4%) | 8 (7.6%) |
| Total (Overall) | 842 (50.1%) | 839 (49.9%) |
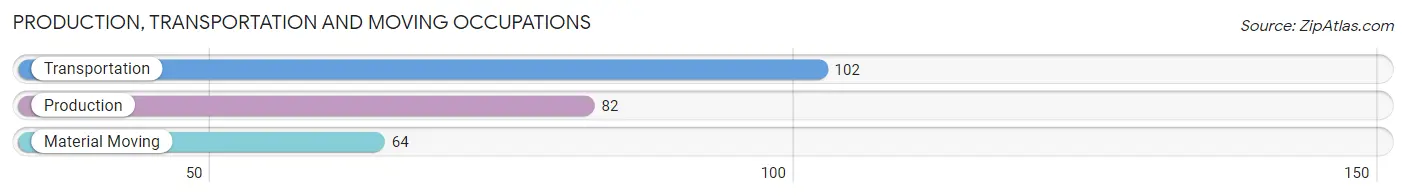
Production, Transportation and Moving Occupations
The most common Production, Transportation and Moving occupations in Linden are Transportation (102 | 6.1%), Production (82 | 4.9%), and Material Moving (64 | 3.8%).
Production, Transportation and Moving Occupations by Sex
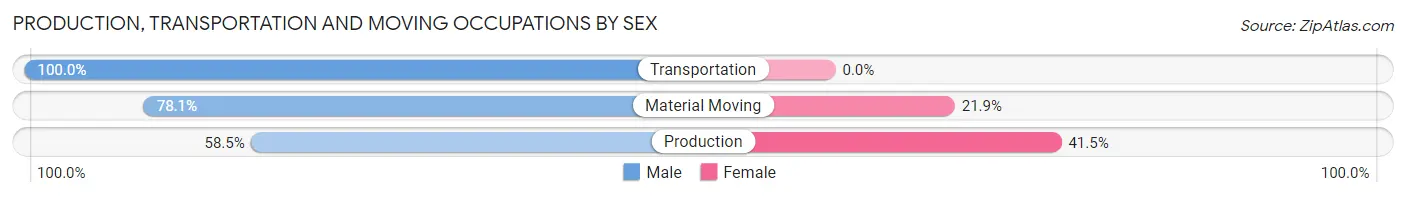
| Occupation | Male | Female |
| Production | 48 (58.5%) | 34 (41.5%) |
| Transportation | 102 (100.0%) | 0 (0.0%) |
| Material Moving | 50 (78.1%) | 14 (21.9%) |
| Total (Category) | 200 (80.6%) | 48 (19.4%) |
| Total (Overall) | 842 (50.1%) | 839 (49.9%) |
Employment Industries by Sex in Linden
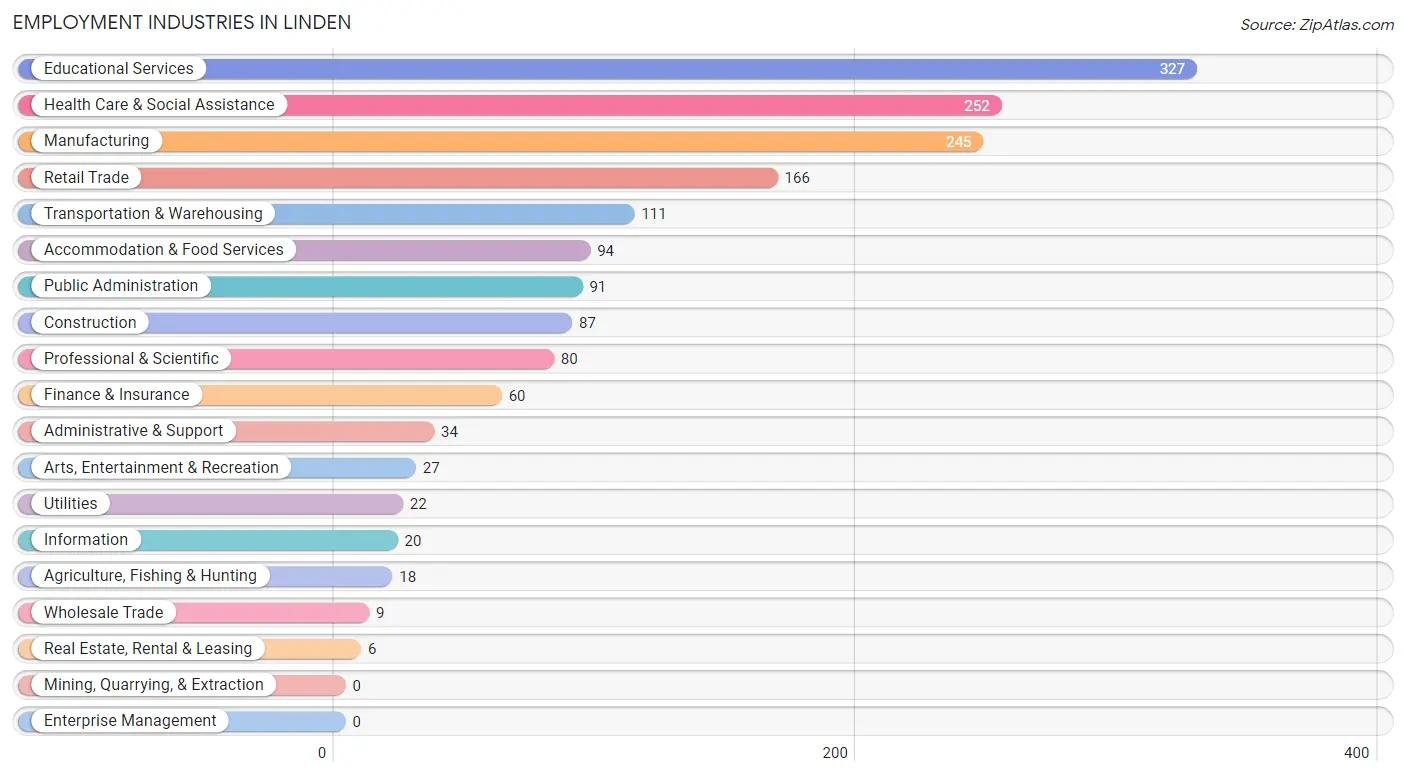
Employment Industries in Linden
The major employment industries in Linden include Educational Services (327 | 19.5%), Health Care & Social Assistance (252 | 15.0%), Manufacturing (245 | 14.6%), Retail Trade (166 | 9.9%), and Transportation & Warehousing (111 | 6.6%).
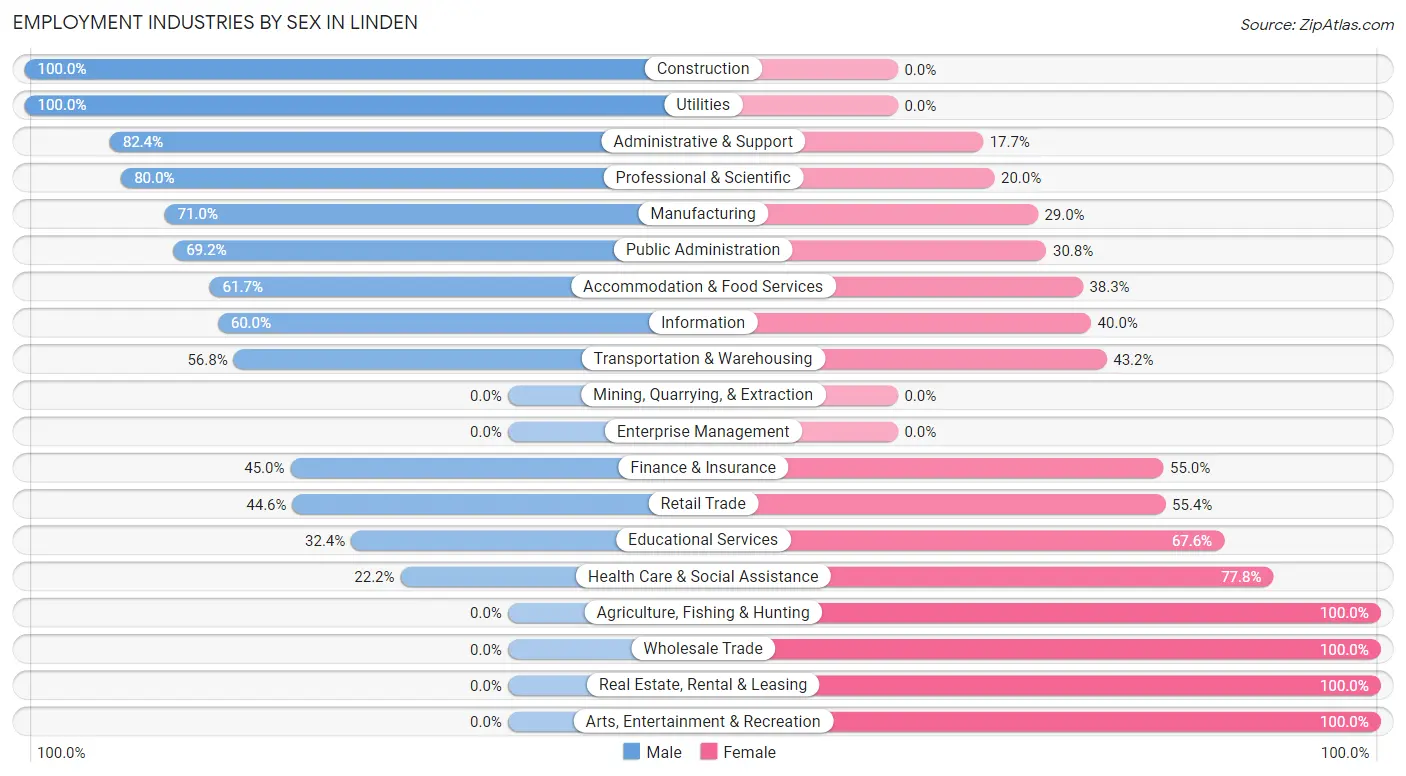
Employment Industries by Sex in Linden
The Linden industries that see more men than women are Construction (100.0%), Utilities (100.0%), and Administrative & Support (82.4%), whereas the industries that tend to have a higher number of women are Agriculture, Fishing & Hunting (100.0%), Wholesale Trade (100.0%), and Real Estate, Rental & Leasing (100.0%).
| Industry | Male | Female |
| Agriculture, Fishing & Hunting | 0 (0.0%) | 18 (100.0%) |
| Mining, Quarrying, & Extraction | 0 (0.0%) | 0 (0.0%) |
| Construction | 87 (100.0%) | 0 (0.0%) |
| Manufacturing | 174 (71.0%) | 71 (29.0%) |
| Wholesale Trade | 0 (0.0%) | 9 (100.0%) |
| Retail Trade | 74 (44.6%) | 92 (55.4%) |
| Transportation & Warehousing | 63 (56.8%) | 48 (43.2%) |
| Utilities | 22 (100.0%) | 0 (0.0%) |
| Information | 12 (60.0%) | 8 (40.0%) |
| Finance & Insurance | 27 (45.0%) | 33 (55.0%) |
| Real Estate, Rental & Leasing | 0 (0.0%) | 6 (100.0%) |
| Professional & Scientific | 64 (80.0%) | 16 (20.0%) |
| Enterprise Management | 0 (0.0%) | 0 (0.0%) |
| Administrative & Support | 28 (82.4%) | 6 (17.6%) |
| Educational Services | 106 (32.4%) | 221 (67.6%) |
| Health Care & Social Assistance | 56 (22.2%) | 196 (77.8%) |
| Arts, Entertainment & Recreation | 0 (0.0%) | 27 (100.0%) |
| Accommodation & Food Services | 58 (61.7%) | 36 (38.3%) |
| Public Administration | 63 (69.2%) | 28 (30.8%) |
| Total | 842 (50.1%) | 839 (49.9%) |
Education in Linden
School Enrollment in Linden
The most common levels of schooling among the 1,259 students in Linden are high school (274 | 21.8%), nursery / preschool (228 | 18.1%), and college / undergraduate (209 | 16.6%).
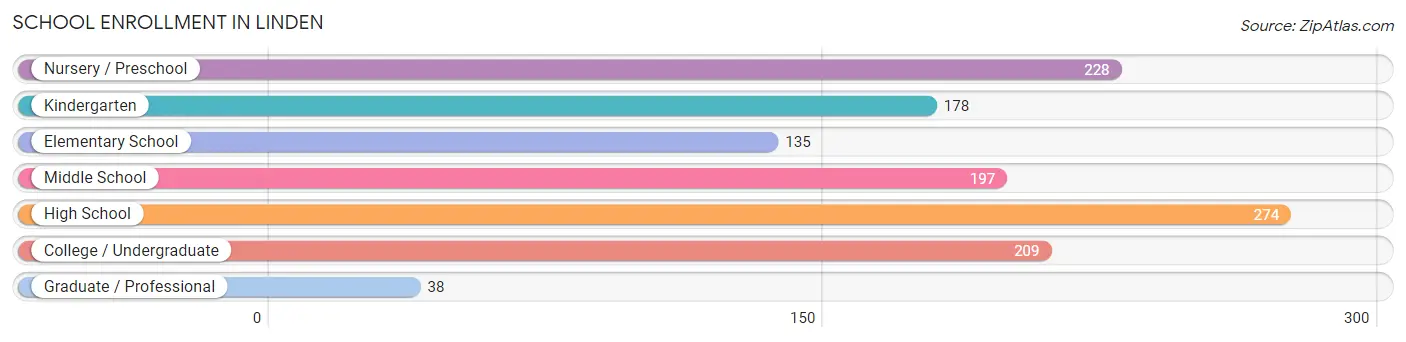
| School Level | # Students | % Students |
| Nursery / Preschool | 228 | 18.1% |
| Kindergarten | 178 | 14.1% |
| Elementary School | 135 | 10.7% |
| Middle School | 197 | 15.7% |
| High School | 274 | 21.8% |
| College / Undergraduate | 209 | 16.6% |
| Graduate / Professional | 38 | 3.0% |
| Total | 1,259 | 100.0% |
School Enrollment by Age by Funding Source in Linden
Out of a total of 1,259 students who are enrolled in schools in Linden, 145 (11.5%) attend a private institution, while the remaining 1,114 (88.5%) are enrolled in public schools. The age group of 20 to 24 year olds has the highest likelihood of being enrolled in private schools, with 101 (63.5% in the age bracket) enrolled. Conversely, the age group of 3 to 4 year olds has the lowest likelihood of being enrolled in a private school, with 221 (100.0% in the age bracket) attending a public institution.
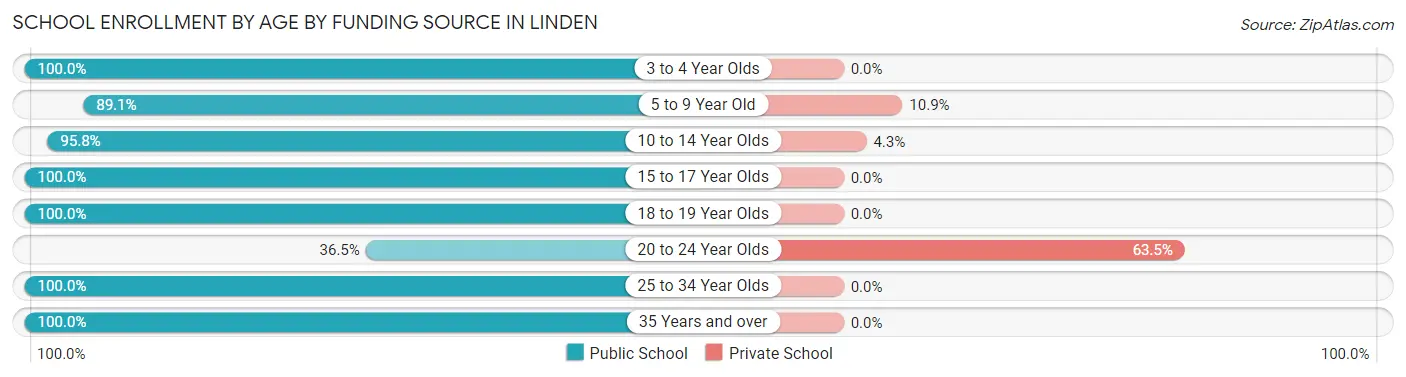
| Age Bracket | Public School | Private School |
| 3 to 4 Year Olds | 221 (100.0%) | 0 (0.0%) |
| 5 to 9 Year Old | 285 (89.1%) | 35 (10.9%) |
| 10 to 14 Year Olds | 203 (95.8%) | 9 (4.3%) |
| 15 to 17 Year Olds | 259 (100.0%) | 0 (0.0%) |
| 18 to 19 Year Olds | 34 (100.0%) | 0 (0.0%) |
| 20 to 24 Year Olds | 58 (36.5%) | 101 (63.5%) |
| 25 to 34 Year Olds | 18 (100.0%) | 0 (0.0%) |
| 35 Years and over | 36 (100.0%) | 0 (0.0%) |
| Total | 1,114 (88.5%) | 145 (11.5%) |
Educational Attainment by Field of Study in Linden
Business (278 | 33.7%), science & technology (104 | 12.6%), education (90 | 10.9%), bio, nature & agricultural (56 | 6.8%), and psychology (51 | 6.2%) are the most common fields of study among 825 individuals in Linden who have obtained a bachelor's degree or higher.
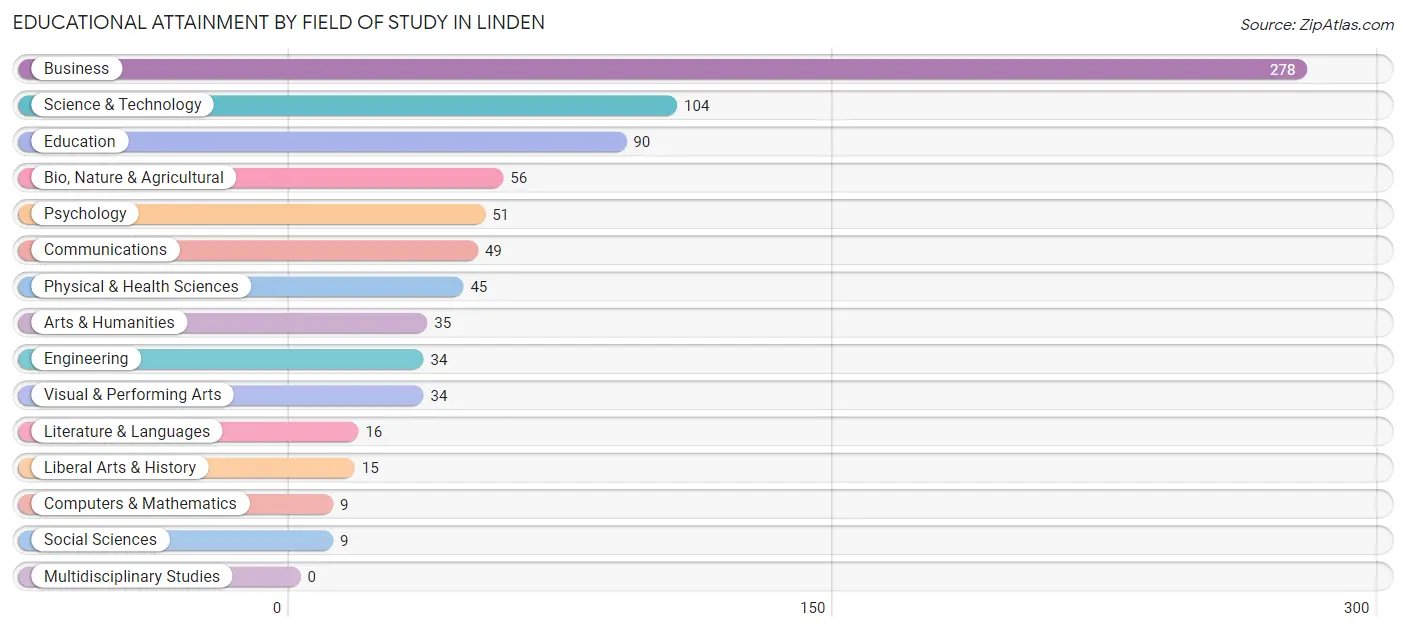
| Field of Study | # Graduates | % Graduates |
| Computers & Mathematics | 9 | 1.1% |
| Bio, Nature & Agricultural | 56 | 6.8% |
| Physical & Health Sciences | 45 | 5.4% |
| Psychology | 51 | 6.2% |
| Social Sciences | 9 | 1.1% |
| Engineering | 34 | 4.1% |
| Multidisciplinary Studies | 0 | 0.0% |
| Science & Technology | 104 | 12.6% |
| Business | 278 | 33.7% |
| Education | 90 | 10.9% |
| Literature & Languages | 16 | 1.9% |
| Liberal Arts & History | 15 | 1.8% |
| Visual & Performing Arts | 34 | 4.1% |
| Communications | 49 | 5.9% |
| Arts & Humanities | 35 | 4.2% |
| Total | 825 | 100.0% |
Transportation & Commute in Linden
Vehicle Availability by Sex in Linden
The most prevalent vehicle ownership categories in Linden are males with 3 vehicles (340, accounting for 40.9%) and females with 3 vehicles (414, making up 41.2%).
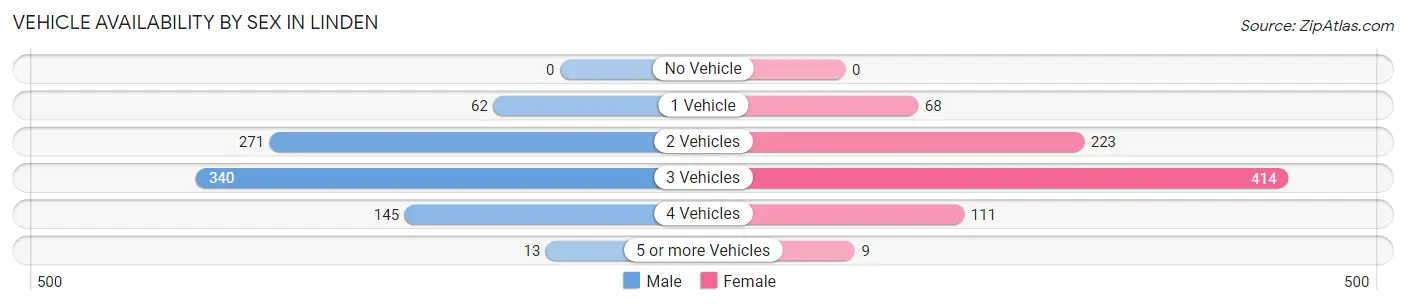
| Vehicles Available | Male | Female |
| No Vehicle | 0 (0.0%) | 0 (0.0%) |
| 1 Vehicle | 62 (7.5%) | 68 (8.2%) |
| 2 Vehicles | 271 (32.6%) | 223 (27.0%) |
| 3 Vehicles | 340 (40.9%) | 414 (50.2%) |
| 4 Vehicles | 145 (17.4%) | 111 (13.5%) |
| 5 or more Vehicles | 13 (1.6%) | 9 (1.1%) |
| Total | 831 (100.0%) | 825 (100.0%) |
Commute Time in Linden
The most frequently occuring commute durations in Linden are 20 to 24 minutes (367 commuters, 24.0%), 60 to 89 minutes (219 commuters, 14.3%), and 45 to 59 minutes (169 commuters, 11.1%).
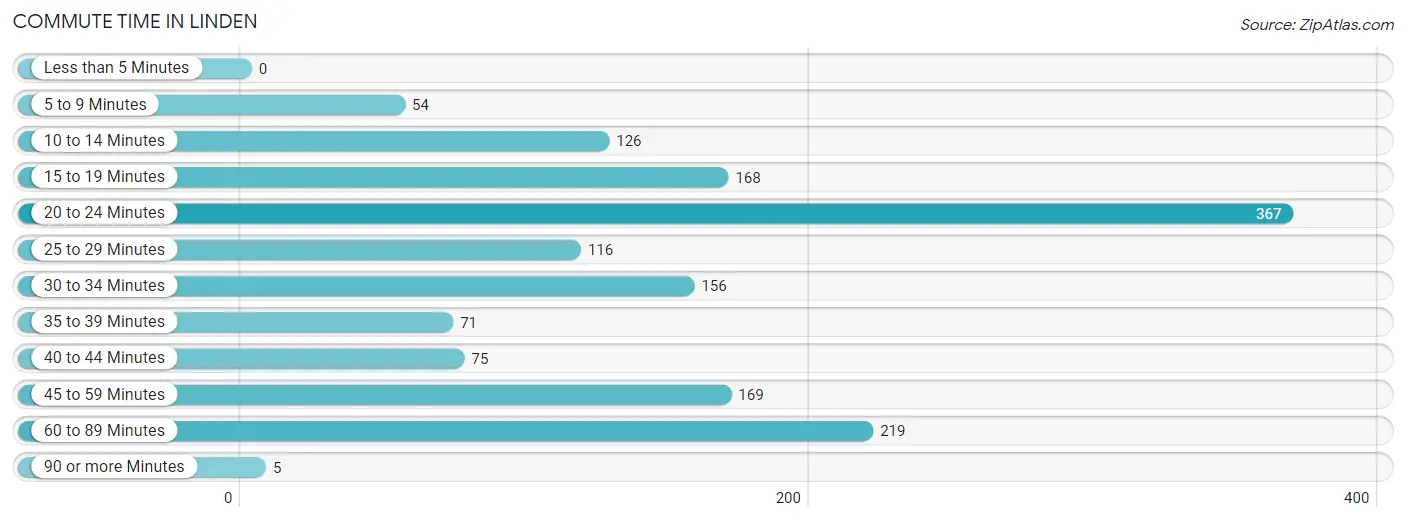
| Commute Time | # Commuters | % Commuters |
| Less than 5 Minutes | 0 | 0.0% |
| 5 to 9 Minutes | 54 | 3.5% |
| 10 to 14 Minutes | 126 | 8.3% |
| 15 to 19 Minutes | 168 | 11.0% |
| 20 to 24 Minutes | 367 | 24.0% |
| 25 to 29 Minutes | 116 | 7.6% |
| 30 to 34 Minutes | 156 | 10.2% |
| 35 to 39 Minutes | 71 | 4.6% |
| 40 to 44 Minutes | 75 | 4.9% |
| 45 to 59 Minutes | 169 | 11.1% |
| 60 to 89 Minutes | 219 | 14.3% |
| 90 or more Minutes | 5 | 0.3% |
Commute Time by Sex in Linden
The most common commute times in Linden are 60 to 89 minutes (177 commuters, 23.1%) for males and 20 to 24 minutes (277 commuters, 36.5%) for females.
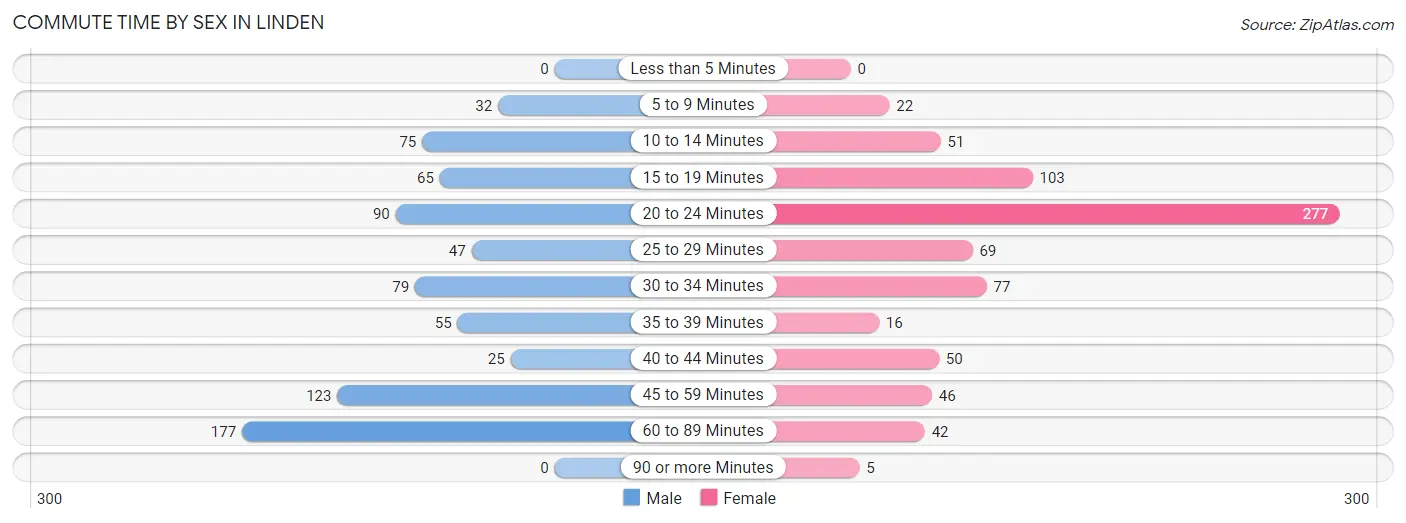
| Commute Time | Male | Female |
| Less than 5 Minutes | 0 (0.0%) | 0 (0.0%) |
| 5 to 9 Minutes | 32 (4.2%) | 22 (2.9%) |
| 10 to 14 Minutes | 75 (9.8%) | 51 (6.7%) |
| 15 to 19 Minutes | 65 (8.5%) | 103 (13.6%) |
| 20 to 24 Minutes | 90 (11.7%) | 277 (36.5%) |
| 25 to 29 Minutes | 47 (6.1%) | 69 (9.1%) |
| 30 to 34 Minutes | 79 (10.3%) | 77 (10.2%) |
| 35 to 39 Minutes | 55 (7.2%) | 16 (2.1%) |
| 40 to 44 Minutes | 25 (3.3%) | 50 (6.6%) |
| 45 to 59 Minutes | 123 (16.0%) | 46 (6.1%) |
| 60 to 89 Minutes | 177 (23.1%) | 42 (5.5%) |
| 90 or more Minutes | 0 (0.0%) | 5 (0.7%) |
Time of Departure to Work by Sex in Linden
The most frequent times of departure to work in Linden are 7:30 AM to 7:59 AM (138, 18.0%) for males and 7:30 AM to 7:59 AM (209, 27.6%) for females.
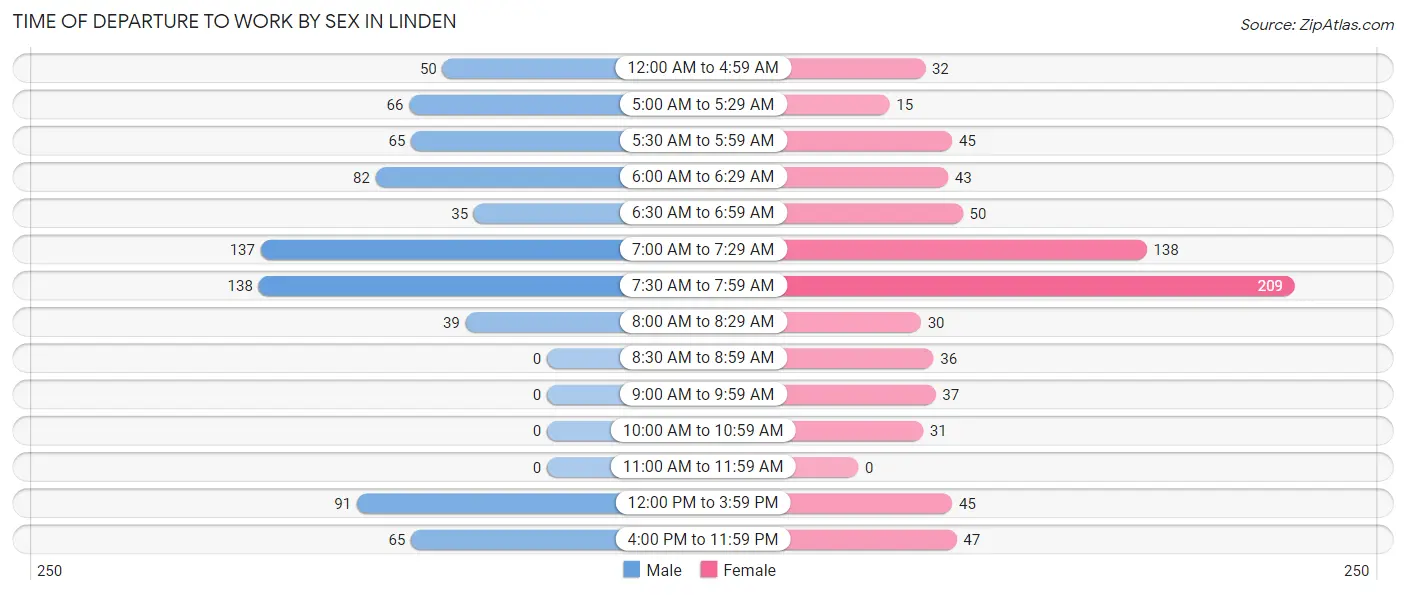
| Time of Departure | Male | Female |
| 12:00 AM to 4:59 AM | 50 (6.5%) | 32 (4.2%) |
| 5:00 AM to 5:29 AM | 66 (8.6%) | 15 (2.0%) |
| 5:30 AM to 5:59 AM | 65 (8.5%) | 45 (5.9%) |
| 6:00 AM to 6:29 AM | 82 (10.7%) | 43 (5.7%) |
| 6:30 AM to 6:59 AM | 35 (4.6%) | 50 (6.6%) |
| 7:00 AM to 7:29 AM | 137 (17.8%) | 138 (18.2%) |
| 7:30 AM to 7:59 AM | 138 (18.0%) | 209 (27.6%) |
| 8:00 AM to 8:29 AM | 39 (5.1%) | 30 (4.0%) |
| 8:30 AM to 8:59 AM | 0 (0.0%) | 36 (4.8%) |
| 9:00 AM to 9:59 AM | 0 (0.0%) | 37 (4.9%) |
| 10:00 AM to 10:59 AM | 0 (0.0%) | 31 (4.1%) |
| 11:00 AM to 11:59 AM | 0 (0.0%) | 0 (0.0%) |
| 12:00 PM to 3:59 PM | 91 (11.8%) | 45 (5.9%) |
| 4:00 PM to 11:59 PM | 65 (8.5%) | 47 (6.2%) |
| Total | 768 (100.0%) | 758 (100.0%) |
Housing Occupancy in Linden
Occupancy by Ownership in Linden
Of the total 1,501 dwellings in Linden, owner-occupied units account for 1,405 (93.6%), while renter-occupied units make up 96 (6.4%).
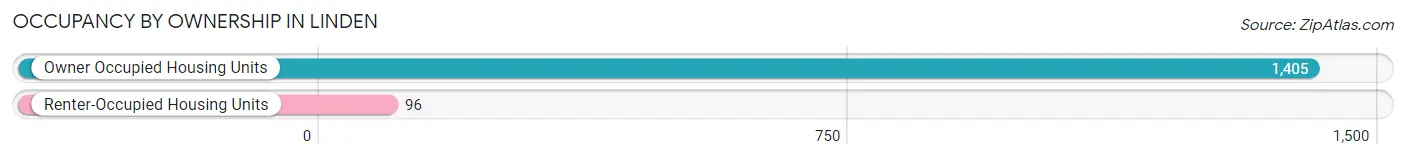
| Occupancy | # Housing Units | % Housing Units |
| Owner Occupied Housing Units | 1,405 | 93.6% |
| Renter-Occupied Housing Units | 96 | 6.4% |
| Total Occupied Housing Units | 1,501 | 100.0% |
Occupancy by Household Size in Linden
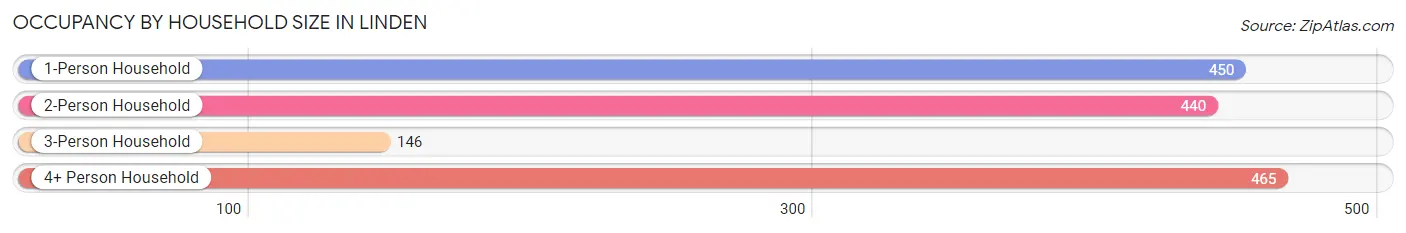
| Household Size | # Housing Units | % Housing Units |
| 1-Person Household | 450 | 30.0% |
| 2-Person Household | 440 | 29.3% |
| 3-Person Household | 146 | 9.7% |
| 4+ Person Household | 465 | 31.0% |
| Total Housing Units | 1,501 | 100.0% |
Occupancy by Ownership by Household Size in Linden
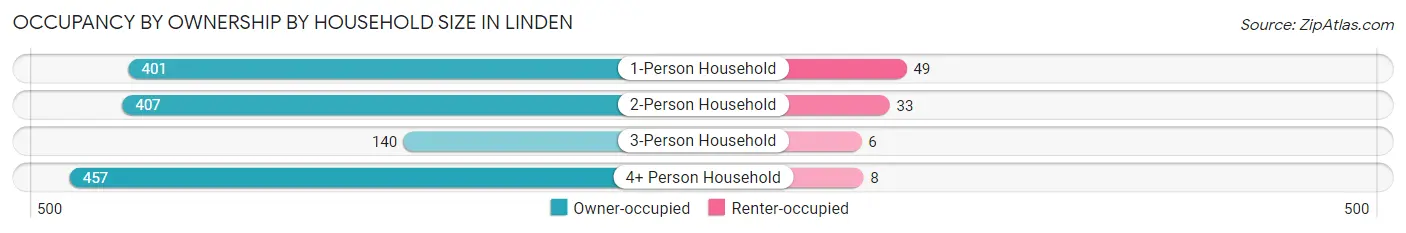
| Household Size | Owner-occupied | Renter-occupied |
| 1-Person Household | 401 (89.1%) | 49 (10.9%) |
| 2-Person Household | 407 (92.5%) | 33 (7.5%) |
| 3-Person Household | 140 (95.9%) | 6 (4.1%) |
| 4+ Person Household | 457 (98.3%) | 8 (1.7%) |
| Total Housing Units | 1,405 (93.6%) | 96 (6.4%) |
Occupancy by Educational Attainment in Linden
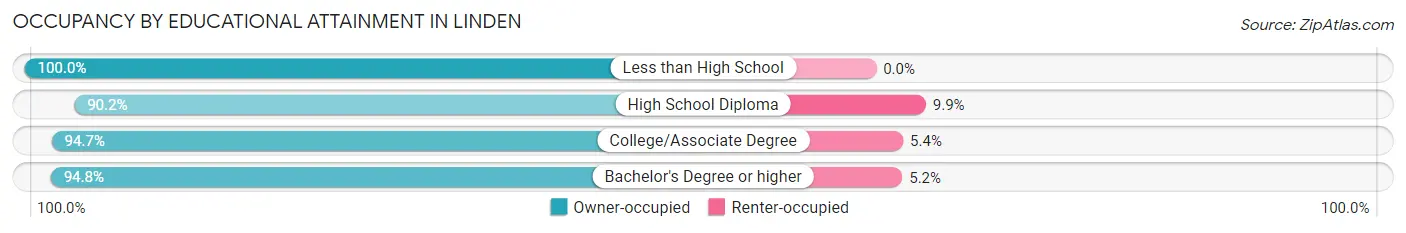
| Household Size | Owner-occupied | Renter-occupied |
| Less than High School | 32 (100.0%) | 0 (0.0%) |
| High School Diploma | 366 (90.1%) | 40 (9.9%) |
| College/Associate Degree | 513 (94.7%) | 29 (5.3%) |
| Bachelor's Degree or higher | 494 (94.8%) | 27 (5.2%) |
Occupancy by Age of Householder in Linden
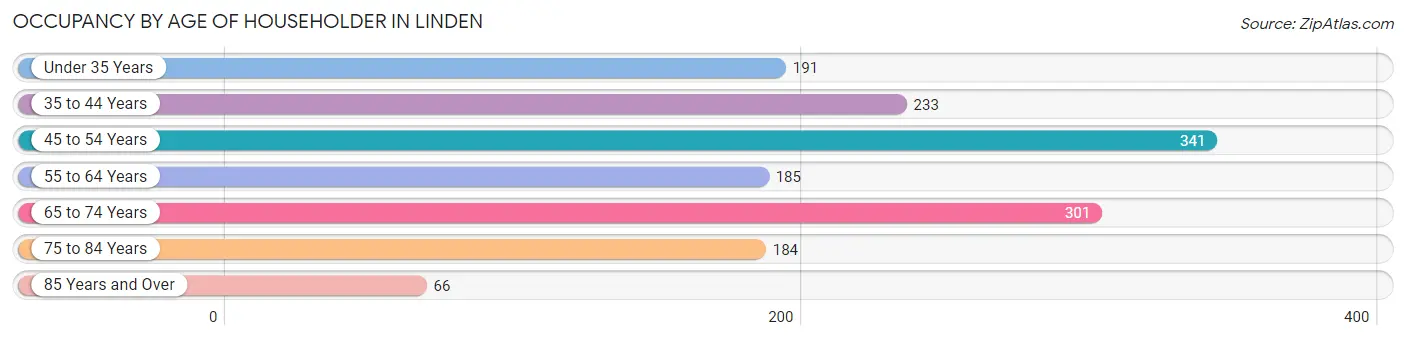
| Age Bracket | # Households | % Households |
| Under 35 Years | 191 | 12.7% |
| 35 to 44 Years | 233 | 15.5% |
| 45 to 54 Years | 341 | 22.7% |
| 55 to 64 Years | 185 | 12.3% |
| 65 to 74 Years | 301 | 20.1% |
| 75 to 84 Years | 184 | 12.3% |
| 85 Years and Over | 66 | 4.4% |
| Total | 1,501 | 100.0% |
Housing Finances in Linden
Median Income by Occupancy in Linden
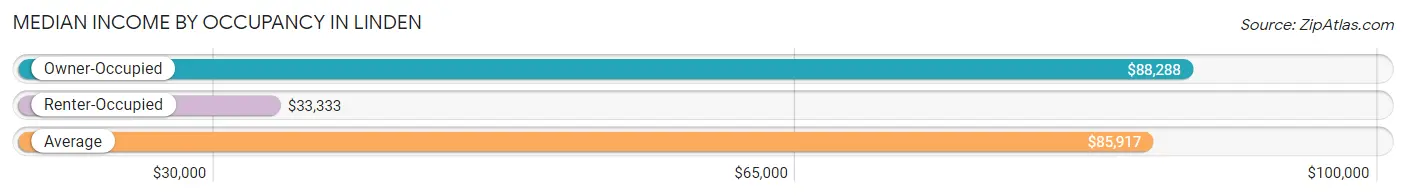
| Occupancy Type | # Households | Median Income |
| Owner-Occupied | 1,405 (93.6%) | $88,288 |
| Renter-Occupied | 96 (6.4%) | $33,333 |
| Average | 1,501 (100.0%) | $85,917 |
Occupancy by Householder Income Bracket in Linden
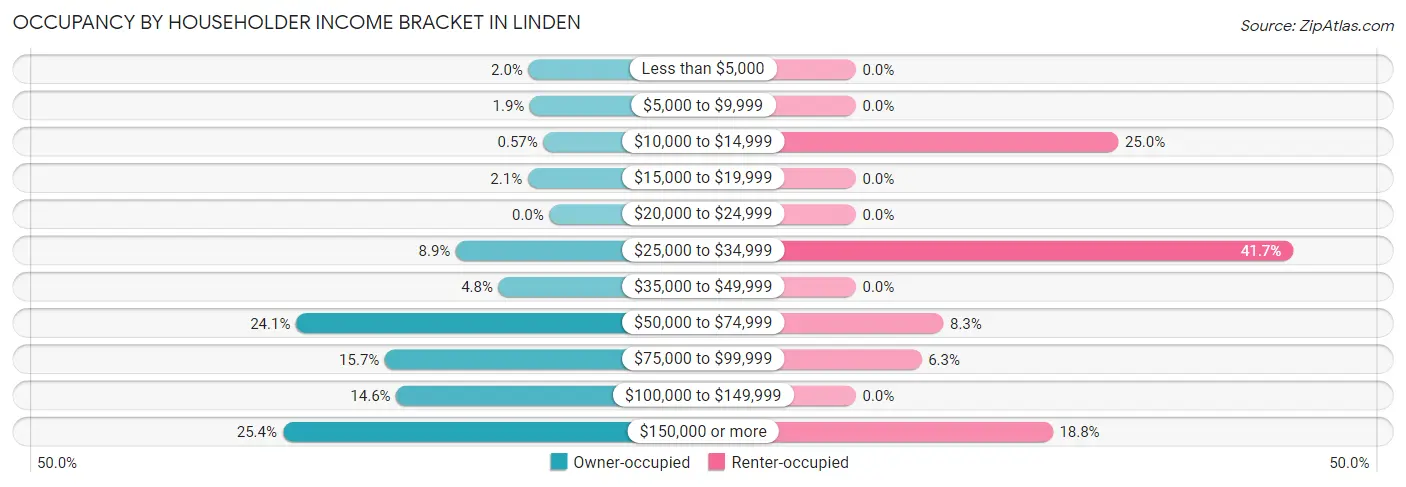
| Income Bracket | Owner-occupied | Renter-occupied |
| Less than $5,000 | 28 (2.0%) | 0 (0.0%) |
| $5,000 to $9,999 | 26 (1.8%) | 0 (0.0%) |
| $10,000 to $14,999 | 8 (0.6%) | 24 (25.0%) |
| $15,000 to $19,999 | 29 (2.1%) | 0 (0.0%) |
| $20,000 to $24,999 | 0 (0.0%) | 0 (0.0%) |
| $25,000 to $34,999 | 125 (8.9%) | 40 (41.7%) |
| $35,000 to $49,999 | 68 (4.8%) | 0 (0.0%) |
| $50,000 to $74,999 | 339 (24.1%) | 8 (8.3%) |
| $75,000 to $99,999 | 220 (15.7%) | 6 (6.2%) |
| $100,000 to $149,999 | 205 (14.6%) | 0 (0.0%) |
| $150,000 or more | 357 (25.4%) | 18 (18.8%) |
| Total | 1,405 (100.0%) | 96 (100.0%) |
Monthly Housing Cost Tiers in Linden
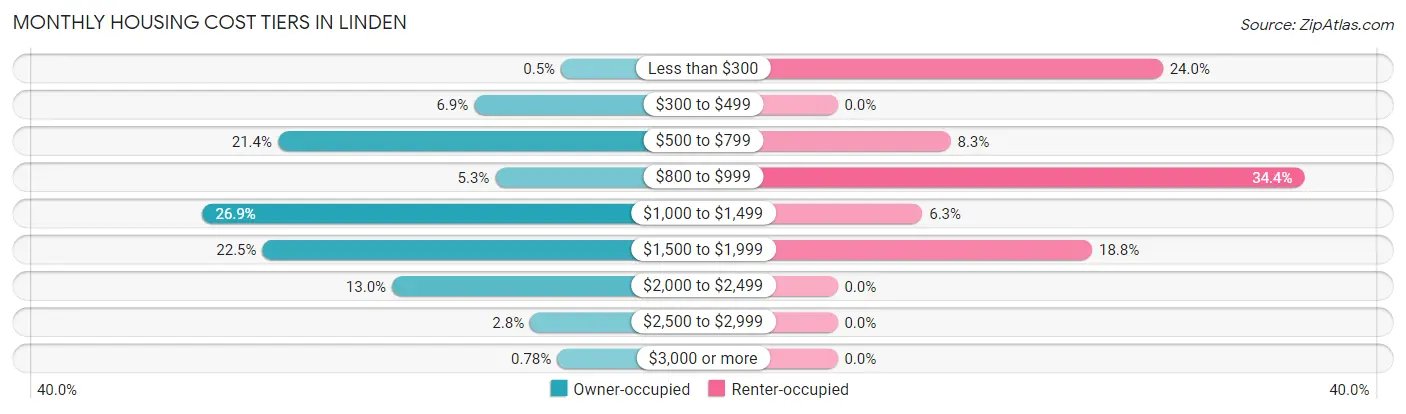
| Monthly Cost | Owner-occupied | Renter-occupied |
| Less than $300 | 7 (0.5%) | 23 (24.0%) |
| $300 to $499 | 97 (6.9%) | 0 (0.0%) |
| $500 to $799 | 300 (21.3%) | 8 (8.3%) |
| $800 to $999 | 75 (5.3%) | 33 (34.4%) |
| $1,000 to $1,499 | 378 (26.9%) | 6 (6.2%) |
| $1,500 to $1,999 | 316 (22.5%) | 18 (18.8%) |
| $2,000 to $2,499 | 182 (13.0%) | 0 (0.0%) |
| $2,500 to $2,999 | 39 (2.8%) | 0 (0.0%) |
| $3,000 or more | 11 (0.8%) | 0 (0.0%) |
| Total | 1,405 (100.0%) | 96 (100.0%) |
Physical Housing Characteristics in Linden
Housing Structures in Linden
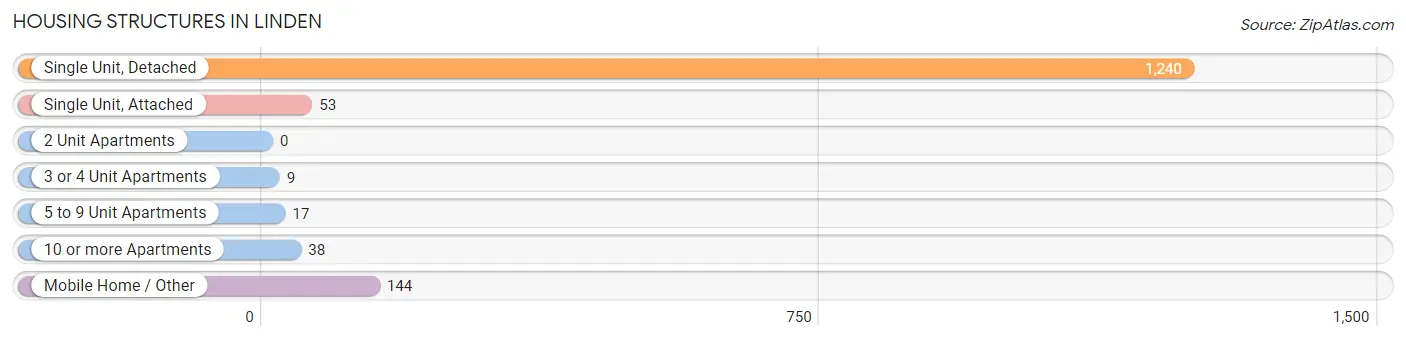
| Structure Type | # Housing Units | % Housing Units |
| Single Unit, Detached | 1,240 | 82.6% |
| Single Unit, Attached | 53 | 3.5% |
| 2 Unit Apartments | 0 | 0.0% |
| 3 or 4 Unit Apartments | 9 | 0.6% |
| 5 to 9 Unit Apartments | 17 | 1.1% |
| 10 or more Apartments | 38 | 2.5% |
| Mobile Home / Other | 144 | 9.6% |
| Total | 1,501 | 100.0% |
Housing Structures by Occupancy in Linden
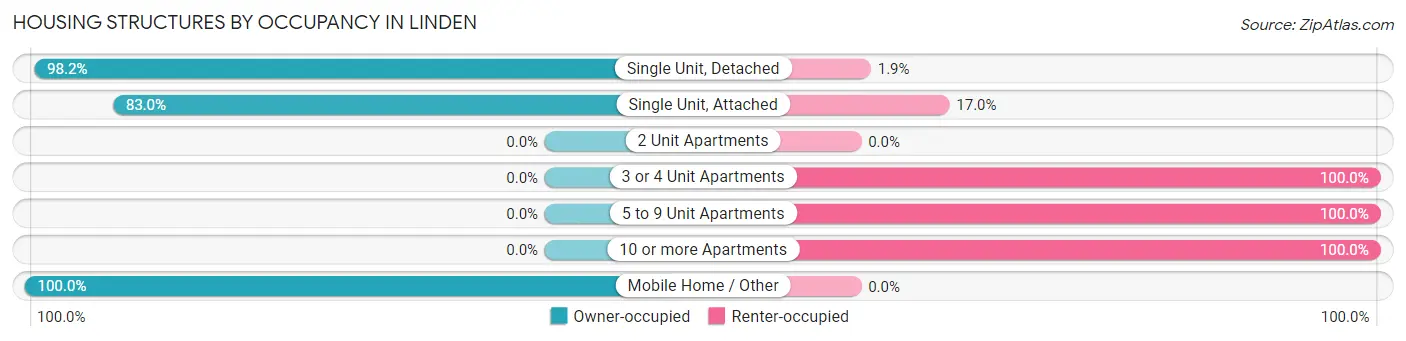
| Structure Type | Owner-occupied | Renter-occupied |
| Single Unit, Detached | 1,217 (98.2%) | 23 (1.8%) |
| Single Unit, Attached | 44 (83.0%) | 9 (17.0%) |
| 2 Unit Apartments | 0 (0.0%) | 0 (0.0%) |
| 3 or 4 Unit Apartments | 0 (0.0%) | 9 (100.0%) |
| 5 to 9 Unit Apartments | 0 (0.0%) | 17 (100.0%) |
| 10 or more Apartments | 0 (0.0%) | 38 (100.0%) |
| Mobile Home / Other | 144 (100.0%) | 0 (0.0%) |
| Total | 1,405 (93.6%) | 96 (6.4%) |
Housing Structures by Number of Rooms in Linden
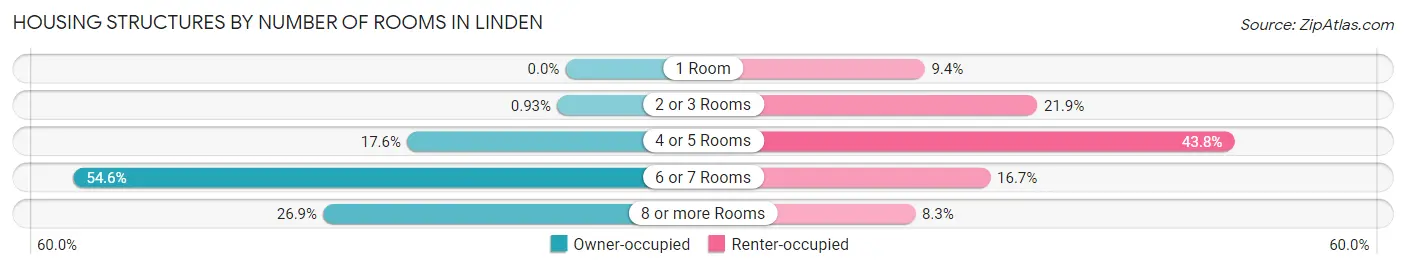
| Number of Rooms | Owner-occupied | Renter-occupied |
| 1 Room | 0 (0.0%) | 9 (9.4%) |
| 2 or 3 Rooms | 13 (0.9%) | 21 (21.9%) |
| 4 or 5 Rooms | 247 (17.6%) | 42 (43.8%) |
| 6 or 7 Rooms | 767 (54.6%) | 16 (16.7%) |
| 8 or more Rooms | 378 (26.9%) | 8 (8.3%) |
| Total | 1,405 (100.0%) | 96 (100.0%) |
Housing Structure by Heating Type in Linden
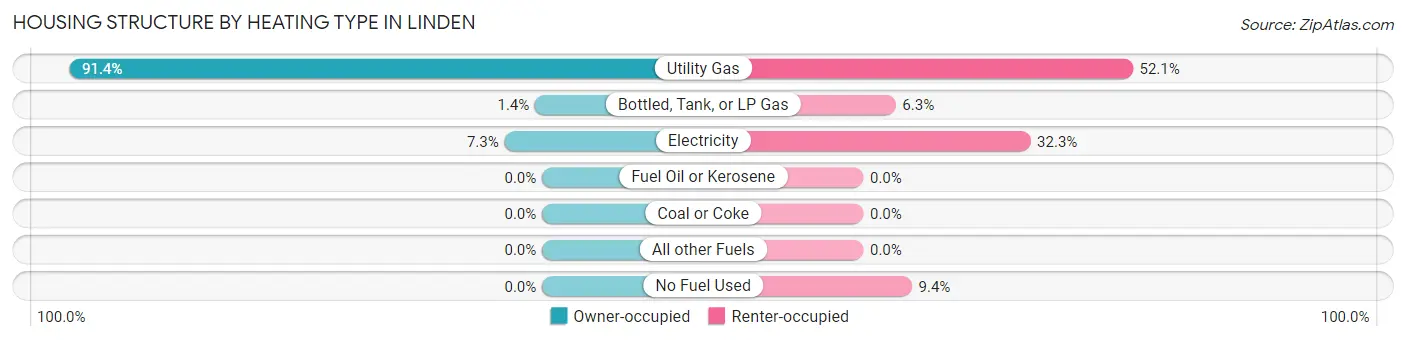
| Heating Type | Owner-occupied | Renter-occupied |
| Utility Gas | 1,284 (91.4%) | 50 (52.1%) |
| Bottled, Tank, or LP Gas | 19 (1.3%) | 6 (6.2%) |
| Electricity | 102 (7.3%) | 31 (32.3%) |
| Fuel Oil or Kerosene | 0 (0.0%) | 0 (0.0%) |
| Coal or Coke | 0 (0.0%) | 0 (0.0%) |
| All other Fuels | 0 (0.0%) | 0 (0.0%) |
| No Fuel Used | 0 (0.0%) | 9 (9.4%) |
| Total | 1,405 (100.0%) | 96 (100.0%) |
Household Vehicle Usage in Linden
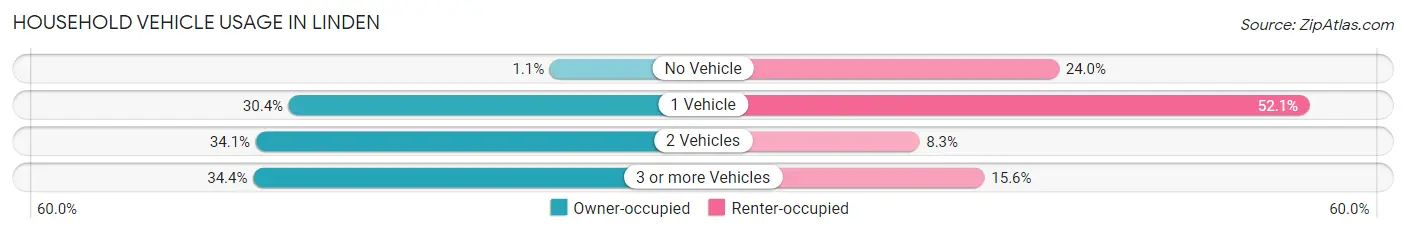
| Vehicles per Household | Owner-occupied | Renter-occupied |
| No Vehicle | 16 (1.1%) | 23 (24.0%) |
| 1 Vehicle | 427 (30.4%) | 50 (52.1%) |
| 2 Vehicles | 479 (34.1%) | 8 (8.3%) |
| 3 or more Vehicles | 483 (34.4%) | 15 (15.6%) |
| Total | 1,405 (100.0%) | 96 (100.0%) |
Real Estate & Mortgages in Linden
Real Estate and Mortgage Overview in Linden
| Characteristic | Without Mortgage | With Mortgage |
| Housing Units | 440 | 965 |
| Median Property Value | $153,500 | $235,000 |
| Median Household Income | $59,444 | $338 |
| Monthly Housing Costs | $637 | $11 |
| Real Estate Taxes | $2,330 | $25 |
Property Value by Mortgage Status in Linden
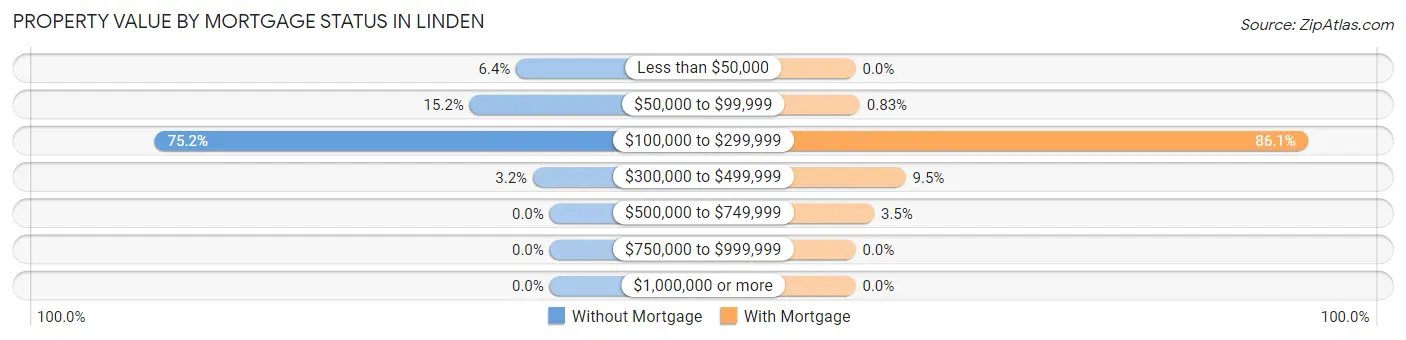
| Property Value | Without Mortgage | With Mortgage |
| Less than $50,000 | 28 (6.4%) | 0 (0.0%) |
| $50,000 to $99,999 | 67 (15.2%) | 8 (0.8%) |
| $100,000 to $299,999 | 331 (75.2%) | 831 (86.1%) |
| $300,000 to $499,999 | 14 (3.2%) | 92 (9.5%) |
| $500,000 to $749,999 | 0 (0.0%) | 34 (3.5%) |
| $750,000 to $999,999 | 0 (0.0%) | 0 (0.0%) |
| $1,000,000 or more | 0 (0.0%) | 0 (0.0%) |
| Total | 440 (100.0%) | 965 (100.0%) |
Household Income by Mortgage Status in Linden
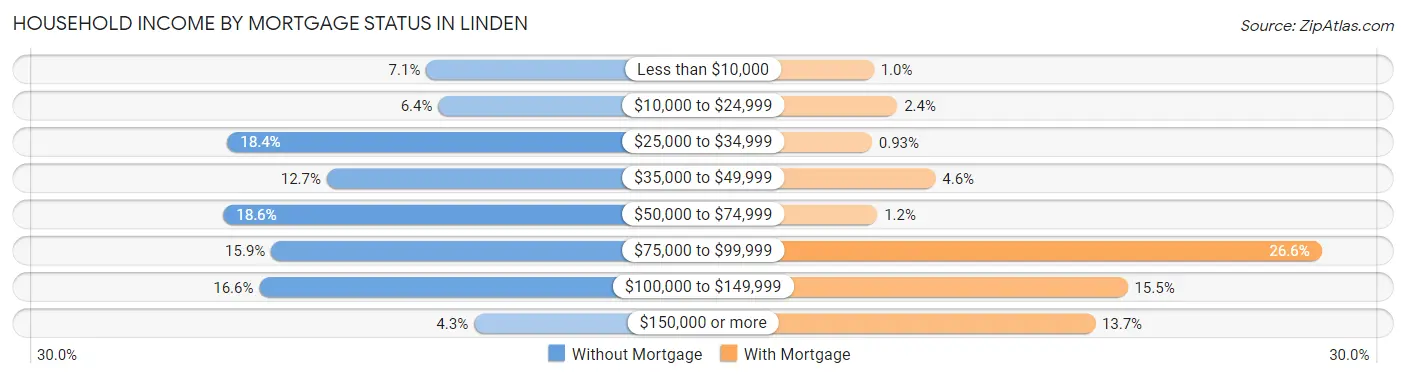
| Household Income | Without Mortgage | With Mortgage |
| Less than $10,000 | 31 (7.0%) | 10 (1.0%) |
| $10,000 to $24,999 | 28 (6.4%) | 23 (2.4%) |
| $25,000 to $34,999 | 81 (18.4%) | 9 (0.9%) |
| $35,000 to $49,999 | 56 (12.7%) | 44 (4.6%) |
| $50,000 to $74,999 | 82 (18.6%) | 12 (1.2%) |
| $75,000 to $99,999 | 70 (15.9%) | 257 (26.6%) |
| $100,000 to $149,999 | 73 (16.6%) | 150 (15.5%) |
| $150,000 or more | 19 (4.3%) | 132 (13.7%) |
| Total | 440 (100.0%) | 965 (100.0%) |
Property Value to Household Income Ratio in Linden
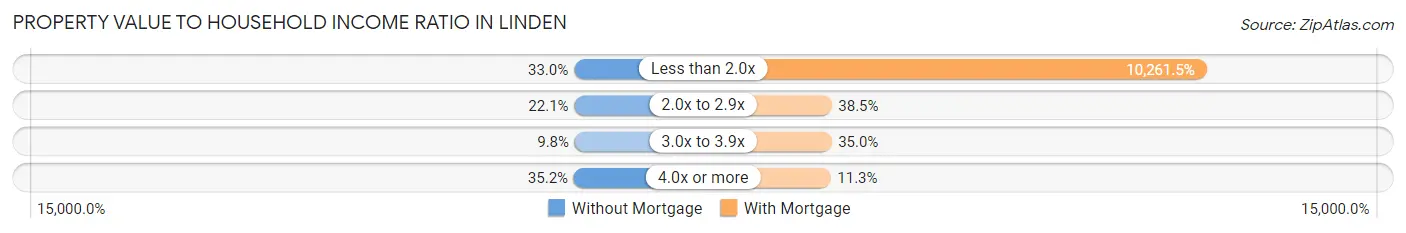
| Value-to-Income Ratio | Without Mortgage | With Mortgage |
| Less than 2.0x | 145 (33.0%) | 99,023 (10,261.5%) |
| 2.0x to 2.9x | 97 (22.1%) | 371 (38.5%) |
| 3.0x to 3.9x | 43 (9.8%) | 338 (35.0%) |
| 4.0x or more | 155 (35.2%) | 109 (11.3%) |
| Total | 440 (100.0%) | 965 (100.0%) |
Real Estate Taxes by Mortgage Status in Linden
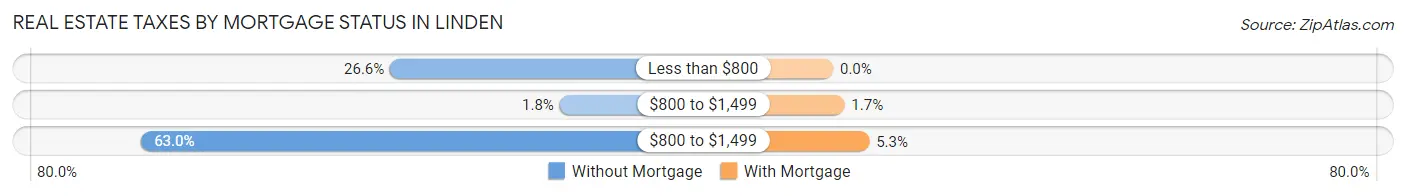
| Property Taxes | Without Mortgage | With Mortgage |
| Less than $800 | 117 (26.6%) | 0 (0.0%) |
| $800 to $1,499 | 8 (1.8%) | 16 (1.7%) |
| $800 to $1,499 | 277 (62.9%) | 51 (5.3%) |
| Total | 440 (100.0%) | 965 (100.0%) |
Health & Disability in Linden
Health Insurance Coverage by Age in Linden
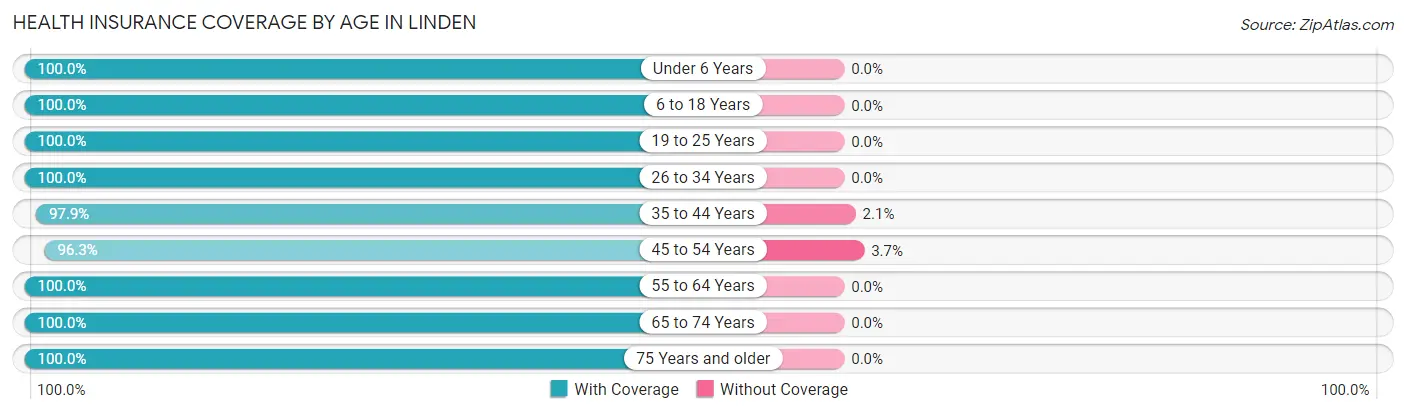
| Age Bracket | With Coverage | Without Coverage |
| Under 6 Years | 288 (100.0%) | 0 (0.0%) |
| 6 to 18 Years | 817 (100.0%) | 0 (0.0%) |
| 19 to 25 Years | 300 (100.0%) | 0 (0.0%) |
| 26 to 34 Years | 485 (100.0%) | 0 (0.0%) |
| 35 to 44 Years | 370 (97.9%) | 8 (2.1%) |
| 45 to 54 Years | 701 (96.3%) | 27 (3.7%) |
| 55 to 64 Years | 335 (100.0%) | 0 (0.0%) |
| 65 to 74 Years | 375 (100.0%) | 0 (0.0%) |
| 75 Years and older | 407 (100.0%) | 0 (0.0%) |
| Total | 4,078 (99.2%) | 35 (0.9%) |
Health Insurance Coverage by Citizenship Status in Linden
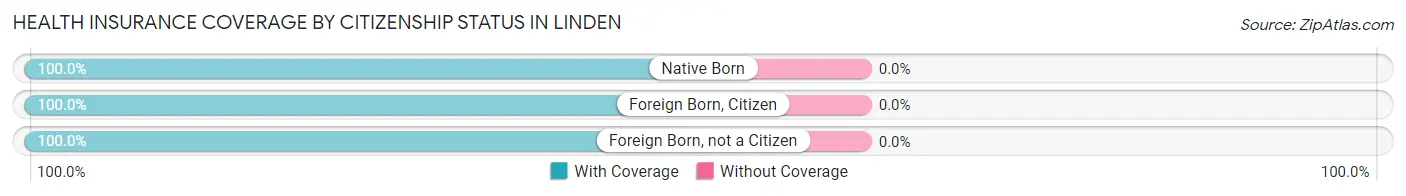
| Citizenship Status | With Coverage | Without Coverage |
| Native Born | 288 (100.0%) | 0 (0.0%) |
| Foreign Born, Citizen | 817 (100.0%) | 0 (0.0%) |
| Foreign Born, not a Citizen | 300 (100.0%) | 0 (0.0%) |
Health Insurance Coverage by Household Income in Linden
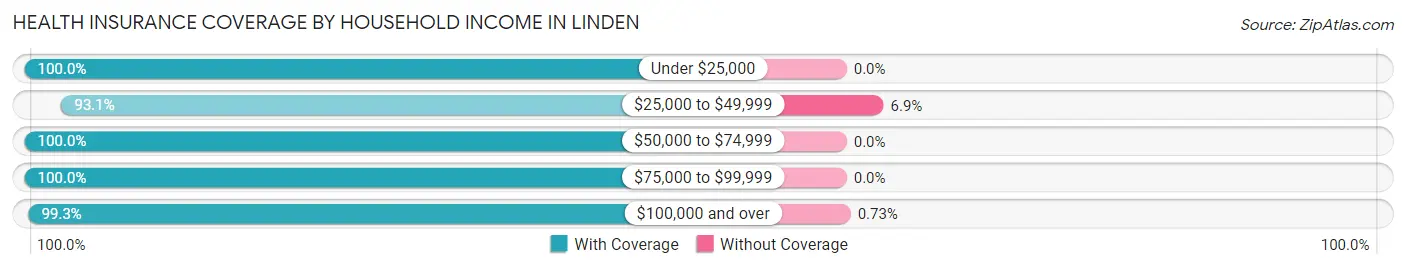
| Household Income | With Coverage | Without Coverage |
| Under $25,000 | 118 (100.0%) | 0 (0.0%) |
| $25,000 to $49,999 | 284 (93.1%) | 21 (6.9%) |
| $50,000 to $74,999 | 1,090 (100.0%) | 0 (0.0%) |
| $75,000 to $99,999 | 614 (100.0%) | 0 (0.0%) |
| $100,000 and over | 1,895 (99.3%) | 14 (0.7%) |
Public vs Private Health Insurance Coverage by Age in Linden
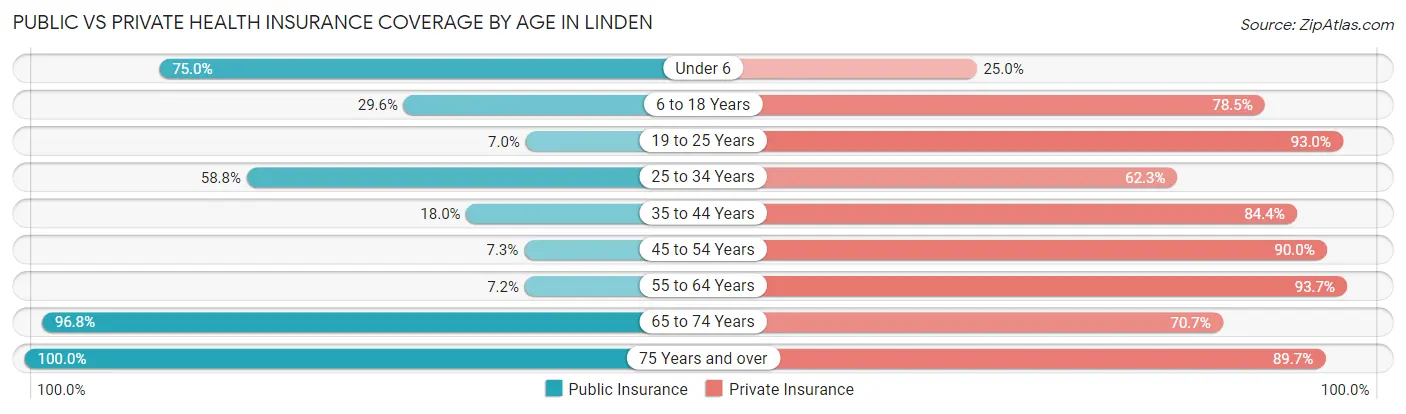
| Age Bracket | Public Insurance | Private Insurance |
| Under 6 | 216 (75.0%) | 72 (25.0%) |
| 6 to 18 Years | 242 (29.6%) | 641 (78.5%) |
| 19 to 25 Years | 21 (7.0%) | 279 (93.0%) |
| 25 to 34 Years | 285 (58.8%) | 302 (62.3%) |
| 35 to 44 Years | 68 (18.0%) | 319 (84.4%) |
| 45 to 54 Years | 53 (7.3%) | 655 (90.0%) |
| 55 to 64 Years | 24 (7.2%) | 314 (93.7%) |
| 65 to 74 Years | 363 (96.8%) | 265 (70.7%) |
| 75 Years and over | 407 (100.0%) | 365 (89.7%) |
| Total | 1,679 (40.8%) | 3,212 (78.1%) |
Disability Status by Sex by Age in Linden
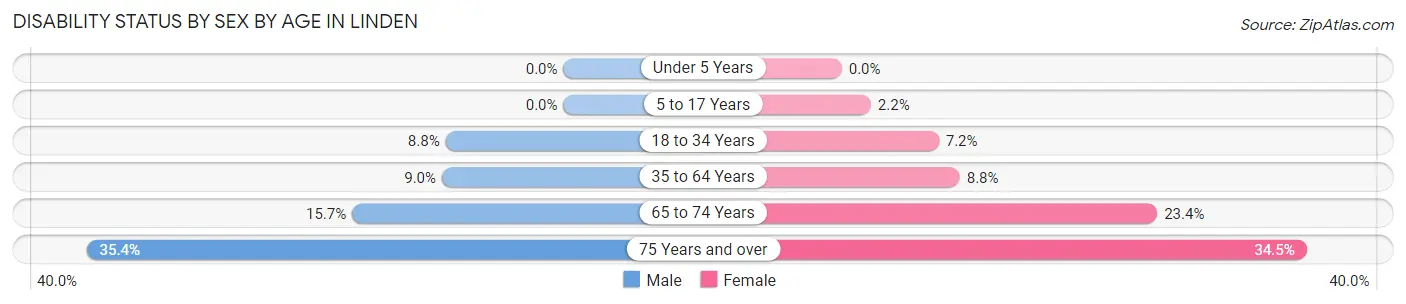
| Age Bracket | Male | Female |
| Under 5 Years | 0 (0.0%) | 0 (0.0%) |
| 5 to 17 Years | 0 (0.0%) | 10 (2.2%) |
| 18 to 34 Years | 35 (8.7%) | 29 (7.2%) |
| 35 to 64 Years | 60 (9.0%) | 68 (8.8%) |
| 65 to 74 Years | 24 (15.7%) | 52 (23.4%) |
| 75 Years and over | 63 (35.4%) | 79 (34.5%) |
Disability Class by Sex by Age in Linden
Disability Class: Hearing Difficulty
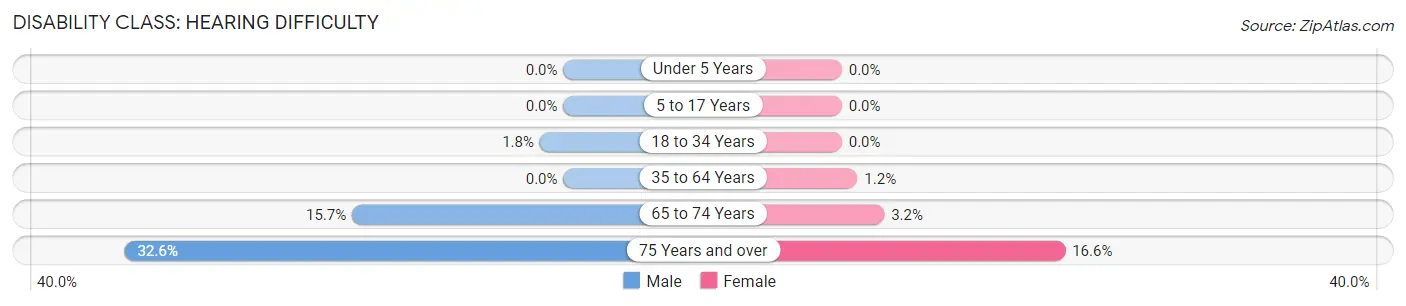
| Age Bracket | Male | Female |
| Under 5 Years | 0 (0.0%) | 0 (0.0%) |
| 5 to 17 Years | 0 (0.0%) | 0 (0.0%) |
| 18 to 34 Years | 7 (1.8%) | 0 (0.0%) |
| 35 to 64 Years | 0 (0.0%) | 9 (1.2%) |
| 65 to 74 Years | 24 (15.7%) | 7 (3.2%) |
| 75 Years and over | 58 (32.6%) | 38 (16.6%) |
Disability Class: Vision Difficulty
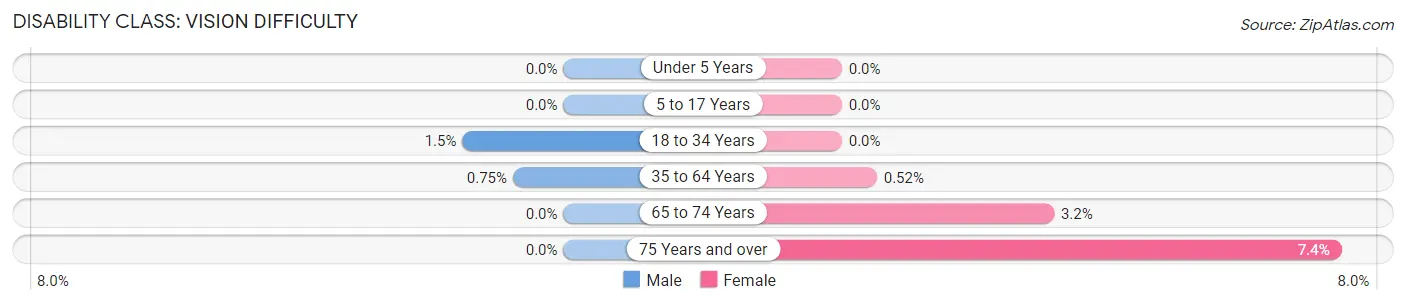
| Age Bracket | Male | Female |
| Under 5 Years | 0 (0.0%) | 0 (0.0%) |
| 5 to 17 Years | 0 (0.0%) | 0 (0.0%) |
| 18 to 34 Years | 6 (1.5%) | 0 (0.0%) |
| 35 to 64 Years | 5 (0.7%) | 4 (0.5%) |
| 65 to 74 Years | 0 (0.0%) | 7 (3.2%) |
| 75 Years and over | 0 (0.0%) | 17 (7.4%) |
Disability Class: Cognitive Difficulty
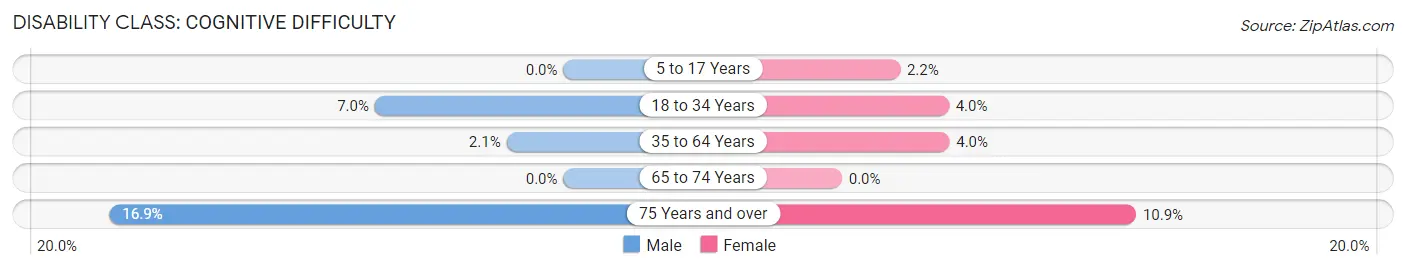
| Age Bracket | Male | Female |
| 5 to 17 Years | 0 (0.0%) | 10 (2.2%) |
| 18 to 34 Years | 28 (7.0%) | 16 (4.0%) |
| 35 to 64 Years | 14 (2.1%) | 31 (4.0%) |
| 65 to 74 Years | 0 (0.0%) | 0 (0.0%) |
| 75 Years and over | 30 (16.9%) | 25 (10.9%) |
Disability Class: Ambulatory Difficulty
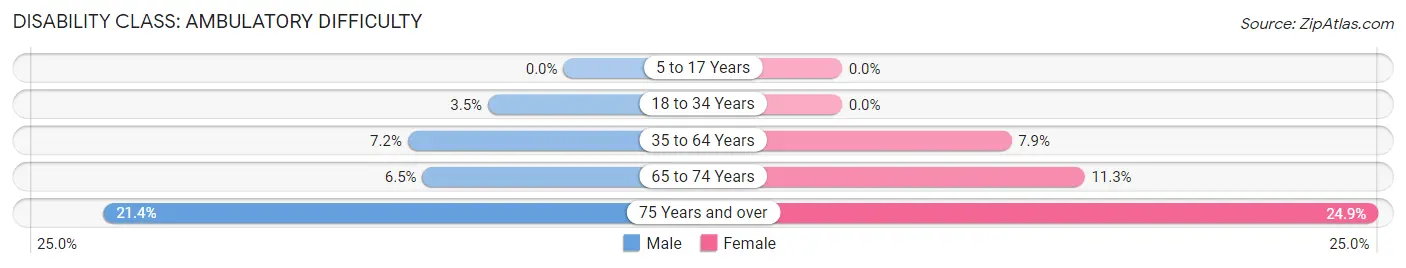
| Age Bracket | Male | Female |
| 5 to 17 Years | 0 (0.0%) | 0 (0.0%) |
| 18 to 34 Years | 14 (3.5%) | 0 (0.0%) |
| 35 to 64 Years | 48 (7.2%) | 61 (7.9%) |
| 65 to 74 Years | 10 (6.5%) | 25 (11.3%) |
| 75 Years and over | 38 (21.3%) | 57 (24.9%) |
Disability Class: Self-Care Difficulty
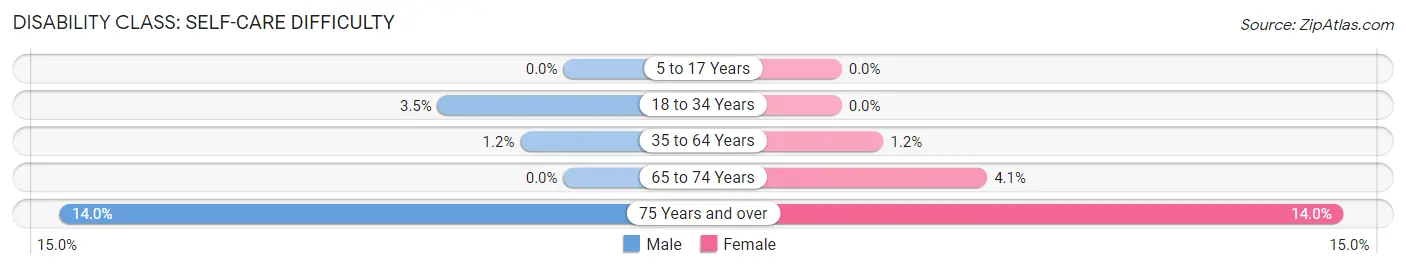
| Age Bracket | Male | Female |
| 5 to 17 Years | 0 (0.0%) | 0 (0.0%) |
| 18 to 34 Years | 14 (3.5%) | 0 (0.0%) |
| 35 to 64 Years | 8 (1.2%) | 9 (1.2%) |
| 65 to 74 Years | 0 (0.0%) | 9 (4.1%) |
| 75 Years and over | 25 (14.0%) | 32 (14.0%) |
Technology Access in Linden
Computing Device Access in Linden
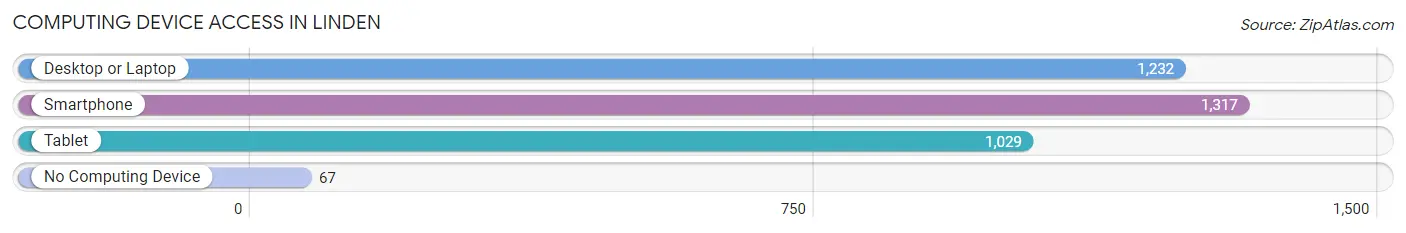
| Device Type | # Households | % Households |
| Desktop or Laptop | 1,232 | 82.1% |
| Smartphone | 1,317 | 87.7% |
| Tablet | 1,029 | 68.5% |
| No Computing Device | 67 | 4.5% |
| Total | 1,501 | 100.0% |
Internet Access in Linden
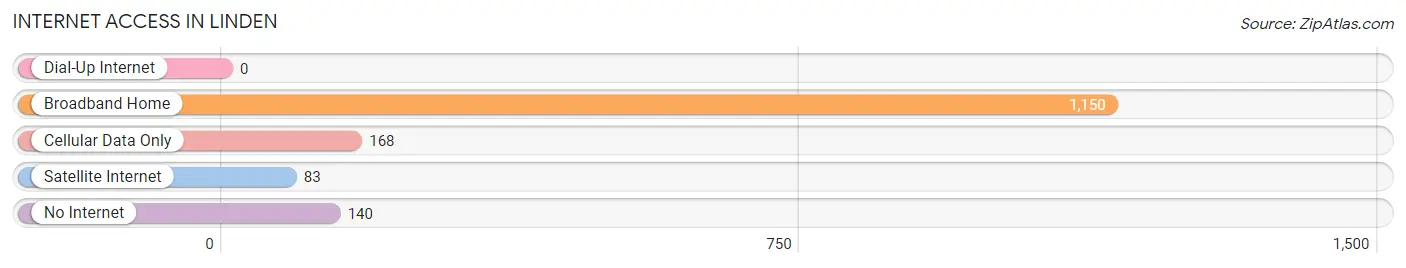
| Internet Type | # Households | % Households |
| Dial-Up Internet | 0 | 0.0% |
| Broadband Home | 1,150 | 76.6% |
| Cellular Data Only | 168 | 11.2% |
| Satellite Internet | 83 | 5.5% |
| No Internet | 140 | 9.3% |
| Total | 1,501 | 100.0% |
Linden Summary
Linden, Michigan is a small city located in Genesee County, Michigan. It is situated about 25 miles northwest of Flint and about 60 miles northwest of Detroit. The city has a population of about 3,500 people and is part of the Flint Metropolitan Statistical Area.
History
The area that is now Linden was first settled in 1836 by a group of settlers from New York. The settlement was originally called “Newburg”, but was later changed to “Linden” in 1845. The name was chosen in honor of the linden trees that grew in the area. The city was officially incorporated in 1871.
In the late 19th century, Linden was a thriving agricultural community. The city was home to several grain mills, a sawmill, a cider mill, and a brickyard. The city also had a thriving lumber industry, which was the main source of employment for many of the city’s residents.
In the early 20th century, the city’s economy shifted from agriculture to manufacturing. The city was home to several factories, including a paper mill, a furniture factory, and a canning factory. The city also had a thriving automotive industry, which was the main source of employment for many of the city’s residents.
Geography
Linden is located in Genesee County, Michigan. The city is situated about 25 miles northwest of Flint and about 60 miles northwest of Detroit. The city is located on the Flint River, which flows through the city. The city is surrounded by farmland and is home to several parks and recreational areas.
Economy
The economy of Linden is largely based on manufacturing. The city is home to several factories, including a paper mill, a furniture factory, and a canning factory. The city also has a thriving automotive industry, which is the main source of employment for many of the city’s residents.
The city is also home to several small businesses, including restaurants, retail stores, and service providers. The city is also home to several educational institutions, including a community college and a technical school.
Demographics
As of the 2010 census, the population of Linden was 3,521. The racial makeup of the city was 95.3% White, 1.2% African American, 0.3% Native American, 0.7% Asian, 0.1% Pacific Islander, 0.7% from other races, and 1.9% from two or more races. Hispanic or Latino of any race were 2.2% of the population.
The median household income in Linden was $41,944, and the median family income was $50,917. The per capita income in Linden was $20,845. About 11.2% of the population was below the poverty line.
Conclusion
Linden, Michigan is a small city located in Genesee County, Michigan. It is situated about 25 miles northwest of Flint and about 60 miles northwest of Detroit. The city has a population of about 3,500 people and is part of the Flint Metropolitan Statistical Area. The economy of Linden is largely based on manufacturing, and the city is home to several factories, small businesses, and educational institutions. The racial makeup of the city is predominantly White, with a small percentage of African American, Native American, Asian, and Pacific Islander residents. The median household income in Linden is $41,944, and the per capita income is $20,845.
Common Questions
What is Per Capita Income in Linden?
Per Capita income in Linden is $39,188.
What is the Median Family Income in Linden?
Median Family Income in Linden is $97,554.
What is the Median Household income in Linden?
Median Household Income in Linden is $85,917.
What is Income or Wage Gap in Linden?
Income or Wage Gap in Linden is 13.6%.
Women in Linden earn 86.4 cents for every dollar earned by a man.
What is Inequality or Gini Index in Linden?
Inequality or Gini Index in Linden is 0.40.
What is the Total Population of Linden?
Total Population of Linden is 4,125.
What is the Total Male Population of Linden?
Total Male Population of Linden is 1,764.
What is the Total Female Population of Linden?
Total Female Population of Linden is 2,361.
What is the Ratio of Males per 100 Females in Linden?
There are 74.71 Males per 100 Females in Linden.
What is the Ratio of Females per 100 Males in Linden?
There are 133.84 Females per 100 Males in Linden.
What is the Median Population Age in Linden?
Median Population Age in Linden is 40.0 Years.
What is the Average Family Size in Linden
Average Family Size in Linden is 3.3 People.
What is the Average Household Size in Linden
Average Household Size in Linden is 2.7 People.
How Large is the Labor Force in Linden?
There are 1,860 People in the Labor Forcein in Linden.
What is the Percentage of People in the Labor Force in Linden?
57.6% of People are in the Labor Force in Linden.
What is the Unemployment Rate in Linden?
Unemployment Rate in Linden is 9.7%.