Cities with the Lowest Poverty Level Among Families in Michigan
RELATED REPORTS & OPTIONS
Lowest Family Poverty
Michigan
Compare Cities
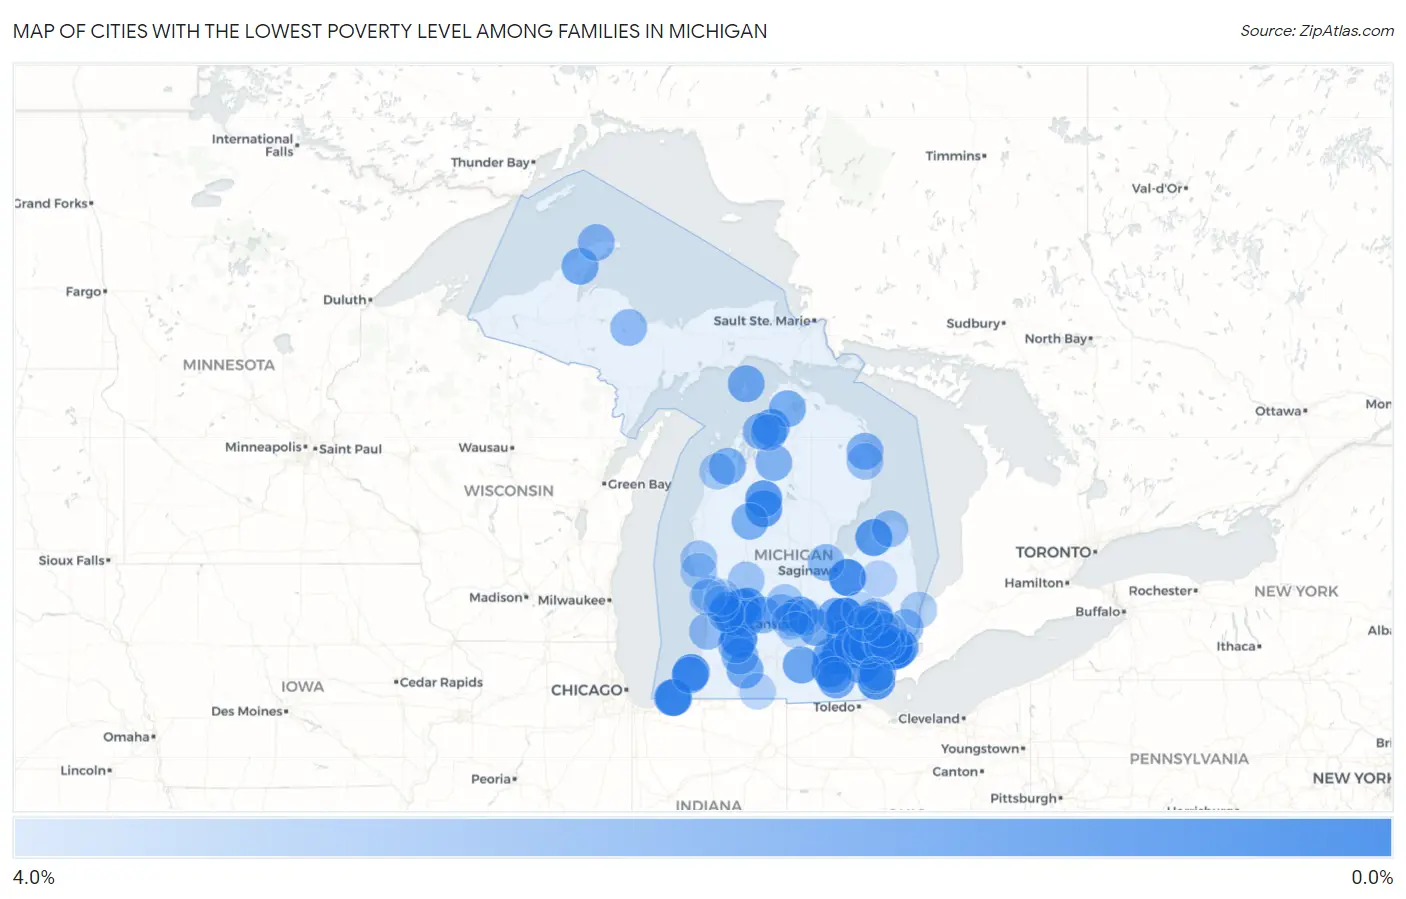
Map of Cities with the Lowest Poverty Level Among Families in Michigan
4.0%
0.0%
Cities with the Lowest Poverty Level Among Families in Michigan
| City | Family Poverty | vs State | vs National | |
| 1. | Linden | 0.31% | 8.8%(-8.47)#1 | 8.8%(-8.47)#23 |
| 2. | Bingham Farms | 0.31% | 8.8%(-8.47)#2 | 8.8%(-8.47)#24 |
| 3. | Berkley | 0.54% | 8.8%(-8.24)#3 | 8.8%(-8.24)#109 |
| 4. | Dexter | 0.56% | 8.8%(-8.22)#4 | 8.8%(-8.22)#129 |
| 5. | Grosse Pointe | 0.60% | 8.8%(-8.18)#5 | 8.8%(-8.18)#156 |
| 6. | Frankenmuth | 0.65% | 8.8%(-8.13)#6 | 8.8%(-8.13)#184 |
| 7. | Martin | 0.68% | 8.8%(-8.11)#7 | 8.8%(-8.11)#210 |
| 8. | Wolverine Lake | 0.84% | 8.8%(-7.95)#8 | 8.8%(-7.95)#358 |
| 9. | Plymouth | 0.88% | 8.8%(-7.91)#9 | 8.8%(-7.91)#396 |
| 10. | Belleville | 0.89% | 8.8%(-7.90)#10 | 8.8%(-7.89)#406 |
| 11. | Sylvan Lake | 0.89% | 8.8%(-7.89)#11 | 8.8%(-7.89)#414 |
| 12. | East Grand Rapids | 0.93% | 8.8%(-7.85)#12 | 8.8%(-7.85)#459 |
| 13. | Estral Beach | 0.96% | 8.8%(-7.82)#13 | 8.8%(-7.82)#483 |
| 14. | Michiana | 0.96% | 8.8%(-7.82)#14 | 8.8%(-7.82)#487 |
| 15. | St Joseph | 1.0% | 8.8%(-7.76)#15 | 8.8%(-7.76)#546 |
| 16. | Manchester | 1.0% | 8.8%(-7.74)#16 | 8.8%(-7.74)#572 |
| 17. | Byron Center | 1.1% | 8.8%(-7.71)#17 | 8.8%(-7.71)#628 |
| 18. | Pigeon | 1.1% | 8.8%(-7.69)#18 | 8.8%(-7.69)#640 |
| 19. | Brighton | 1.1% | 8.8%(-7.66)#19 | 8.8%(-7.66)#669 |
| 20. | Pleasant Ridge | 1.2% | 8.8%(-7.62)#20 | 8.8%(-7.62)#711 |
| 21. | Mcbain | 1.2% | 8.8%(-7.61)#21 | 8.8%(-7.61)#720 |
| 22. | Lake Orion | 1.2% | 8.8%(-7.60)#22 | 8.8%(-7.60)#738 |
| 23. | Dewitt | 1.2% | 8.8%(-7.57)#23 | 8.8%(-7.57)#778 |
| 24. | Lake City | 1.2% | 8.8%(-7.55)#24 | 8.8%(-7.55)#809 |
| 25. | Huntington Woods | 1.2% | 8.8%(-7.54)#25 | 8.8%(-7.54)#817 |
| 26. | Village Of Grosse Pointe Shores | 1.3% | 8.8%(-7.43)#26 | 8.8%(-7.43)#946 |
| 27. | Forest Hills | 1.4% | 8.8%(-7.41)#27 | 8.8%(-7.41)#973 |
| 28. | Three Lakes | 1.4% | 8.8%(-7.39)#28 | 8.8%(-7.39)#993 |
| 29. | Advance | 1.4% | 8.8%(-7.37)#29 | 8.8%(-7.37)#1,018 |
| 30. | Chelsea | 1.4% | 8.8%(-7.34)#30 | 8.8%(-7.34)#1,064 |
| 31. | Spring Arbor | 1.5% | 8.8%(-7.26)#31 | 8.8%(-7.26)#1,181 |
| 32. | Beverly Hills | 1.6% | 8.8%(-7.20)#32 | 8.8%(-7.20)#1,262 |
| 33. | Williamston | 1.6% | 8.8%(-7.15)#33 | 8.8%(-7.15)#1,332 |
| 34. | St James | 1.6% | 8.8%(-7.14)#34 | 8.8%(-7.14)#1,344 |
| 35. | Vicksburg | 1.7% | 8.8%(-7.13)#35 | 8.8%(-7.13)#1,362 |
| 36. | Jenison | 1.7% | 8.8%(-7.12)#36 | 8.8%(-7.12)#1,374 |
| 37. | Tecumseh | 1.7% | 8.8%(-7.11)#37 | 8.8%(-7.11)#1,392 |
| 38. | Hubbell | 1.7% | 8.8%(-7.10)#38 | 8.8%(-7.10)#1,408 |
| 39. | Byron | 1.7% | 8.8%(-7.09)#39 | 8.8%(-7.09)#1,417 |
| 40. | South Lyon | 1.7% | 8.8%(-7.07)#40 | 8.8%(-7.07)#1,442 |
| 41. | Grand Beach | 1.7% | 8.8%(-7.04)#41 | 8.8%(-7.04)#1,498 |
| 42. | Grosse Pointe Park | 1.8% | 8.8%(-6.99)#42 | 8.8%(-6.99)#1,577 |
| 43. | Grosse Pointe Farms | 1.8% | 8.8%(-6.98)#43 | 8.8%(-6.97)#1,602 |
| 44. | Grosse Pointe Woods | 1.8% | 8.8%(-6.96)#44 | 8.8%(-6.96)#1,615 |
| 45. | Alanson | 1.8% | 8.8%(-6.94)#45 | 8.8%(-6.94)#1,650 |
| 46. | Lake Ann | 1.9% | 8.8%(-6.90)#46 | 8.8%(-6.89)#1,718 |
| 47. | Le Roy | 1.9% | 8.8%(-6.90)#47 | 8.8%(-6.89)#1,722 |
| 48. | Gibraltar | 1.9% | 8.8%(-6.87)#48 | 8.8%(-6.87)#1,756 |
| 49. | Northville | 1.9% | 8.8%(-6.86)#49 | 8.8%(-6.86)#1,789 |
| 50. | Shoreham | 1.9% | 8.8%(-6.85)#50 | 8.8%(-6.85)#1,798 |
| 51. | Ossineke | 2.0% | 8.8%(-6.80)#51 | 8.8%(-6.80)#1,872 |
| 52. | Clinton | 2.0% | 8.8%(-6.78)#52 | 8.8%(-6.78)#1,892 |
| 53. | Manistee Lake | 2.0% | 8.8%(-6.76)#53 | 8.8%(-6.76)#1,915 |
| 54. | Ellsworth | 2.1% | 8.8%(-6.68)#54 | 8.8%(-6.68)#2,041 |
| 55. | Bloomfield Hills | 2.1% | 8.8%(-6.66)#55 | 8.8%(-6.66)#2,067 |
| 56. | Lake Angelus | 2.1% | 8.8%(-6.66)#56 | 8.8%(-6.65)#2,073 |
| 57. | Eagle Harbor | 2.1% | 8.8%(-6.66)#57 | 8.8%(-6.65)#2,075 |
| 58. | Westwood | 2.2% | 8.8%(-6.57)#58 | 8.8%(-6.57)#2,190 |
| 59. | Livonia | 2.2% | 8.8%(-6.56)#59 | 8.8%(-6.56)#2,207 |
| 60. | Caledonia | 2.2% | 8.8%(-6.56)#60 | 8.8%(-6.56)#2,210 |
| 61. | Clarksville | 2.2% | 8.8%(-6.56)#61 | 8.8%(-6.56)#2,212 |
| 62. | Freeland | 2.3% | 8.8%(-6.53)#62 | 8.8%(-6.53)#2,275 |
| 63. | Farmington | 2.3% | 8.8%(-6.52)#63 | 8.8%(-6.52)#2,289 |
| 64. | New Baltimore | 2.3% | 8.8%(-6.47)#64 | 8.8%(-6.47)#2,360 |
| 65. | Otsego | 2.3% | 8.8%(-6.47)#65 | 8.8%(-6.47)#2,362 |
| 66. | East Jordan | 2.3% | 8.8%(-6.47)#66 | 8.8%(-6.47)#2,365 |
| 67. | Royal Oak | 2.3% | 8.8%(-6.44)#67 | 8.8%(-6.44)#2,417 |
| 68. | Douglas | 2.3% | 8.8%(-6.43)#68 | 8.8%(-6.43)#2,428 |
| 69. | Palmer | 2.4% | 8.8%(-6.43)#69 | 8.8%(-6.43)#2,433 |
| 70. | Bruce Crossing | 2.4% | 8.8%(-6.40)#70 | 8.8%(-6.40)#2,478 |
| 71. | Portland | 2.4% | 8.8%(-6.34)#71 | 8.8%(-6.34)#2,593 |
| 72. | Kinde | 2.5% | 8.8%(-6.28)#72 | 8.8%(-6.28)#2,686 |
| 73. | Lost Lake Woods | 2.5% | 8.8%(-6.24)#73 | 8.8%(-6.24)#2,746 |
| 74. | Hudsonville | 2.5% | 8.8%(-6.24)#74 | 8.8%(-6.24)#2,750 |
| 75. | Utica | 2.6% | 8.8%(-6.20)#75 | 8.8%(-6.20)#2,812 |
| 76. | Wacousta | 2.6% | 8.8%(-6.19)#76 | 8.8%(-6.19)#2,834 |
| 77. | Sand Lake | 2.6% | 8.8%(-6.17)#77 | 8.8%(-6.17)#2,863 |
| 78. | New Era | 2.6% | 8.8%(-6.17)#78 | 8.8%(-6.17)#2,871 |
| 79. | Novi | 2.6% | 8.8%(-6.16)#79 | 8.8%(-6.16)#2,877 |
| 80. | Clawson | 2.6% | 8.8%(-6.16)#80 | 8.8%(-6.16)#2,883 |
| 81. | Ferndale | 2.7% | 8.8%(-6.09)#81 | 8.8%(-6.09)#3,010 |
| 82. | Pewamo | 2.7% | 8.8%(-6.08)#82 | 8.8%(-6.08)#3,028 |
| 83. | Fruitport | 2.7% | 8.8%(-6.07)#83 | 8.8%(-6.07)#3,039 |
| 84. | Oxford | 2.8% | 8.8%(-6.03)#84 | 8.8%(-6.03)#3,115 |
| 85. | Honor | 2.8% | 8.8%(-6.01)#85 | 8.8%(-6.00)#3,166 |
| 86. | Montague | 2.8% | 8.8%(-5.98)#86 | 8.8%(-5.98)#3,203 |
| 87. | Marysville | 2.9% | 8.8%(-5.93)#87 | 8.8%(-5.92)#3,317 |
| 88. | Spring Lake | 2.9% | 8.8%(-5.90)#88 | 8.8%(-5.90)#3,347 |
| 89. | Center Line | 2.9% | 8.8%(-5.87)#89 | 8.8%(-5.87)#3,395 |
| 90. | Grand Ledge | 2.9% | 8.8%(-5.86)#90 | 8.8%(-5.86)#3,412 |
| 91. | Burr Oak | 3.0% | 8.8%(-5.74)#91 | 8.8%(-5.74)#3,626 |
| 92. | Rochester Hills | 3.1% | 8.8%(-5.67)#92 | 8.8%(-5.66)#3,747 |
| 93. | Coopersville | 3.1% | 8.8%(-5.66)#93 | 8.8%(-5.66)#3,757 |
| 94. | Clifford | 3.1% | 8.8%(-5.66)#94 | 8.8%(-5.66)#3,768 |
| 95. | Village Of Clarkston | 3.2% | 8.8%(-5.63)#95 | 8.8%(-5.63)#3,810 |
| 96. | Bath | 3.2% | 8.8%(-5.63)#96 | 8.8%(-5.63)#3,813 |
| 97. | Rockwood | 3.2% | 8.8%(-5.62)#97 | 8.8%(-5.62)#3,820 |
| 98. | Dimondale | 3.2% | 8.8%(-5.61)#98 | 8.8%(-5.61)#3,842 |
| 99. | Allendale | 3.2% | 8.8%(-5.60)#99 | 8.8%(-5.60)#3,854 |
| 100. | Goodrich | 3.2% | 8.8%(-5.58)#100 | 8.8%(-5.58)#3,883 |
Common Questions
What are the Top 10 Cities with the Lowest Poverty Level Among Families in Michigan?
Top 10 Cities with the Lowest Poverty Level Among Families in Michigan are:
#1
0.31%
#2
0.31%
#3
0.54%
#4
0.56%
#5
0.60%
#6
0.65%
#7
0.68%
#8
0.84%
#9
0.88%
#10
0.89%
What city has the Lowest Poverty Level Among Families in Michigan?
Linden has the Lowest Poverty Level Among Families in Michigan with 0.31%.
What is the Poverty Level Among Families in the State of Michigan?
Poverty Level Among Families in Michigan is 8.8%.
What is the Poverty Level Among Families in the United States?
Poverty Level Among Families in the United States is 8.8%.