Cities with the Highest Percentage of Households with Income Above $200,000 in Utah
RELATED REPORTS & OPTIONS
Household Income | $200k+
Utah
Compare Cities
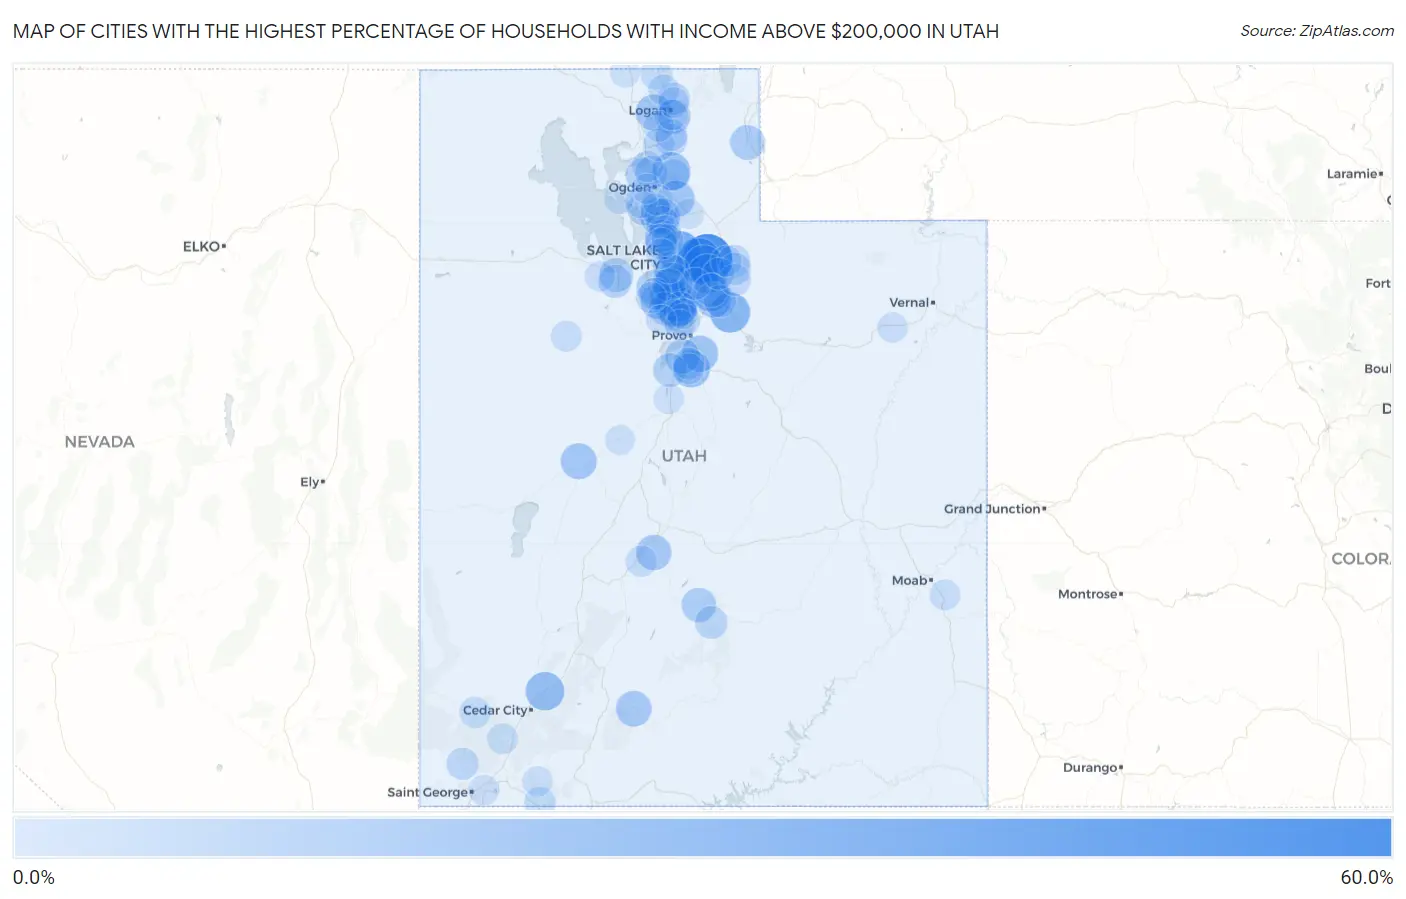
Map of Cities with the Highest Percentage of Households with Income Above $200,000 in Utah
0.0%
60.0%
Cities with the Highest Percentage of Households with Income Above $200,000 in Utah
| City | Households with Income > $200k | vs State | vs National | |
| 1. | Silver Summit | 56.8% | 11.0%(+45.8)#1 | 11.4%(+45.4)#250 |
| 2. | Hobble Creek | 53.2% | 11.0%(+42.2)#2 | 11.4%(+41.8)#355 |
| 3. | Summit Park | 42.9% | 11.0%(+31.9)#3 | 11.4%(+31.5)#696 |
| 4. | Emigration Canyon | 40.3% | 11.0%(+29.3)#4 | 11.4%(+28.9)#810 |
| 5. | Highland | 37.4% | 11.0%(+26.4)#5 | 11.4%(+26.0)#988 |
| 6. | East Basin | 36.5% | 11.0%(+25.5)#6 | 11.4%(+25.1)#1,045 |
| 7. | Alpine | 35.0% | 11.0%(+24.0)#7 | 11.4%(+23.6)#1,172 |
| 8. | Independence | 34.5% | 11.0%(+23.5)#8 | 11.4%(+23.1)#1,215 |
| 9. | Snyderville | 33.7% | 11.0%(+22.7)#9 | 11.4%(+22.3)#1,271 |
| 10. | Park City | 32.7% | 11.0%(+21.7)#10 | 11.4%(+21.3)#1,362 |
| 11. | Summit | 30.5% | 11.0%(+19.5)#11 | 11.4%(+19.1)#1,572 |
| 12. | Midway | 29.2% | 11.0%(+18.2)#12 | 11.4%(+17.8)#1,686 |
| 13. | Wolf Creek | 29.2% | 11.0%(+18.2)#13 | 11.4%(+17.8)#1,687 |
| 14. | Granite | 28.5% | 11.0%(+17.5)#14 | 11.4%(+17.1)#1,777 |
| 15. | Woodland Hills | 27.9% | 11.0%(+16.9)#15 | 11.4%(+16.5)#1,832 |
| 16. | Draper | 27.0% | 11.0%(+16.0)#16 | 11.4%(+15.6)#1,934 |
| 17. | Mountain Green | 25.7% | 11.0%(+14.7)#17 | 11.4%(+14.3)#2,091 |
| 18. | Mapleton | 25.2% | 11.0%(+14.2)#18 | 11.4%(+13.8)#2,146 |
| 19. | Sundance | 25.0% | 11.0%(+14.0)#19 | 11.4%(+13.6)#2,171 |
| 20. | Mendon | 24.5% | 11.0%(+13.5)#20 | 11.4%(+13.1)#2,231 |
| 21. | Sutherland | 24.5% | 11.0%(+13.5)#21 | 11.4%(+13.1)#2,237 |
| 22. | Kaysville | 23.8% | 11.0%(+12.8)#22 | 11.4%(+12.4)#2,343 |
| 23. | Millville | 23.6% | 11.0%(+12.6)#23 | 11.4%(+12.2)#2,382 |
| 24. | Bryce Canyon City | 23.5% | 11.0%(+12.5)#24 | 11.4%(+12.1)#2,396 |
| 25. | Charleston | 23.2% | 11.0%(+12.2)#25 | 11.4%(+11.8)#2,457 |
| 26. | Fruit Heights | 23.1% | 11.0%(+12.1)#26 | 11.4%(+11.7)#2,463 |
| 27. | Glenwood | 23.1% | 11.0%(+12.1)#27 | 11.4%(+11.7)#2,472 |
| 28. | Bluffdale | 22.2% | 11.0%(+11.2)#28 | 11.4%(+10.8)#2,616 |
| 29. | Holladay | 22.1% | 11.0%(+11.1)#29 | 11.4%(+10.7)#2,631 |
| 30. | Woodruff | 21.6% | 11.0%(+10.6)#30 | 11.4%(+10.2)#2,741 |
| 31. | Cottonwood Heights | 21.3% | 11.0%(+10.3)#31 | 11.4%(+9.90)#2,785 |
| 32. | Benjamin | 21.3% | 11.0%(+10.3)#32 | 11.4%(+9.90)#2,801 |
| 33. | South Jordan | 21.1% | 11.0%(+10.1)#33 | 11.4%(+9.70)#2,826 |
| 34. | Lyman | 20.8% | 11.0%(+9.80)#34 | 11.4%(+9.40)#2,892 |
| 35. | Cedar Hills | 19.9% | 11.0%(+8.90)#35 | 11.4%(+8.50)#3,073 |
| 36. | Stansbury Park | 19.8% | 11.0%(+8.80)#36 | 11.4%(+8.40)#3,101 |
| 37. | Genola | 19.2% | 11.0%(+8.20)#37 | 11.4%(+7.80)#3,224 |
| 38. | Interlaken | 19.2% | 11.0%(+8.20)#38 | 11.4%(+7.80)#3,233 |
| 39. | Plain City | 18.9% | 11.0%(+7.90)#39 | 11.4%(+7.50)#3,297 |
| 40. | Sandy | 18.4% | 11.0%(+7.40)#40 | 11.4%(+7.00)#3,405 |
| 41. | West Bountiful | 18.2% | 11.0%(+7.20)#41 | 11.4%(+6.80)#3,447 |
| 42. | Erda | 17.9% | 11.0%(+6.90)#42 | 11.4%(+6.50)#3,521 |
| 43. | Lehi | 17.7% | 11.0%(+6.70)#43 | 11.4%(+6.30)#3,567 |
| 44. | Lindon | 17.3% | 11.0%(+6.30)#44 | 11.4%(+5.90)#3,654 |
| 45. | Pleasant View | 17.2% | 11.0%(+6.20)#45 | 11.4%(+5.80)#3,675 |
| 46. | Syracuse | 17.0% | 11.0%(+6.00)#46 | 11.4%(+5.60)#3,719 |
| 47. | Farmington | 17.0% | 11.0%(+6.00)#47 | 11.4%(+5.60)#3,722 |
| 48. | Oakley | 16.8% | 11.0%(+5.80)#48 | 11.4%(+5.40)#3,765 |
| 49. | Teasdale | 16.7% | 11.0%(+5.70)#49 | 11.4%(+5.30)#3,797 |
| 50. | Woods Cross | 16.6% | 11.0%(+5.60)#50 | 11.4%(+5.20)#3,822 |
| 51. | Daniel | 16.0% | 11.0%(+5.00)#51 | 11.4%(+4.60)#3,982 |
| 52. | Avon | 15.9% | 11.0%(+4.90)#52 | 11.4%(+4.50)#4,014 |
| 53. | Hyde Park | 15.8% | 11.0%(+4.80)#53 | 11.4%(+4.40)#4,032 |
| 54. | Alta | 15.7% | 11.0%(+4.70)#54 | 11.4%(+4.30)#4,076 |
| 55. | Riverton | 15.5% | 11.0%(+4.50)#55 | 11.4%(+4.10)#4,117 |
| 56. | Marion | 15.4% | 11.0%(+4.40)#56 | 11.4%(+4.00)#4,168 |
| 57. | Mantua | 15.3% | 11.0%(+4.30)#57 | 11.4%(+3.90)#4,213 |
| 58. | Dammeron Valley | 15.3% | 11.0%(+4.30)#58 | 11.4%(+3.90)#4,219 |
| 59. | Centerville | 15.1% | 11.0%(+4.10)#59 | 11.4%(+3.70)#4,255 |
| 60. | Millcreek | 15.0% | 11.0%(+4.00)#60 | 11.4%(+3.60)#4,282 |
| 61. | North Salt Lake | 15.0% | 11.0%(+4.00)#61 | 11.4%(+3.60)#4,286 |
| 62. | Salem | 15.0% | 11.0%(+4.00)#62 | 11.4%(+3.60)#4,292 |
| 63. | Francis | 15.0% | 11.0%(+4.00)#63 | 11.4%(+3.60)#4,296 |
| 64. | Hideout | 15.0% | 11.0%(+4.00)#64 | 11.4%(+3.60)#4,301 |
| 65. | Eden | 15.0% | 11.0%(+4.00)#65 | 11.4%(+3.60)#4,302 |
| 66. | Paradise | 14.6% | 11.0%(+3.60)#66 | 11.4%(+3.20)#4,440 |
| 67. | Bountiful | 14.4% | 11.0%(+3.40)#67 | 11.4%(+3.00)#4,485 |
| 68. | Cornish | 14.3% | 11.0%(+3.30)#68 | 11.4%(+2.90)#4,558 |
| 69. | West Point | 14.0% | 11.0%(+3.00)#69 | 11.4%(+2.60)#4,651 |
| 70. | Hildale | 13.9% | 11.0%(+2.90)#70 | 11.4%(+2.50)#4,707 |
| 71. | Newcastle | 13.8% | 11.0%(+2.80)#71 | 11.4%(+2.40)#4,752 |
| 72. | Central Valley | 13.7% | 11.0%(+2.70)#72 | 11.4%(+2.30)#4,803 |
| 73. | South Willard | 13.5% | 11.0%(+2.50)#73 | 11.4%(+2.10)#4,875 |
| 74. | Peoa | 13.2% | 11.0%(+2.20)#74 | 11.4%(+1.80)#5,002 |
| 75. | Amalga | 13.1% | 11.0%(+2.10)#75 | 11.4%(+1.70)#5,036 |
| 76. | South Weber | 13.0% | 11.0%(+2.00)#76 | 11.4%(+1.60)#5,057 |
| 77. | Elk Ridge | 12.9% | 11.0%(+1.90)#77 | 11.4%(+1.50)#5,108 |
| 78. | Wellsville | 12.8% | 11.0%(+1.80)#78 | 11.4%(+1.40)#5,162 |
| 79. | American Fork | 12.6% | 11.0%(+1.60)#79 | 11.4%(+1.20)#5,232 |
| 80. | North Logan | 12.6% | 11.0%(+1.60)#80 | 11.4%(+1.20)#5,239 |
| 81. | Vineyard | 12.5% | 11.0%(+1.50)#81 | 11.4%(+1.10)#5,270 |
| 82. | Spanish Valley | 12.5% | 11.0%(+1.50)#82 | 11.4%(+1.10)#5,296 |
| 83. | Herriman | 12.4% | 11.0%(+1.40)#83 | 11.4%(+1.000)#5,326 |
| 84. | Dugway | 12.4% | 11.0%(+1.40)#84 | 11.4%(+1.000)#5,362 |
| 85. | New Harmony | 12.4% | 11.0%(+1.40)#85 | 11.4%(+1.000)#5,364 |
| 86. | Grantsville | 12.2% | 11.0%(+1.20)#86 | 11.4%(+0.800)#5,414 |
| 87. | Providence | 12.1% | 11.0%(+1.10)#87 | 11.4%(+0.700)#5,476 |
| 88. | Pleasant Grove | 11.9% | 11.0%(+0.900)#88 | 11.4%(+0.500)#5,562 |
| 89. | Hooper | 11.7% | 11.0%(+0.700)#89 | 11.4%(+0.300)#5,665 |
| 90. | Fort Duchesne | 11.7% | 11.0%(+0.700)#90 | 11.4%(+0.300)#5,686 |
| 91. | Salt Lake City | 11.6% | 11.0%(+0.600)#91 | 11.4%(+0.200)#5,699 |
| 92. | Saratoga Springs | 11.5% | 11.0%(+0.500)#92 | 11.4%(+0.100)#5,742 |
| 93. | Washington | 11.5% | 11.0%(+0.500)#93 | 11.4%(+0.100)#5,743 |
| 94. | Layton | 11.4% | 11.0%(+0.400)#94 | 11.4%(=0.000)#5,788 |
| 95. | Morgan | 11.3% | 11.0%(+0.300)#95 | 11.4%(-0.100)#5,842 |
| 96. | Springdale | 11.3% | 11.0%(+0.300)#96 | 11.4%(-0.100)#5,857 |
| 97. | Mona | 11.2% | 11.0%(+0.200)#97 | 11.4%(-0.200)#5,884 |
| 98. | West Haven | 11.1% | 11.0%(+0.100)#98 | 11.4%(-0.300)#5,903 |
| 99. | Leamington | 11.1% | 11.0%(+0.100)#99 | 11.4%(-0.300)#5,938 |
| 100. | Portage | 11.1% | 11.0%(+0.100)#100 | 11.4%(-0.300)#5,942 |
Common Questions
What are the Top 10 Cities with the Highest Percentage of Households with Income Above $200,000 in Utah?
Top 10 Cities with the Highest Percentage of Households with Income Above $200,000 in Utah are:
#1
56.8%
#2
42.9%
#3
40.3%
#4
37.4%
#5
35.0%
#6
34.5%
#7
33.7%
#8
32.7%
#9
30.5%
#10
29.2%
What city has the Highest Percentage of Households with Income Above $200,000 in Utah?
Silver Summit has the Highest Percentage of Households with Income Above $200,000 in Utah with 56.8%.
What is the Percentage of Households with Income Above $200,000 in the State of Utah?
Percentage of Households with Income Above $200,000 in Utah is 11.0%.
What is the Percentage of Households with Income Above $200,000 in the United States?
Percentage of Households with Income Above $200,000 in the United States is 11.4%.