Pleasant Ridge, MI Map & Demographics
Pleasant Ridge Map
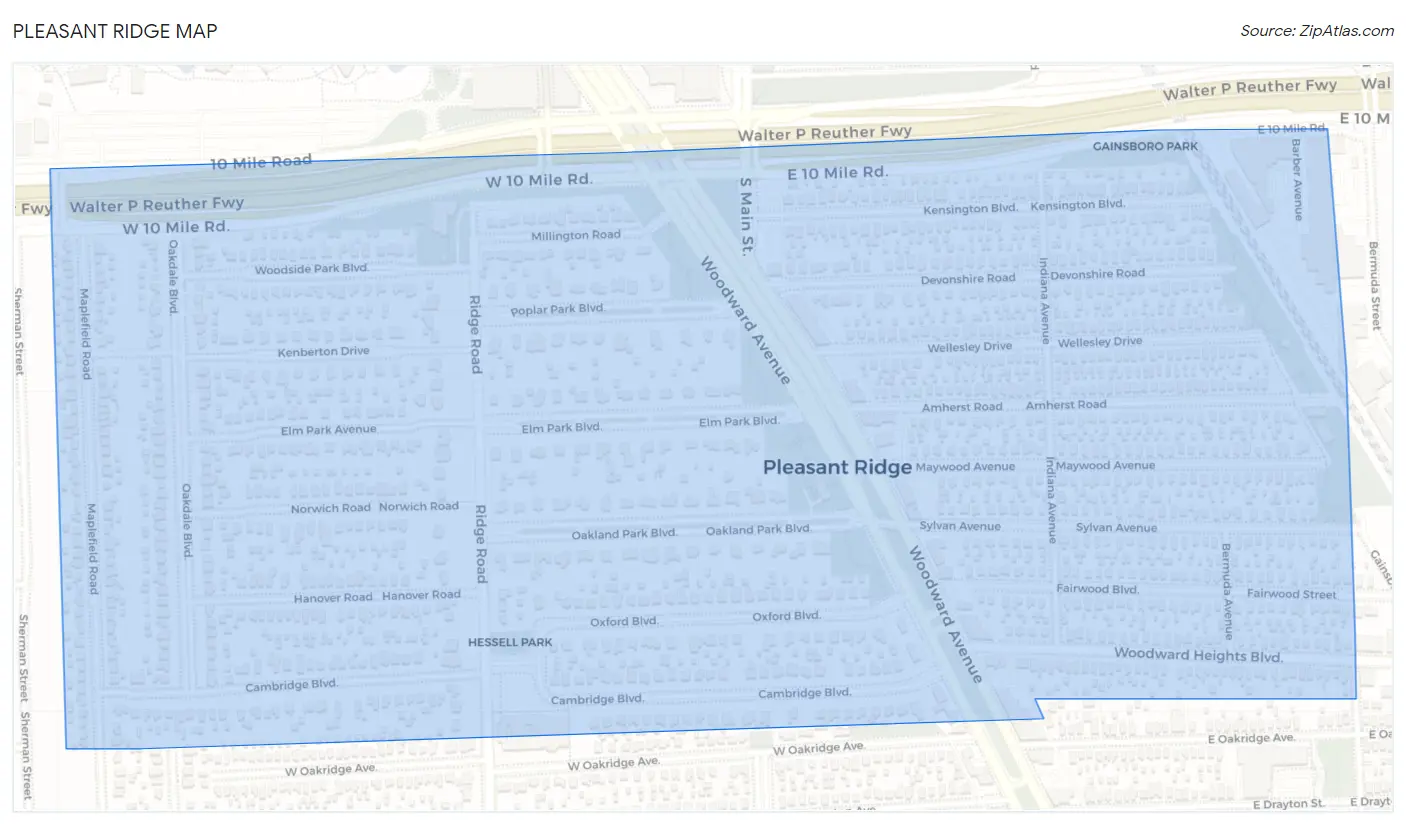
Pleasant Ridge Overview
$84,370
PER CAPITA INCOME
$195,278
AVG FAMILY INCOME
$164,861
AVG HOUSEHOLD INCOME
25.9%
WAGE / INCOME GAP [ % ]
74.1¢/ $1
WAGE / INCOME GAP [ $ ]
0.39
INEQUALITY / GINI INDEX
2,609
TOTAL POPULATION
1,288
MALE POPULATION
1,321
FEMALE POPULATION
97.50
MALES / 100 FEMALES
102.56
FEMALES / 100 MALES
43.9
MEDIAN AGE
3.0
AVG FAMILY SIZE
2.3
AVG HOUSEHOLD SIZE
1,528
LABOR FORCE [ PEOPLE ]
72.0%
PERCENT IN LABOR FORCE
6.7%
UNEMPLOYMENT RATE
Pleasant Ridge Zip Codes
Pleasant Ridge Area Codes
Income in Pleasant Ridge
Income Overview in Pleasant Ridge
Per Capita Income in Pleasant Ridge is $84,370, while median incomes of families and households are $195,278 and $164,861 respectively.
| Characteristic | Number | Measure |
| Per Capita Income | 2,609 | $84,370 |
| Median Family Income | 688 | $195,278 |
| Mean Family Income | 688 | $229,018 |
| Median Household Income | 1,149 | $164,861 |
| Mean Household Income | 1,149 | $190,393 |
| Income Deficit | 688 | $0 |
| Wage / Income Gap (%) | 2,609 | 25.93% |
| Wage / Income Gap ($) | 2,609 | 74.07¢ per $1 |
| Gini / Inequality Index | 2,609 | 0.39 |
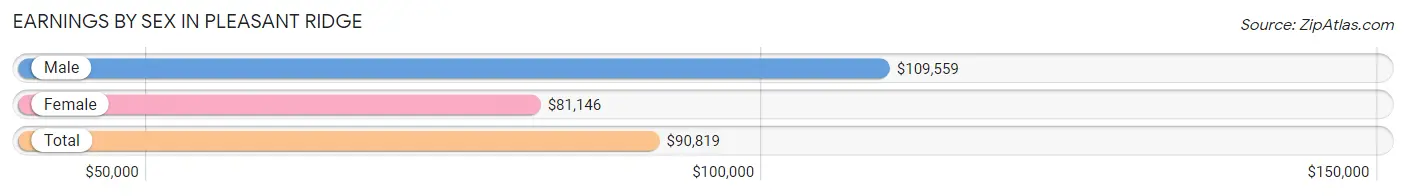
Earnings by Sex in Pleasant Ridge
Average Earnings in Pleasant Ridge are $90,819, $109,559 for men and $81,146 for women, a difference of 25.9%.
| Sex | Number | Average Earnings |
| Male | 836 (53.3%) | $109,559 |
| Female | 733 (46.7%) | $81,146 |
| Total | 1,569 (100.0%) | $90,819 |
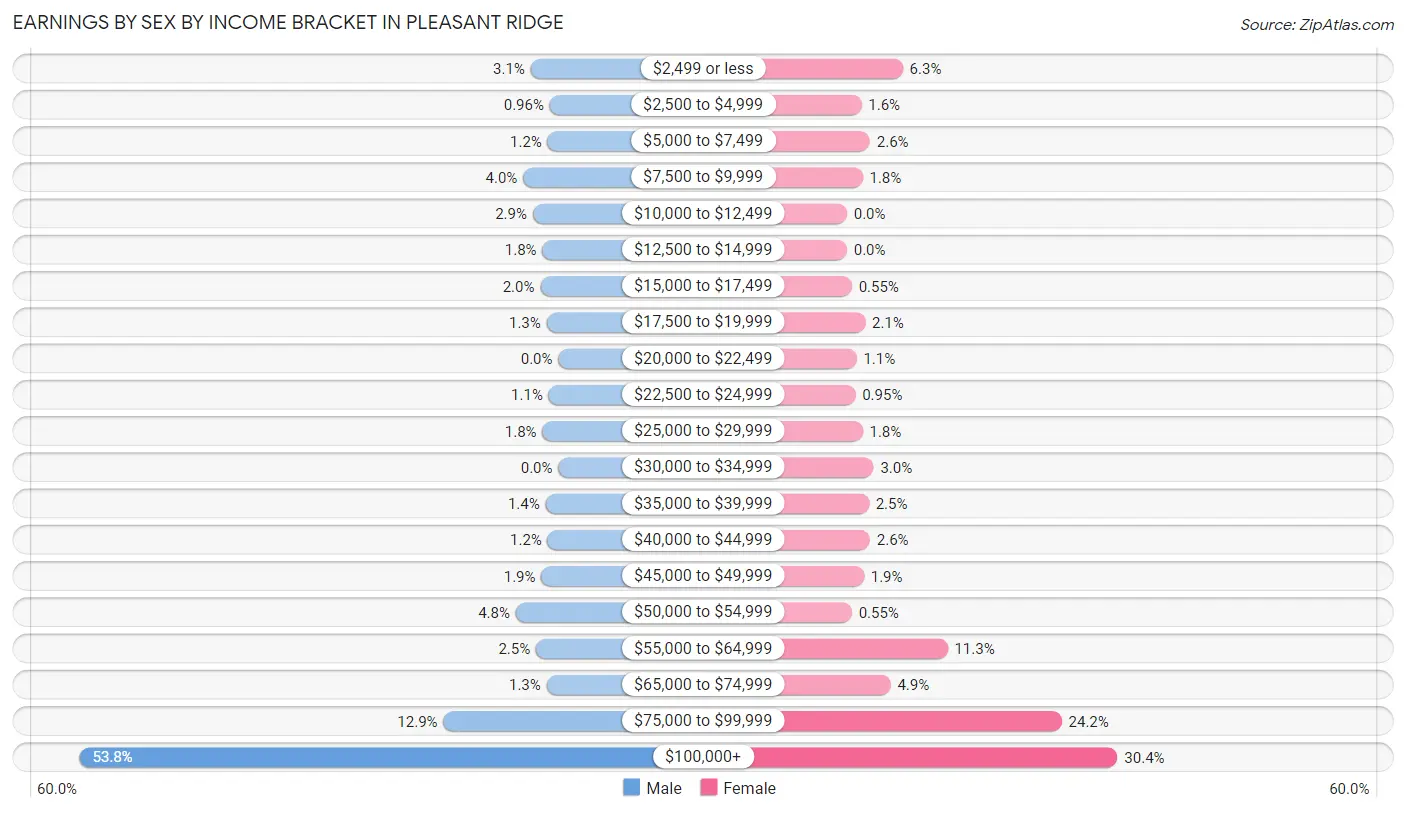
Earnings by Sex by Income Bracket in Pleasant Ridge
The most common earnings brackets in Pleasant Ridge are $100,000+ for men (450 | 53.8%) and $100,000+ for women (223 | 30.4%).
| Income | Male | Female |
| $2,499 or less | 26 (3.1%) | 46 (6.3%) |
| $2,500 to $4,999 | 8 (1.0%) | 12 (1.6%) |
| $5,000 to $7,499 | 10 (1.2%) | 19 (2.6%) |
| $7,500 to $9,999 | 33 (4.0%) | 13 (1.8%) |
| $10,000 to $12,499 | 24 (2.9%) | 0 (0.0%) |
| $12,500 to $14,999 | 15 (1.8%) | 0 (0.0%) |
| $15,000 to $17,499 | 17 (2.0%) | 4 (0.5%) |
| $17,500 to $19,999 | 11 (1.3%) | 15 (2.1%) |
| $20,000 to $22,499 | 0 (0.0%) | 8 (1.1%) |
| $22,500 to $24,999 | 9 (1.1%) | 7 (0.9%) |
| $25,000 to $29,999 | 15 (1.8%) | 13 (1.8%) |
| $30,000 to $34,999 | 0 (0.0%) | 22 (3.0%) |
| $35,000 to $39,999 | 12 (1.4%) | 18 (2.5%) |
| $40,000 to $44,999 | 10 (1.2%) | 19 (2.6%) |
| $45,000 to $49,999 | 16 (1.9%) | 14 (1.9%) |
| $50,000 to $54,999 | 40 (4.8%) | 4 (0.5%) |
| $55,000 to $64,999 | 21 (2.5%) | 83 (11.3%) |
| $65,000 to $74,999 | 11 (1.3%) | 36 (4.9%) |
| $75,000 to $99,999 | 108 (12.9%) | 177 (24.1%) |
| $100,000+ | 450 (53.8%) | 223 (30.4%) |
| Total | 836 (100.0%) | 733 (100.0%) |
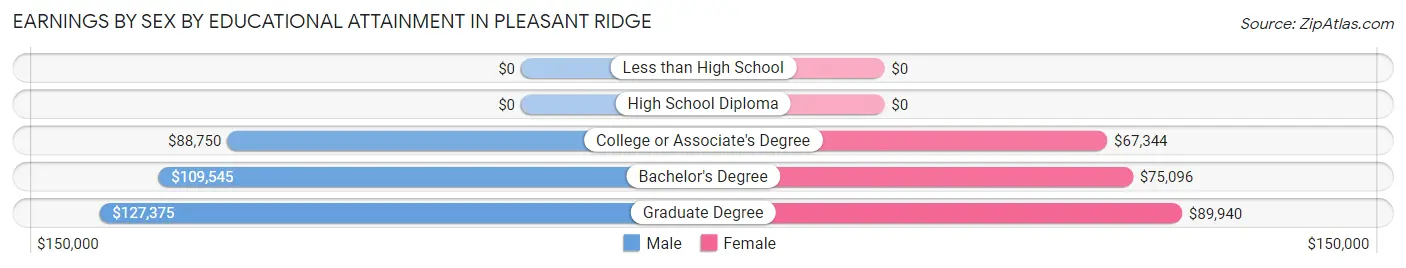
Earnings by Sex by Educational Attainment in Pleasant Ridge
Average earnings in Pleasant Ridge are $114,167 for men and $83,500 for women, a difference of 26.9%. Men with an educational attainment of graduate degree enjoy the highest average annual earnings of $127,375, while those with college or associate's degree education earn the least with $88,750. Women with an educational attainment of graduate degree earn the most with the average annual earnings of $89,940, while those with college or associate's degree education have the smallest earnings of $67,344.
| Educational Attainment | Male Income | Female Income |
| Less than High School | - | - |
| High School Diploma | - | - |
| College or Associate's Degree | $88,750 | $67,344 |
| Bachelor's Degree | $109,545 | $75,096 |
| Graduate Degree | $127,375 | $89,940 |
| Total | $114,167 | $83,500 |
Family Income in Pleasant Ridge
Family Income Brackets in Pleasant Ridge
According to the Pleasant Ridge family income data, there are 328 families falling into the $200,000+ income range, which is the most common income bracket and makes up 47.7% of all families.
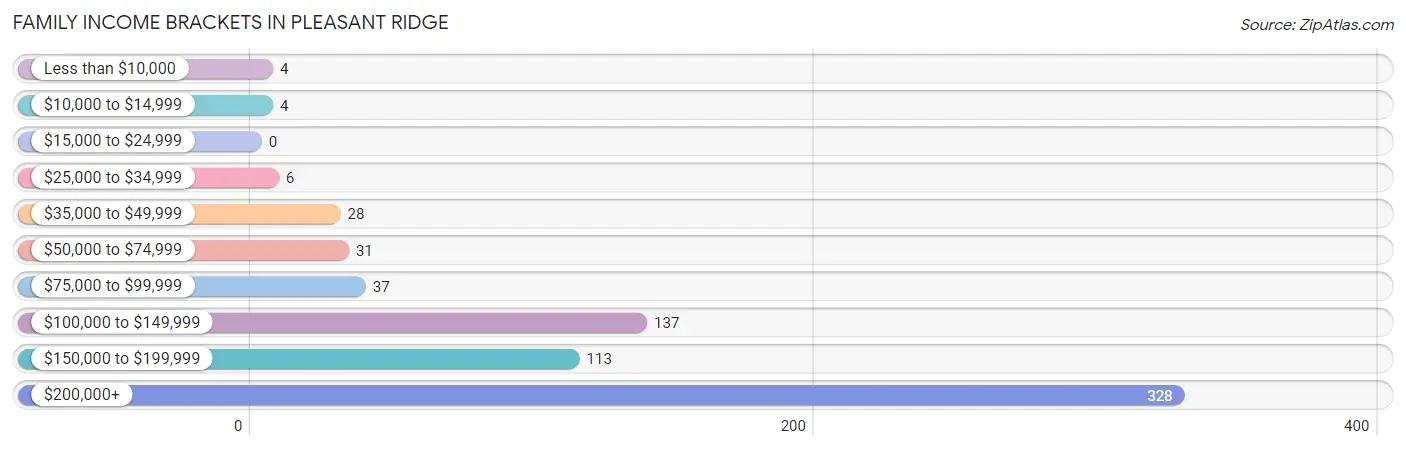
| Income Bracket | # Families | % Families |
| Less than $10,000 | 4 | 0.6% |
| $10,000 to $14,999 | 4 | 0.6% |
| $15,000 to $24,999 | 0 | 0.0% |
| $25,000 to $34,999 | 6 | 0.9% |
| $35,000 to $49,999 | 28 | 4.1% |
| $50,000 to $74,999 | 31 | 4.5% |
| $75,000 to $99,999 | 37 | 5.4% |
| $100,000 to $149,999 | 137 | 19.9% |
| $150,000 to $199,999 | 113 | 16.4% |
| $200,000+ | 328 | 47.7% |
Family Income by Famaliy Size in Pleasant Ridge
4-person families (157 | 22.8%) account for the highest median family income in Pleasant Ridge with $243,393 per family, while 2-person families (350 | 50.9%) have the highest median income of $72,857 per family member.

| Income Bracket | # Families | Median Income |
| 2-Person Families | 350 (50.9%) | $145,714 |
| 3-Person Families | 131 (19.0%) | $206,964 |
| 4-Person Families | 157 (22.8%) | $243,393 |
| 5-Person Families | 29 (4.2%) | $104,844 |
| 6-Person Families | 21 (3.0%) | $164,306 |
| 7+ Person Families | 0 (0.0%) | $0 |
| Total | 688 (100.0%) | $195,278 |
Family Income by Number of Earners in Pleasant Ridge
The median family income in Pleasant Ridge is $195,278, with families comprising 3+ earners (48) having the highest median family income of $250,001, while families with no earners (103) have the lowest median family income of $110,313, accounting for 7.0% and 15.0% of families, respectively.
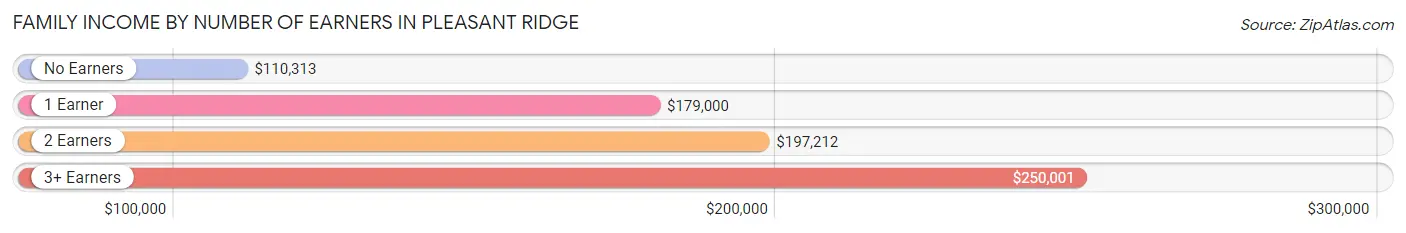
| Number of Earners | # Families | Median Income |
| No Earners | 103 (15.0%) | $110,313 |
| 1 Earner | 144 (20.9%) | $179,000 |
| 2 Earners | 393 (57.1%) | $197,212 |
| 3+ Earners | 48 (7.0%) | $250,001 |
| Total | 688 (100.0%) | $195,278 |
Household Income in Pleasant Ridge
Household Income Brackets in Pleasant Ridge
With 409 households falling in the category, the $200,000+ income range is the most frequent in Pleasant Ridge, accounting for 35.6% of all households. In contrast, only 3 households (0.3%) fall into the $10,000 to $14,999 income bracket, making it the least populous group.
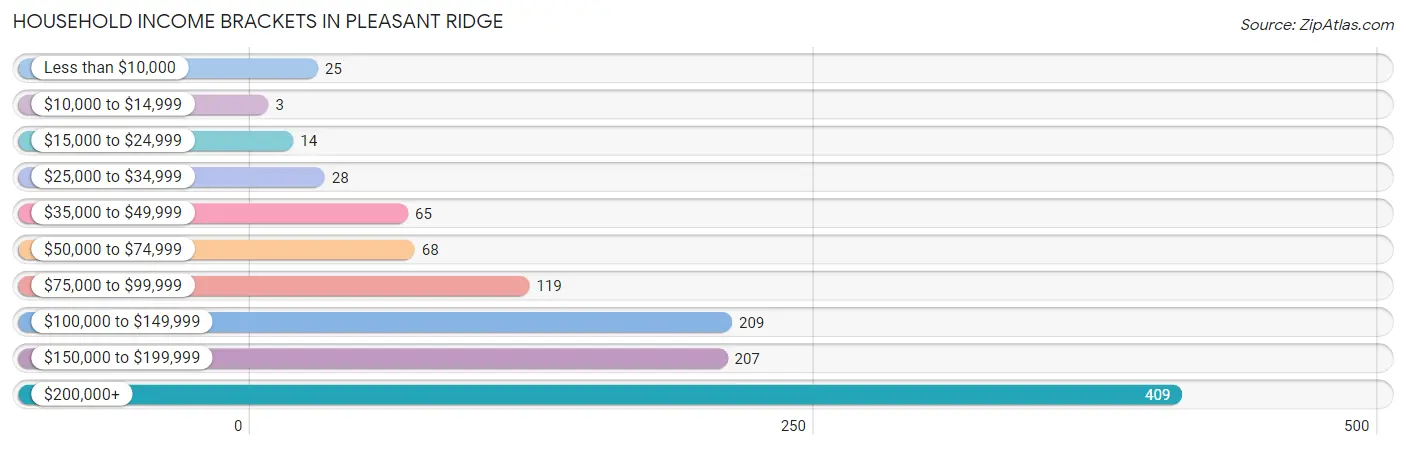
| Income Bracket | # Households | % Households |
| Less than $10,000 | 25 | 2.2% |
| $10,000 to $14,999 | 3 | 0.3% |
| $15,000 to $24,999 | 14 | 1.2% |
| $25,000 to $34,999 | 28 | 2.4% |
| $35,000 to $49,999 | 65 | 5.7% |
| $50,000 to $74,999 | 68 | 5.9% |
| $75,000 to $99,999 | 119 | 10.4% |
| $100,000 to $149,999 | 209 | 18.2% |
| $150,000 to $199,999 | 207 | 18.0% |
| $200,000+ | 409 | 35.6% |
Household Income by Householder Age in Pleasant Ridge
The median household income in Pleasant Ridge is $164,861, with the highest median household income of $177,417 found in the 25 to 44 years age bracket for the primary householder. A total of 391 households (34.0%) fall into this category.
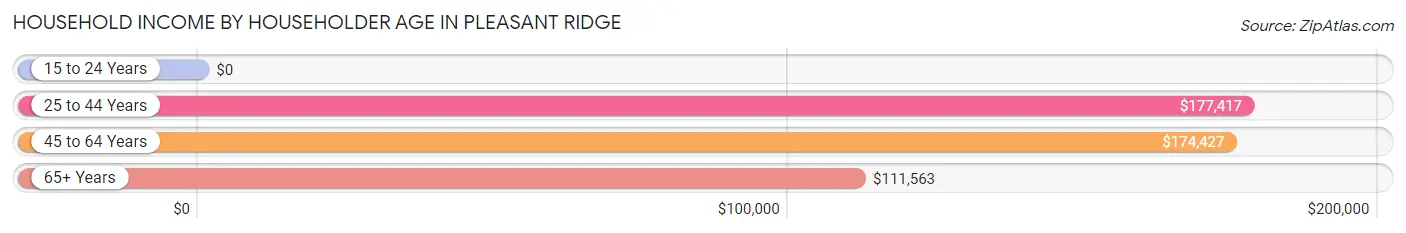
| Income Bracket | # Households | Median Income |
| 15 to 24 Years | 0 (0.0%) | $0 |
| 25 to 44 Years | 391 (34.0%) | $177,417 |
| 45 to 64 Years | 479 (41.7%) | $174,427 |
| 65+ Years | 279 (24.3%) | $111,563 |
| Total | 1,149 (100.0%) | $164,861 |
Poverty in Pleasant Ridge
Income Below Poverty by Sex and Age in Pleasant Ridge
With 1.9% poverty level for males and 3.2% for females among the residents of Pleasant Ridge, 12 to 14 year old males and 18 to 24 year old females are the most vulnerable to poverty, with 9 males (20.0%) and 4 females (12.1%) in their respective age groups living below the poverty level.
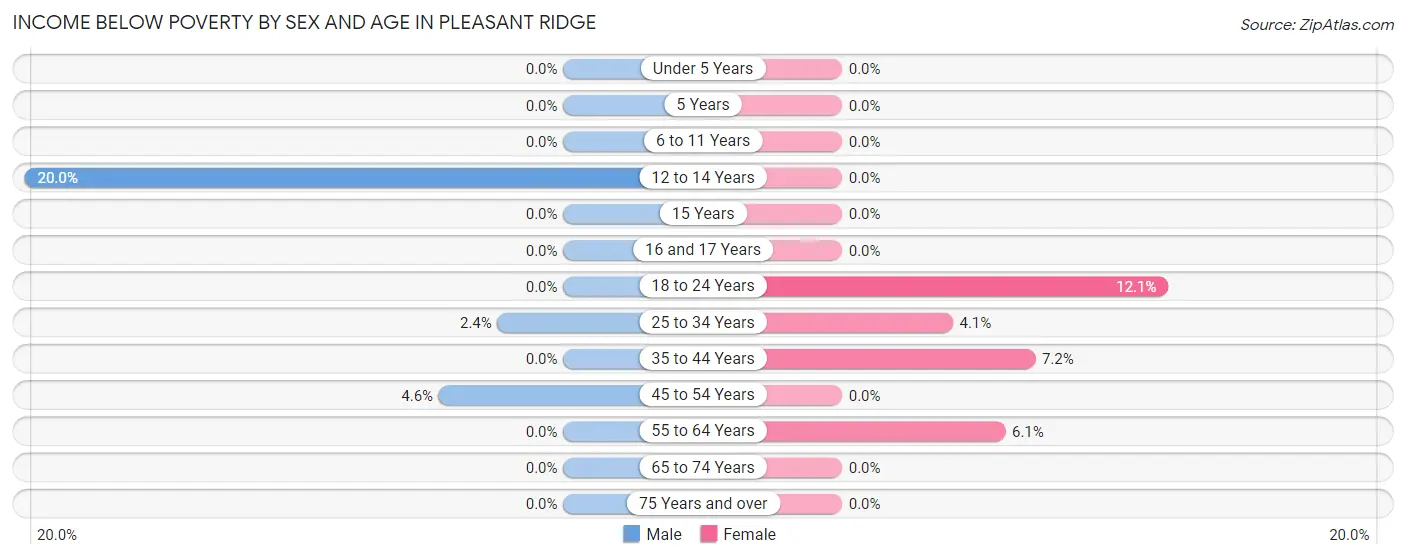
| Age Bracket | Male | Female |
| Under 5 Years | 0 (0.0%) | 0 (0.0%) |
| 5 Years | 0 (0.0%) | 0 (0.0%) |
| 6 to 11 Years | 0 (0.0%) | 0 (0.0%) |
| 12 to 14 Years | 9 (20.0%) | 0 (0.0%) |
| 15 Years | 0 (0.0%) | 0 (0.0%) |
| 16 and 17 Years | 0 (0.0%) | 0 (0.0%) |
| 18 to 24 Years | 0 (0.0%) | 4 (12.1%) |
| 25 to 34 Years | 5 (2.4%) | 6 (4.1%) |
| 35 to 44 Years | 0 (0.0%) | 16 (7.2%) |
| 45 to 54 Years | 11 (4.6%) | 0 (0.0%) |
| 55 to 64 Years | 0 (0.0%) | 16 (6.1%) |
| 65 to 74 Years | 0 (0.0%) | 0 (0.0%) |
| 75 Years and over | 0 (0.0%) | 0 (0.0%) |
| Total | 25 (1.9%) | 42 (3.2%) |
Income Above Poverty by Sex and Age in Pleasant Ridge
According to the poverty statistics in Pleasant Ridge, males aged under 5 years and females aged under 5 years are the age groups that are most secure financially, with 100.0% of males and 100.0% of females in these age groups living above the poverty line.
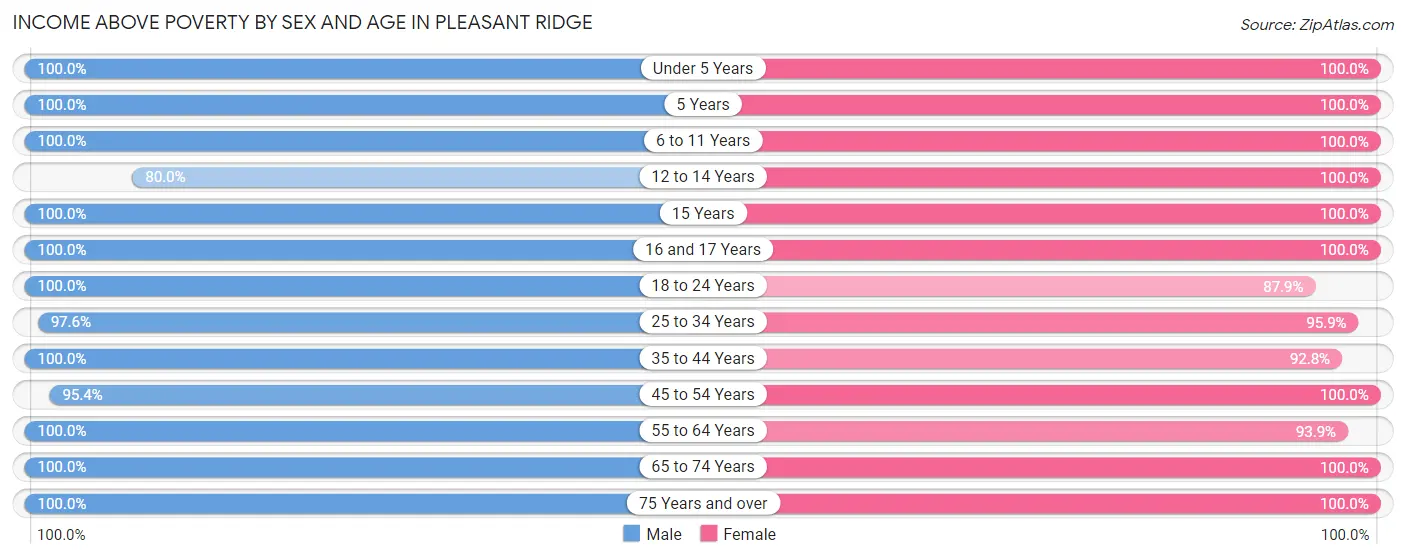
| Age Bracket | Male | Female |
| Under 5 Years | 142 (100.0%) | 70 (100.0%) |
| 5 Years | 6 (100.0%) | 16 (100.0%) |
| 6 to 11 Years | 55 (100.0%) | 111 (100.0%) |
| 12 to 14 Years | 36 (80.0%) | 30 (100.0%) |
| 15 Years | 5 (100.0%) | 4 (100.0%) |
| 16 and 17 Years | 9 (100.0%) | 13 (100.0%) |
| 18 to 24 Years | 72 (100.0%) | 29 (87.9%) |
| 25 to 34 Years | 200 (97.6%) | 140 (95.9%) |
| 35 to 44 Years | 138 (100.0%) | 207 (92.8%) |
| 45 to 54 Years | 227 (95.4%) | 153 (100.0%) |
| 55 to 64 Years | 181 (100.0%) | 248 (93.9%) |
| 65 to 74 Years | 136 (100.0%) | 158 (100.0%) |
| 75 Years and over | 56 (100.0%) | 97 (100.0%) |
| Total | 1,263 (98.1%) | 1,276 (96.8%) |
Income Below Poverty Among Married-Couple Families in Pleasant Ridge
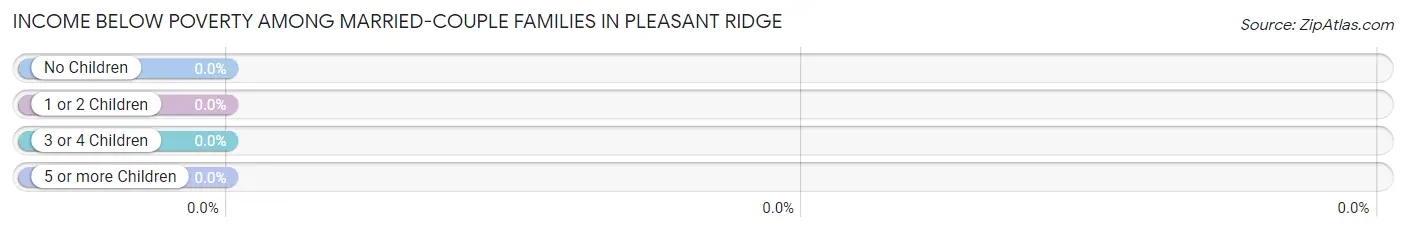
| Children | Above Poverty | Below Poverty |
| No Children | 371 (100.0%) | 0 (0.0%) |
| 1 or 2 Children | 217 (100.0%) | 0 (0.0%) |
| 3 or 4 Children | 41 (100.0%) | 0 (0.0%) |
| 5 or more Children | 0 (0.0%) | 0 (0.0%) |
| Total | 629 (100.0%) | 0 (0.0%) |
Income Below Poverty Among Single-Parent Households in Pleasant Ridge
According to the poverty data in Pleasant Ridge, 28.6% or 4 single-father households and 8.9% or 4 single-mother households are living below the poverty line. Among single-father households, those with 1 or 2 children have the highest poverty rate, with 4 households (28.6%) experiencing poverty. Likewise, among single-mother households, those with no children have the highest poverty rate, with 4 households (11.4%) falling below the poverty line.
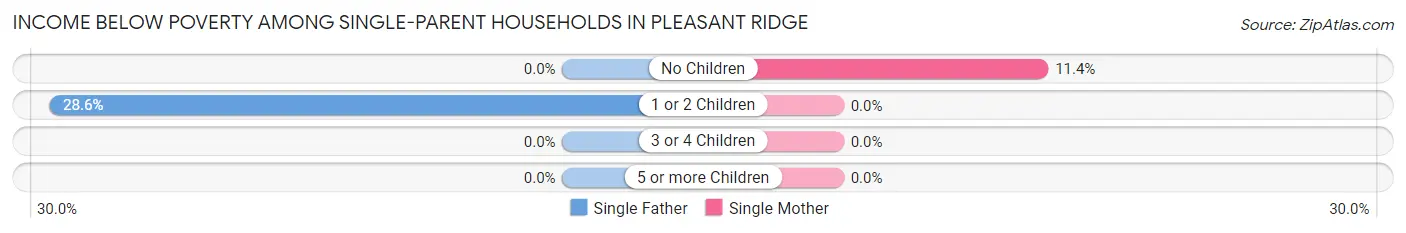
| Children | Single Father | Single Mother |
| No Children | 0 (0.0%) | 4 (11.4%) |
| 1 or 2 Children | 4 (28.6%) | 0 (0.0%) |
| 3 or 4 Children | 0 (0.0%) | 0 (0.0%) |
| 5 or more Children | 0 (0.0%) | 0 (0.0%) |
| Total | 4 (28.6%) | 4 (8.9%) |
Income Below Poverty Among Married-Couple vs Single-Parent Households in Pleasant Ridge
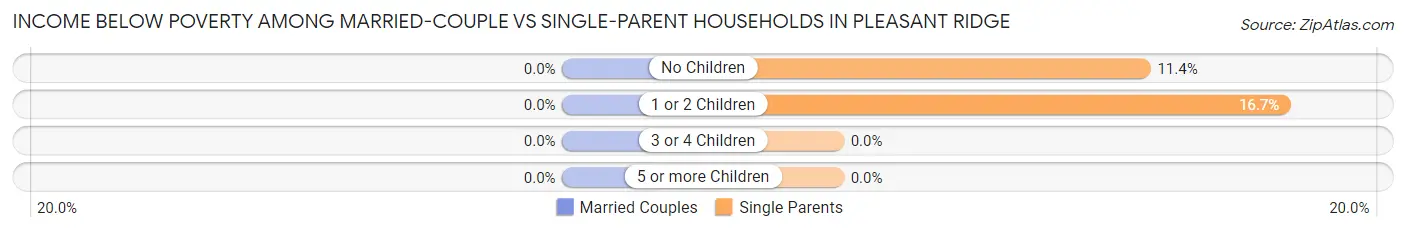
| Children | Married-Couple Families | Single-Parent Households |
| No Children | 0 (0.0%) | 4 (11.4%) |
| 1 or 2 Children | 0 (0.0%) | 4 (16.7%) |
| 3 or 4 Children | 0 (0.0%) | 0 (0.0%) |
| 5 or more Children | 0 (0.0%) | 0 (0.0%) |
| Total | 0 (0.0%) | 8 (13.6%) |
Race in Pleasant Ridge
The most populous races in Pleasant Ridge are White / Caucasian (2,404 | 92.1%), Two or more Races (136 | 5.2%), and Hispanic or Latino (112 | 4.3%).
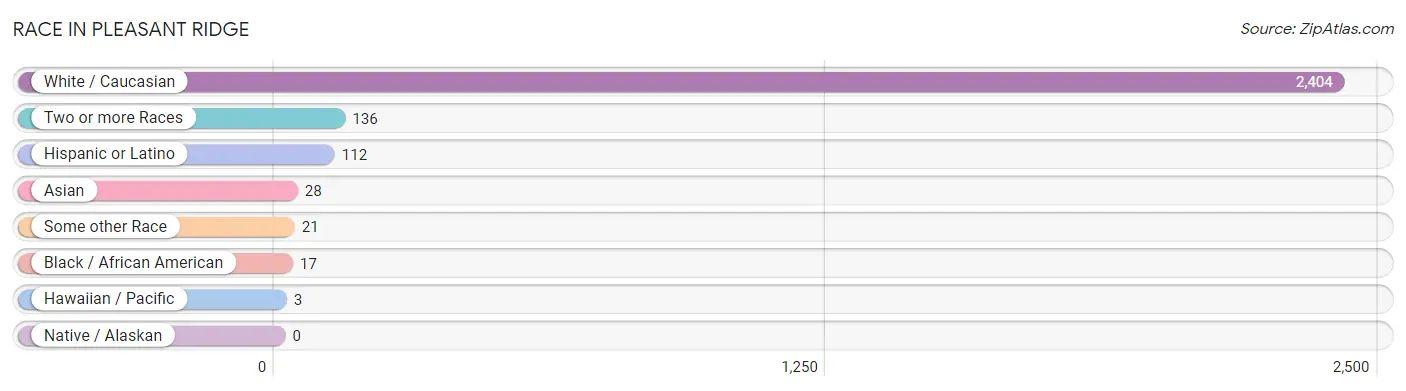
| Race | # Population | % Population |
| Asian | 28 | 1.1% |
| Black / African American | 17 | 0.6% |
| Hawaiian / Pacific | 3 | 0.1% |
| Hispanic or Latino | 112 | 4.3% |
| Native / Alaskan | 0 | 0.0% |
| White / Caucasian | 2,404 | 92.1% |
| Two or more Races | 136 | 5.2% |
| Some other Race | 21 | 0.8% |
| Total | 2,609 | 100.0% |
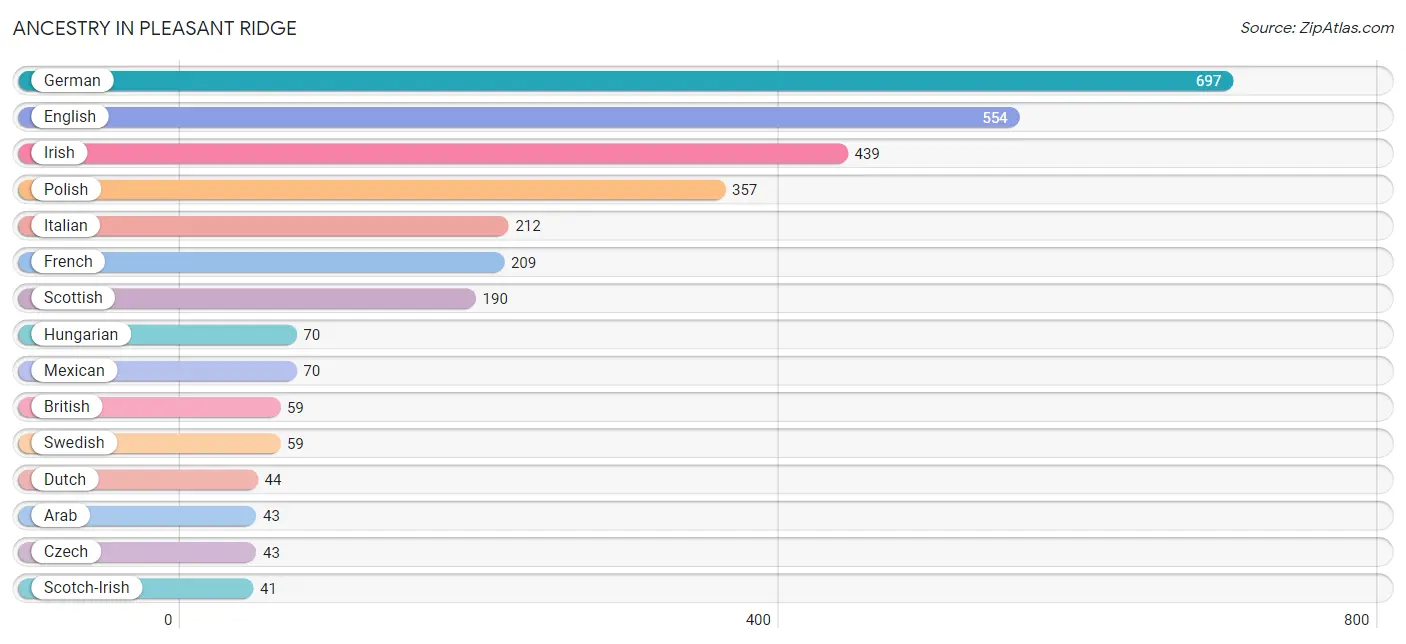
Ancestry in Pleasant Ridge
The most populous ancestries reported in Pleasant Ridge are German (697 | 26.7%), English (554 | 21.2%), Irish (439 | 16.8%), Polish (357 | 13.7%), and Italian (212 | 8.1%), together accounting for 86.6% of all Pleasant Ridge residents.
| Ancestry | # Population | % Population |
| American | 38 | 1.5% |
| Arab | 43 | 1.7% |
| Armenian | 37 | 1.4% |
| Austrian | 4 | 0.2% |
| Belgian | 14 | 0.5% |
| Brazilian | 8 | 0.3% |
| British | 59 | 2.3% |
| Canadian | 22 | 0.8% |
| Central American | 3 | 0.1% |
| Chippewa | 12 | 0.5% |
| Colombian | 30 | 1.1% |
| Comanche | 7 | 0.3% |
| Croatian | 31 | 1.2% |
| Czech | 43 | 1.7% |
| Danish | 18 | 0.7% |
| Dutch | 44 | 1.7% |
| Eastern European | 20 | 0.8% |
| English | 554 | 21.2% |
| European | 17 | 0.6% |
| Finnish | 4 | 0.2% |
| French | 209 | 8.0% |
| French Canadian | 35 | 1.3% |
| German | 697 | 26.7% |
| Greek | 28 | 1.1% |
| Guamanian / Chamorro | 3 | 0.1% |
| Guatemalan | 3 | 0.1% |
| Hungarian | 70 | 2.7% |
| Indian (Asian) | 23 | 0.9% |
| Irish | 439 | 16.8% |
| Italian | 212 | 8.1% |
| Korean | 18 | 0.7% |
| Laotian | 19 | 0.7% |
| Lebanese | 20 | 0.8% |
| Lithuanian | 23 | 0.9% |
| Lumbee | 4 | 0.2% |
| Macedonian | 7 | 0.3% |
| Maltese | 5 | 0.2% |
| Mexican | 70 | 2.7% |
| Northern European | 4 | 0.2% |
| Norwegian | 22 | 0.8% |
| Osage | 7 | 0.3% |
| Pakistani | 16 | 0.6% |
| Palestinian | 23 | 0.9% |
| Peruvian | 5 | 0.2% |
| Polish | 357 | 13.7% |
| Puerto Rican | 4 | 0.2% |
| Romanian | 24 | 0.9% |
| Russian | 26 | 1.0% |
| Scotch-Irish | 41 | 1.6% |
| Scottish | 190 | 7.3% |
| Serbian | 4 | 0.2% |
| Slavic | 13 | 0.5% |
| Slovak | 26 | 1.0% |
| Slovene | 9 | 0.3% |
| South American | 35 | 1.3% |
| Swedish | 59 | 2.3% |
| Swiss | 36 | 1.4% |
| Trinidadian and Tobagonian | 8 | 0.3% |
| Ukrainian | 37 | 1.4% |
| Welsh | 10 | 0.4% | View All 60 Rows |
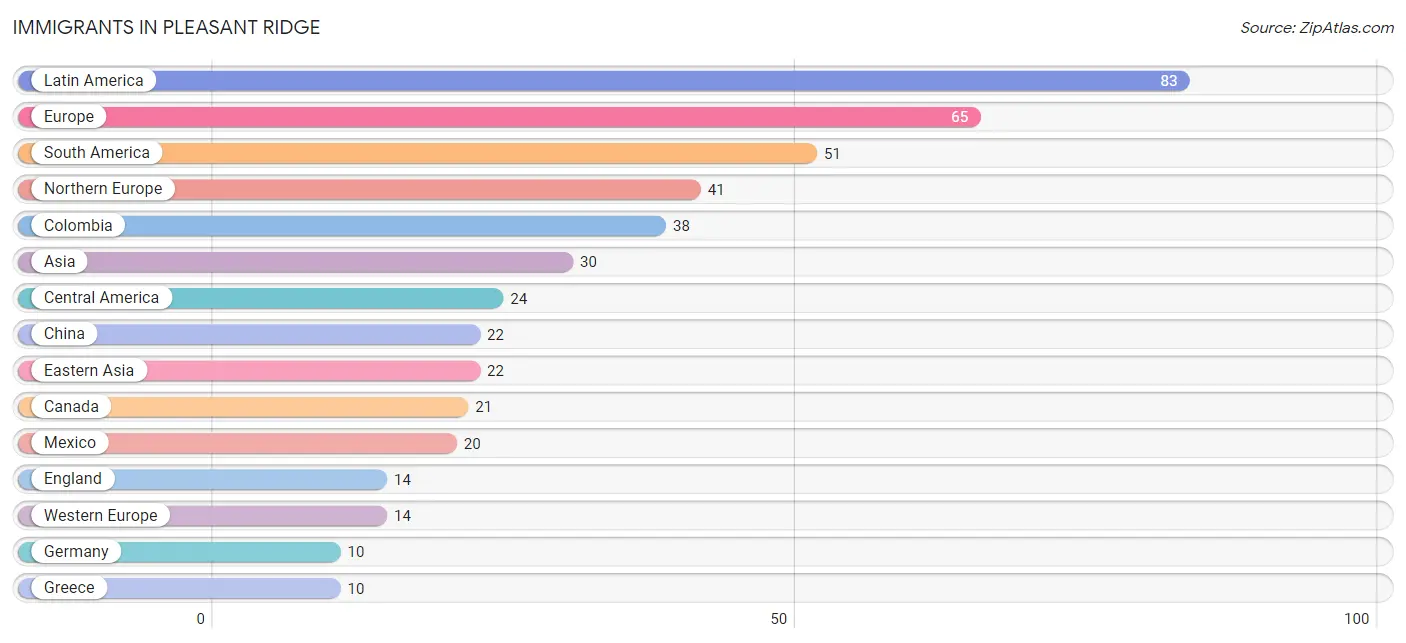
Immigrants in Pleasant Ridge
The most numerous immigrant groups reported in Pleasant Ridge came from Latin America (83 | 3.2%), Europe (65 | 2.5%), South America (51 | 1.9%), Northern Europe (41 | 1.6%), and Colombia (38 | 1.5%), together accounting for 10.7% of all Pleasant Ridge residents.
| Immigration Origin | # Population | % Population |
| Asia | 30 | 1.1% |
| Brazil | 8 | 0.3% |
| Canada | 21 | 0.8% |
| Caribbean | 8 | 0.3% |
| Central America | 24 | 0.9% |
| China | 22 | 0.8% |
| Colombia | 38 | 1.5% |
| Denmark | 4 | 0.2% |
| Eastern Asia | 22 | 0.8% |
| England | 14 | 0.5% |
| Europe | 65 | 2.5% |
| France | 4 | 0.2% |
| Germany | 10 | 0.4% |
| Greece | 10 | 0.4% |
| Guatemala | 4 | 0.2% |
| Ireland | 8 | 0.3% |
| Israel | 5 | 0.2% |
| Latin America | 83 | 3.2% |
| Mexico | 20 | 0.8% |
| Northern Europe | 41 | 1.6% |
| Peru | 5 | 0.2% |
| Philippines | 3 | 0.1% |
| South America | 51 | 1.9% |
| South Eastern Asia | 3 | 0.1% |
| Southern Europe | 10 | 0.4% |
| Taiwan | 4 | 0.2% |
| Trinidad and Tobago | 8 | 0.3% |
| Western Asia | 5 | 0.2% |
| Western Europe | 14 | 0.5% | View All 29 Rows |
Sex and Age in Pleasant Ridge
Sex and Age in Pleasant Ridge
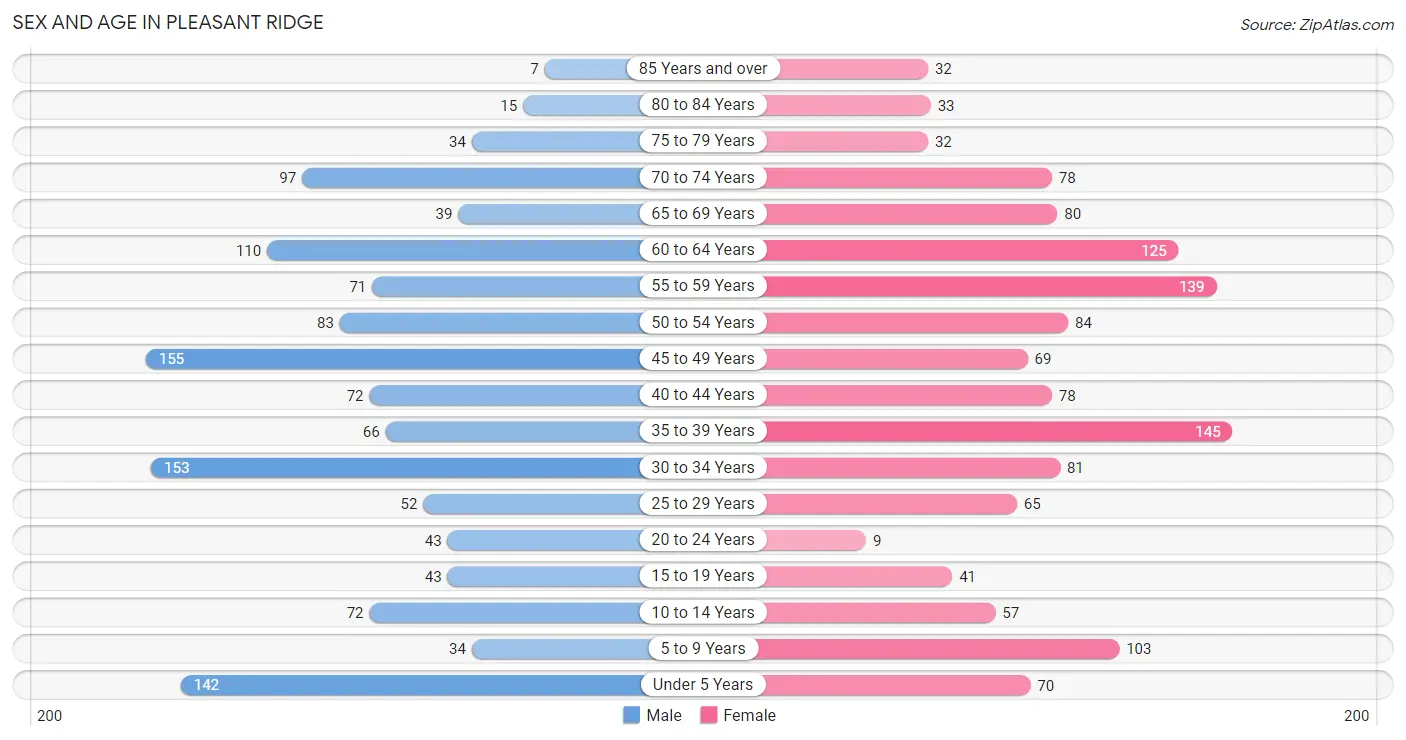
The most populous age groups in Pleasant Ridge are 45 to 49 Years (155 | 12.0%) for men and 35 to 39 Years (145 | 11.0%) for women.
| Age Bracket | Male | Female |
| Under 5 Years | 142 (11.0%) | 70 (5.3%) |
| 5 to 9 Years | 34 (2.6%) | 103 (7.8%) |
| 10 to 14 Years | 72 (5.6%) | 57 (4.3%) |
| 15 to 19 Years | 43 (3.3%) | 41 (3.1%) |
| 20 to 24 Years | 43 (3.3%) | 9 (0.7%) |
| 25 to 29 Years | 52 (4.0%) | 65 (4.9%) |
| 30 to 34 Years | 153 (11.9%) | 81 (6.1%) |
| 35 to 39 Years | 66 (5.1%) | 145 (11.0%) |
| 40 to 44 Years | 72 (5.6%) | 78 (5.9%) |
| 45 to 49 Years | 155 (12.0%) | 69 (5.2%) |
| 50 to 54 Years | 83 (6.4%) | 84 (6.4%) |
| 55 to 59 Years | 71 (5.5%) | 139 (10.5%) |
| 60 to 64 Years | 110 (8.5%) | 125 (9.5%) |
| 65 to 69 Years | 39 (3.0%) | 80 (6.1%) |
| 70 to 74 Years | 97 (7.5%) | 78 (5.9%) |
| 75 to 79 Years | 34 (2.6%) | 32 (2.4%) |
| 80 to 84 Years | 15 (1.2%) | 33 (2.5%) |
| 85 Years and over | 7 (0.5%) | 32 (2.4%) |
| Total | 1,288 (100.0%) | 1,321 (100.0%) |
Families and Households in Pleasant Ridge
Median Family Size in Pleasant Ridge
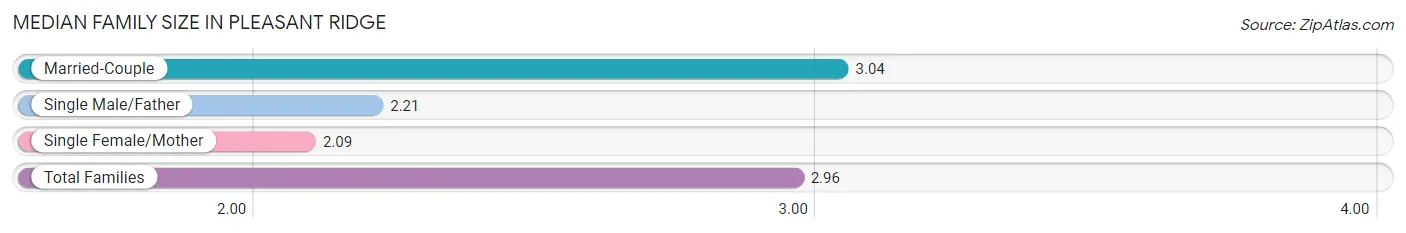
The median family size in Pleasant Ridge is 2.96 persons per family, with married-couple families (629 | 91.4%) accounting for the largest median family size of 3.04 persons per family. On the other hand, single female/mother families (45 | 6.5%) represent the smallest median family size with 2.09 persons per family.
| Family Type | # Families | Family Size |
| Married-Couple | 629 (91.4%) | 3.04 |
| Single Male/Father | 14 (2.0%) | 2.21 |
| Single Female/Mother | 45 (6.5%) | 2.09 |
| Total Families | 688 (100.0%) | 2.96 |
Median Household Size in Pleasant Ridge
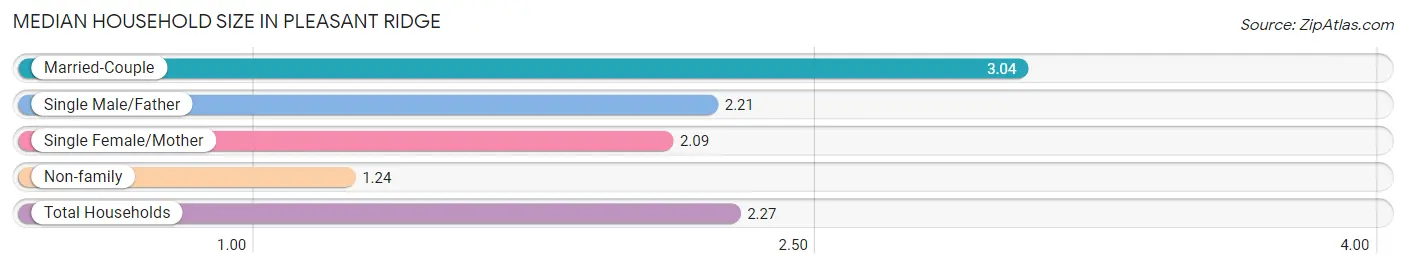
The median household size in Pleasant Ridge is 2.27 persons per household, with married-couple households (629 | 54.7%) accounting for the largest median household size of 3.04 persons per household. non-family households (461 | 40.1%) represent the smallest median household size with 1.24 persons per household.
| Household Type | # Households | Household Size |
| Married-Couple | 629 (54.7%) | 3.04 |
| Single Male/Father | 14 (1.2%) | 2.21 |
| Single Female/Mother | 45 (3.9%) | 2.09 |
| Non-family | 461 (40.1%) | 1.24 |
| Total Households | 1,149 (100.0%) | 2.27 |
Household Size by Marriage Status in Pleasant Ridge
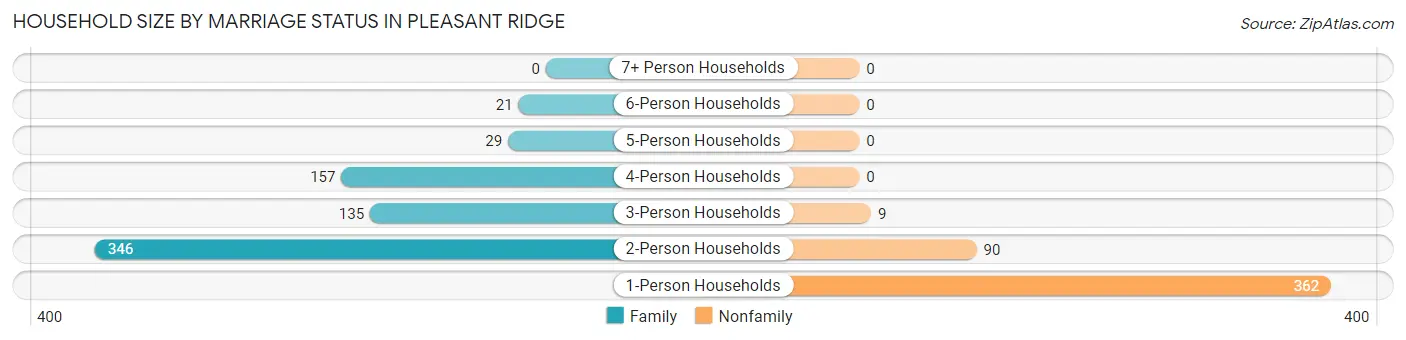
Out of a total of 1,149 households in Pleasant Ridge, 688 (59.9%) are family households, while 461 (40.1%) are nonfamily households. The most numerous type of family households are 2-person households, comprising 346, and the most common type of nonfamily households are 1-person households, comprising 362.
| Household Size | Family Households | Nonfamily Households |
| 1-Person Households | - | 362 (31.5%) |
| 2-Person Households | 346 (30.1%) | 90 (7.8%) |
| 3-Person Households | 135 (11.7%) | 9 (0.8%) |
| 4-Person Households | 157 (13.7%) | 0 (0.0%) |
| 5-Person Households | 29 (2.5%) | 0 (0.0%) |
| 6-Person Households | 21 (1.8%) | 0 (0.0%) |
| 7+ Person Households | 0 (0.0%) | 0 (0.0%) |
| Total | 688 (59.9%) | 461 (40.1%) |
Female Fertility in Pleasant Ridge
Fertility by Age in Pleasant Ridge
Average fertility rate in Pleasant Ridge is 60.0 births per 1,000 women. Women in the age bracket of 35 to 50 years have the highest fertility rate with 99.0 births per 1,000 women. Women in the age bracket of 35 to 50 years acount for 100.0% of all women with births.
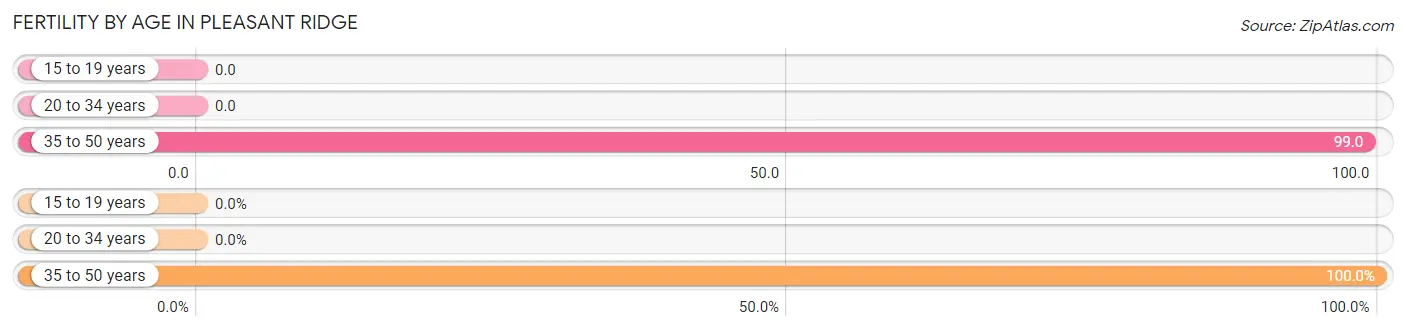
| Age Bracket | Women with Births | Births / 1,000 Women |
| 15 to 19 years | 0 (0.0%) | 0.0 |
| 20 to 34 years | 0 (0.0%) | 0.0 |
| 35 to 50 years | 30 (100.0%) | 99.0 |
| Total | 30 (100.0%) | 60.0 |
Fertility by Age by Marriage Status in Pleasant Ridge
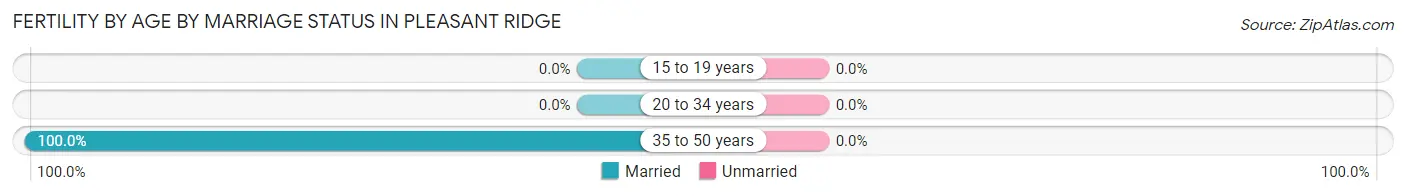
| Age Bracket | Married | Unmarried |
| 15 to 19 years | 0 (0.0%) | 0 (0.0%) |
| 20 to 34 years | 0 (0.0%) | 0 (0.0%) |
| 35 to 50 years | 30 (100.0%) | 0 (0.0%) |
| Total | 30 (100.0%) | 0 (0.0%) |
Fertility by Education in Pleasant Ridge
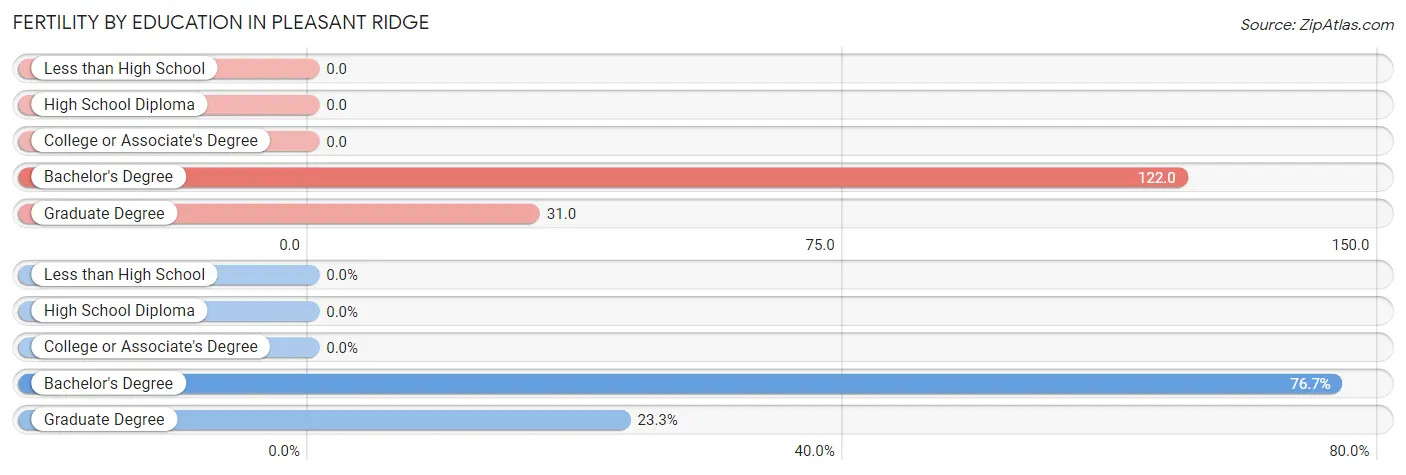
| Educational Attainment | Women with Births | Births / 1,000 Women |
| Less than High School | 0 (0.0%) | 0.0 |
| High School Diploma | 0 (0.0%) | 0.0 |
| College or Associate's Degree | 0 (0.0%) | 0.0 |
| Bachelor's Degree | 23 (76.7%) | 122.0 |
| Graduate Degree | 7 (23.3%) | 31.0 |
| Total | 30 (100.0%) | 60.0 |
Fertility by Education by Marriage Status in Pleasant Ridge
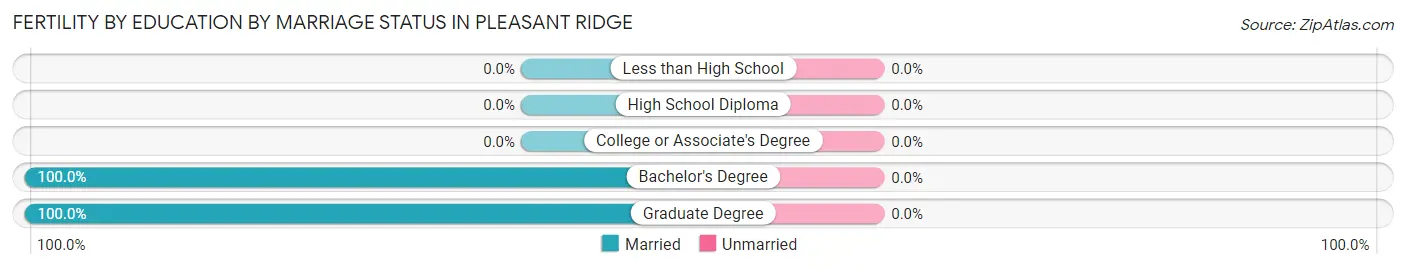
| Educational Attainment | Married | Unmarried |
| Less than High School | 0 (0.0%) | 0 (0.0%) |
| High School Diploma | 0 (0.0%) | 0 (0.0%) |
| College or Associate's Degree | 0 (0.0%) | 0 (0.0%) |
| Bachelor's Degree | 23 (100.0%) | 0 (0.0%) |
| Graduate Degree | 7 (100.0%) | 0 (0.0%) |
| Total | 30 (100.0%) | 0 (0.0%) |
Employment Characteristics in Pleasant Ridge
Employment by Class of Employer in Pleasant Ridge
Among the 1,415 employed individuals in Pleasant Ridge, private company employees (844 | 59.7%), not-for-profit organizations (217 | 15.3%), and self-employed (not incorporated) (95 | 6.7%) make up the most common classes of employment.
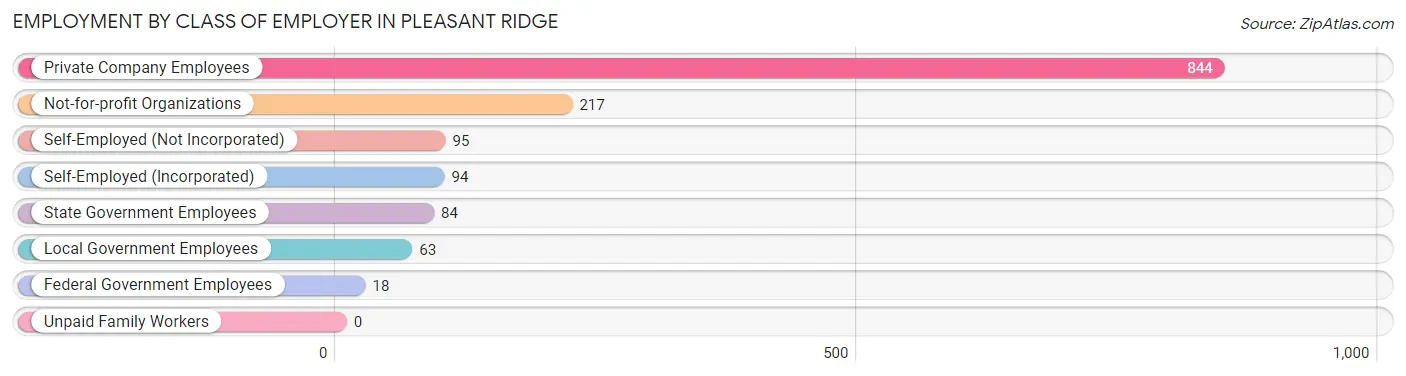
| Employer Class | # Employees | % Employees |
| Private Company Employees | 844 | 59.7% |
| Self-Employed (Incorporated) | 94 | 6.6% |
| Self-Employed (Not Incorporated) | 95 | 6.7% |
| Not-for-profit Organizations | 217 | 15.3% |
| Local Government Employees | 63 | 4.4% |
| State Government Employees | 84 | 5.9% |
| Federal Government Employees | 18 | 1.3% |
| Unpaid Family Workers | 0 | 0.0% |
| Total | 1,415 | 100.0% |
Employment Status by Age in Pleasant Ridge
According to the labor force statistics for Pleasant Ridge, out of the total population over 16 years of age (2,122), 72.0% or 1,528 individuals are in the labor force, with 6.7% or 102 of them unemployed. The age group with the highest labor force participation rate is 25 to 29 years, with 100.0% or 117 individuals in the labor force. Within the labor force, the 20 to 24 years age range has the highest percentage of unemployed individuals, with 29.3% or 12 of them being unemployed.
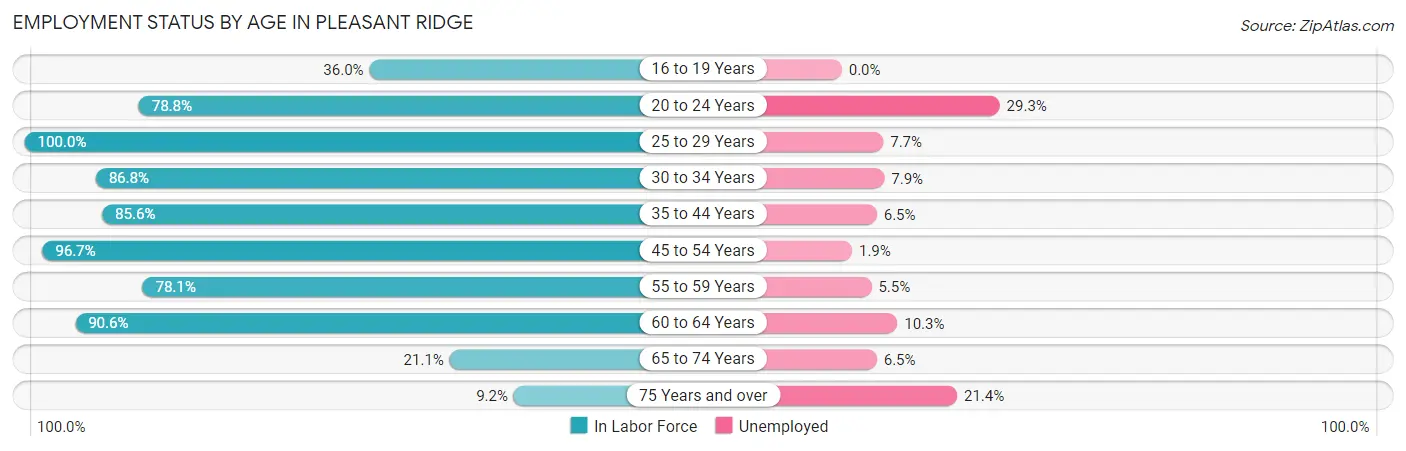
| Age Bracket | In Labor Force | Unemployed |
| 16 to 19 Years | 27 (36.0%) | 0 (0.0%) |
| 20 to 24 Years | 41 (78.8%) | 12 (29.3%) |
| 25 to 29 Years | 117 (100.0%) | 9 (7.7%) |
| 30 to 34 Years | 203 (86.8%) | 16 (7.9%) |
| 35 to 44 Years | 309 (85.6%) | 20 (6.5%) |
| 45 to 54 Years | 378 (96.7%) | 7 (1.9%) |
| 55 to 59 Years | 164 (78.1%) | 9 (5.5%) |
| 60 to 64 Years | 213 (90.6%) | 22 (10.3%) |
| 65 to 74 Years | 62 (21.1%) | 4 (6.5%) |
| 75 Years and over | 14 (9.2%) | 3 (21.4%) |
| Total | 1,528 (72.0%) | 102 (6.7%) |
Employment Status by Educational Attainment in Pleasant Ridge
According to labor force statistics for Pleasant Ridge, 89.4% of individuals (1,384) out of the total population between 25 and 64 years of age (1,548) are in the labor force, with 6.0% or 83 of them being unemployed. The group with the highest labor force participation rate are those with the educational attainment of high school diploma, with 91.7% or 66 individuals in the labor force. Within the labor force, individuals with college / associate degree education have the highest percentage of unemployment, with 12.1% or 26 of them being unemployed.
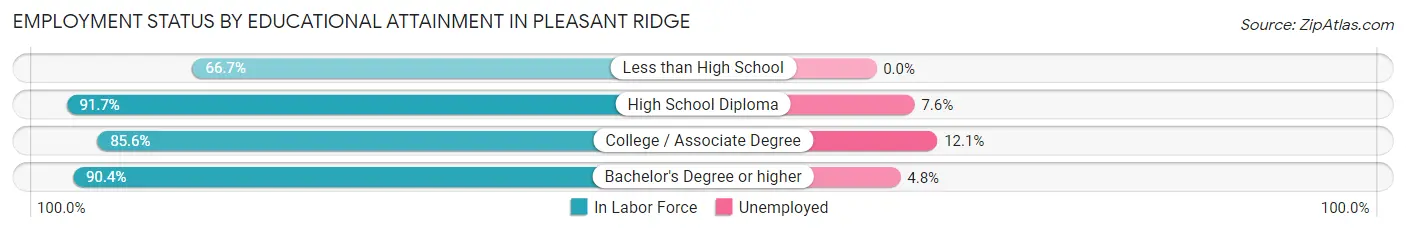
| Educational Attainment | In Labor Force | Unemployed |
| Less than High School | 12 (66.7%) | 0 (0.0%) |
| High School Diploma | 66 (91.7%) | 5 (7.6%) |
| College / Associate Degree | 214 (85.6%) | 30 (12.1%) |
| Bachelor's Degree or higher | 1,092 (90.4%) | 58 (4.8%) |
| Total | 1,384 (89.4%) | 93 (6.0%) |
Employment Occupations by Sex in Pleasant Ridge
Management, Business, Science and Arts Occupations
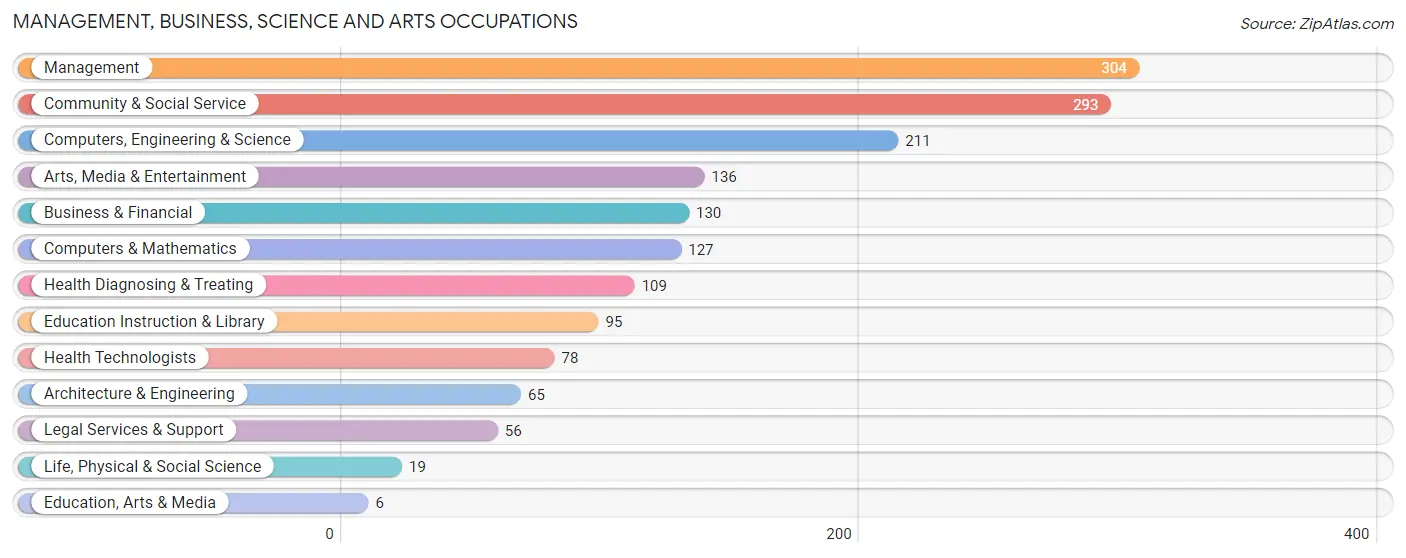
The most common Management, Business, Science and Arts occupations in Pleasant Ridge are Management (304 | 21.3%), Community & Social Service (293 | 20.5%), Computers, Engineering & Science (211 | 14.8%), Arts, Media & Entertainment (136 | 9.5%), and Business & Financial (130 | 9.1%).
Management, Business, Science and Arts Occupations by Sex
Within the Management, Business, Science and Arts occupations in Pleasant Ridge, the most male-oriented occupations are Architecture & Engineering (78.5%), Life, Physical & Social Science (68.4%), and Computers, Engineering & Science (63.0%), while the most female-oriented occupations are Education, Arts & Media (100.0%), Health Technologists (82.1%), and Health Diagnosing & Treating (73.4%).
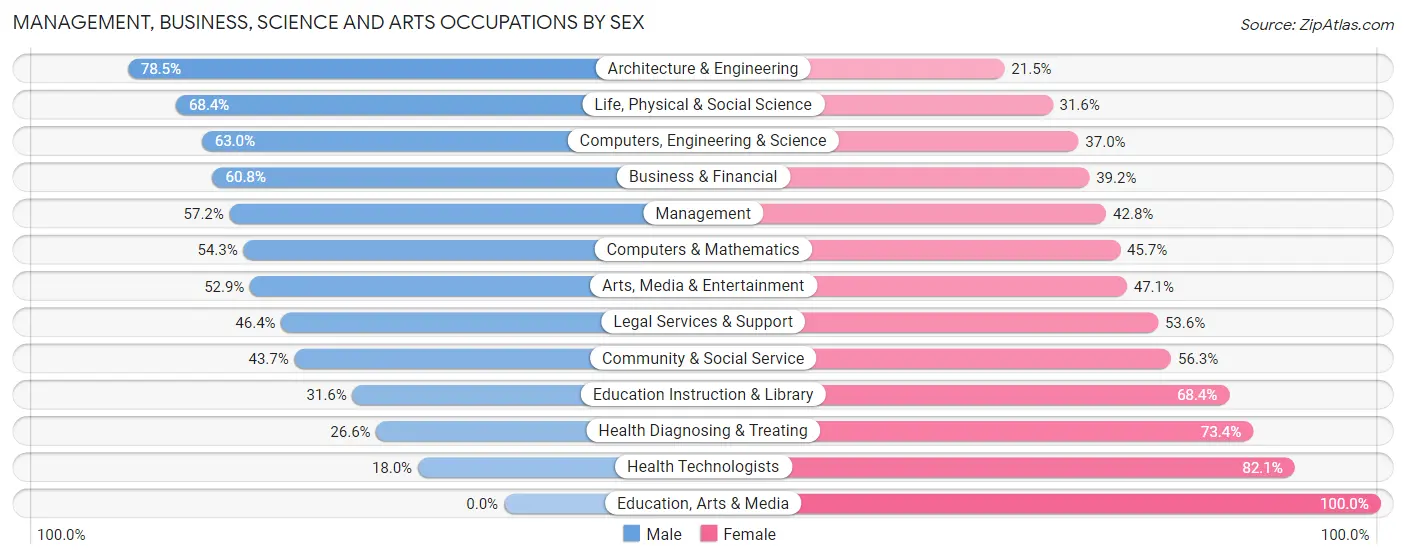
| Occupation | Male | Female |
| Management | 174 (57.2%) | 130 (42.8%) |
| Business & Financial | 79 (60.8%) | 51 (39.2%) |
| Computers, Engineering & Science | 133 (63.0%) | 78 (37.0%) |
| Computers & Mathematics | 69 (54.3%) | 58 (45.7%) |
| Architecture & Engineering | 51 (78.5%) | 14 (21.5%) |
| Life, Physical & Social Science | 13 (68.4%) | 6 (31.6%) |
| Community & Social Service | 128 (43.7%) | 165 (56.3%) |
| Education, Arts & Media | 0 (0.0%) | 6 (100.0%) |
| Legal Services & Support | 26 (46.4%) | 30 (53.6%) |
| Education Instruction & Library | 30 (31.6%) | 65 (68.4%) |
| Arts, Media & Entertainment | 72 (52.9%) | 64 (47.1%) |
| Health Diagnosing & Treating | 29 (26.6%) | 80 (73.4%) |
| Health Technologists | 14 (17.9%) | 64 (82.1%) |
| Total (Category) | 543 (51.9%) | 504 (48.1%) |
| Total (Overall) | 762 (53.4%) | 664 (46.6%) |
Services Occupations
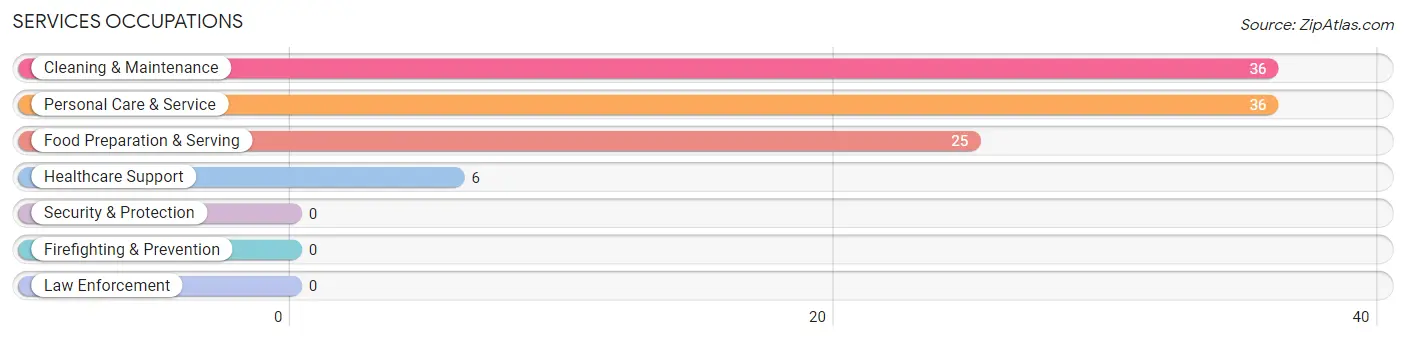
The most common Services occupations in Pleasant Ridge are Cleaning & Maintenance (36 | 2.5%), Personal Care & Service (36 | 2.5%), Food Preparation & Serving (25 | 1.8%), and Healthcare Support (6 | 0.4%).
Services Occupations by Sex
Within the Services occupations in Pleasant Ridge, the most male-oriented occupations are Healthcare Support (100.0%), Cleaning & Maintenance (100.0%), and Food Preparation & Serving (64.0%), while the most female-oriented occupations are Personal Care & Service (88.9%), and Food Preparation & Serving (36.0%).
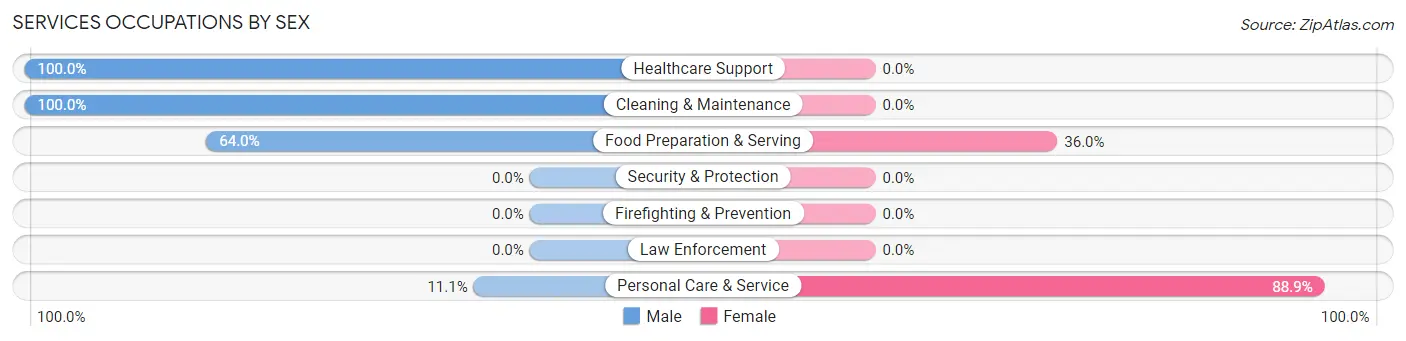
| Occupation | Male | Female |
| Healthcare Support | 6 (100.0%) | 0 (0.0%) |
| Security & Protection | 0 (0.0%) | 0 (0.0%) |
| Firefighting & Prevention | 0 (0.0%) | 0 (0.0%) |
| Law Enforcement | 0 (0.0%) | 0 (0.0%) |
| Food Preparation & Serving | 16 (64.0%) | 9 (36.0%) |
| Cleaning & Maintenance | 36 (100.0%) | 0 (0.0%) |
| Personal Care & Service | 4 (11.1%) | 32 (88.9%) |
| Total (Category) | 62 (60.2%) | 41 (39.8%) |
| Total (Overall) | 762 (53.4%) | 664 (46.6%) |
Sales and Office Occupations
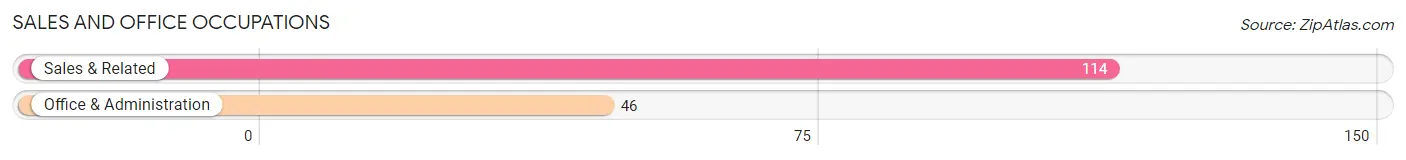
The most common Sales and Office occupations in Pleasant Ridge are Sales & Related (114 | 8.0%), and Office & Administration (46 | 3.2%).
Sales and Office Occupations by Sex
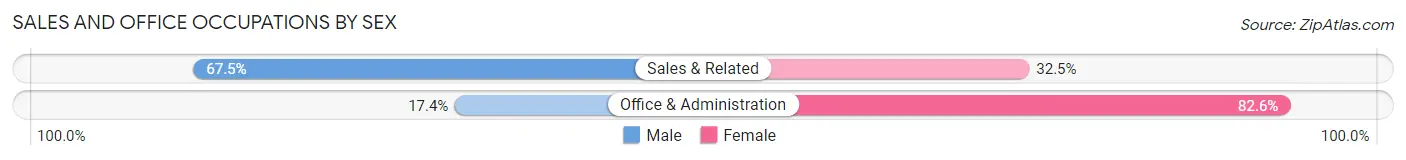
| Occupation | Male | Female |
| Sales & Related | 77 (67.5%) | 37 (32.5%) |
| Office & Administration | 8 (17.4%) | 38 (82.6%) |
| Total (Category) | 85 (53.1%) | 75 (46.9%) |
| Total (Overall) | 762 (53.4%) | 664 (46.6%) |
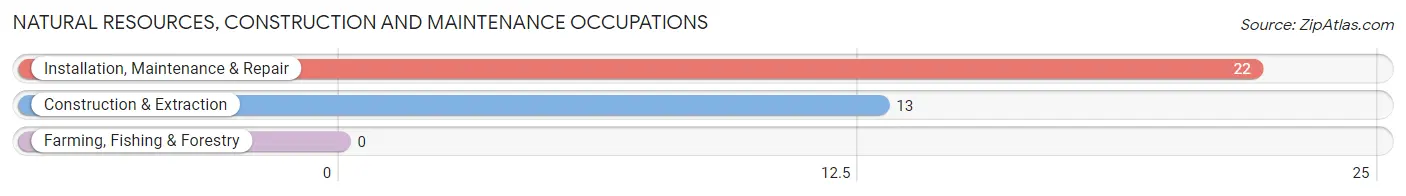
Natural Resources, Construction and Maintenance Occupations
The most common Natural Resources, Construction and Maintenance occupations in Pleasant Ridge are Installation, Maintenance & Repair (22 | 1.5%), and Construction & Extraction (13 | 0.9%).
Natural Resources, Construction and Maintenance Occupations by Sex
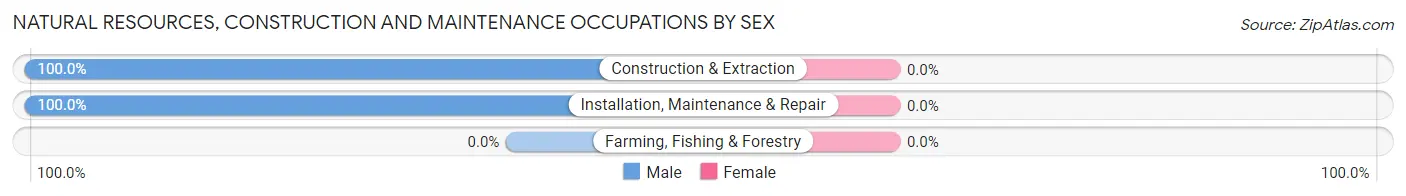
| Occupation | Male | Female |
| Farming, Fishing & Forestry | 0 (0.0%) | 0 (0.0%) |
| Construction & Extraction | 13 (100.0%) | 0 (0.0%) |
| Installation, Maintenance & Repair | 22 (100.0%) | 0 (0.0%) |
| Total (Category) | 35 (100.0%) | 0 (0.0%) |
| Total (Overall) | 762 (53.4%) | 664 (46.6%) |
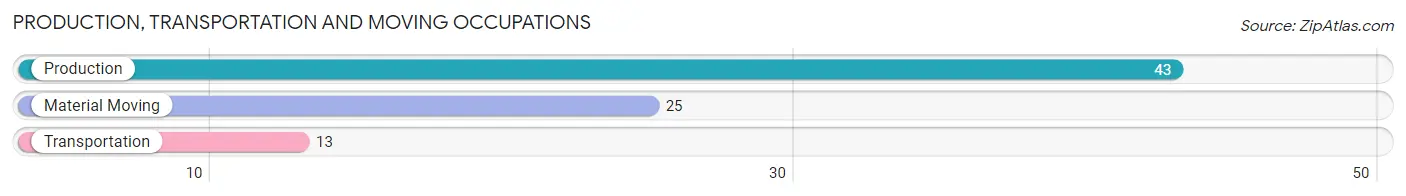
Production, Transportation and Moving Occupations
The most common Production, Transportation and Moving occupations in Pleasant Ridge are Production (43 | 3.0%), Material Moving (25 | 1.8%), and Transportation (13 | 0.9%).
Production, Transportation and Moving Occupations by Sex
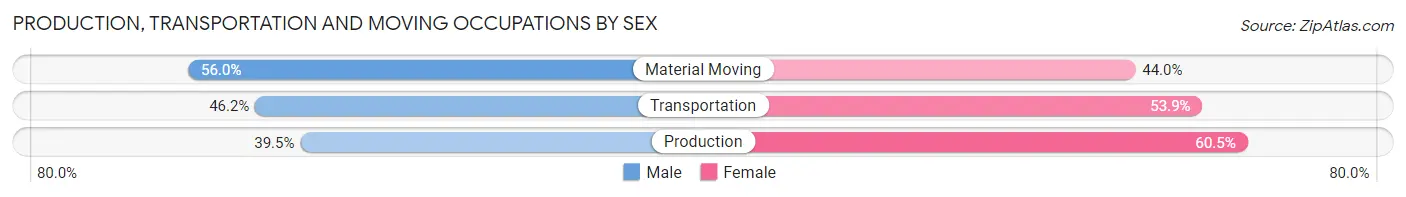
| Occupation | Male | Female |
| Production | 17 (39.5%) | 26 (60.5%) |
| Transportation | 6 (46.2%) | 7 (53.8%) |
| Material Moving | 14 (56.0%) | 11 (44.0%) |
| Total (Category) | 37 (45.7%) | 44 (54.3%) |
| Total (Overall) | 762 (53.4%) | 664 (46.6%) |
Employment Industries by Sex in Pleasant Ridge
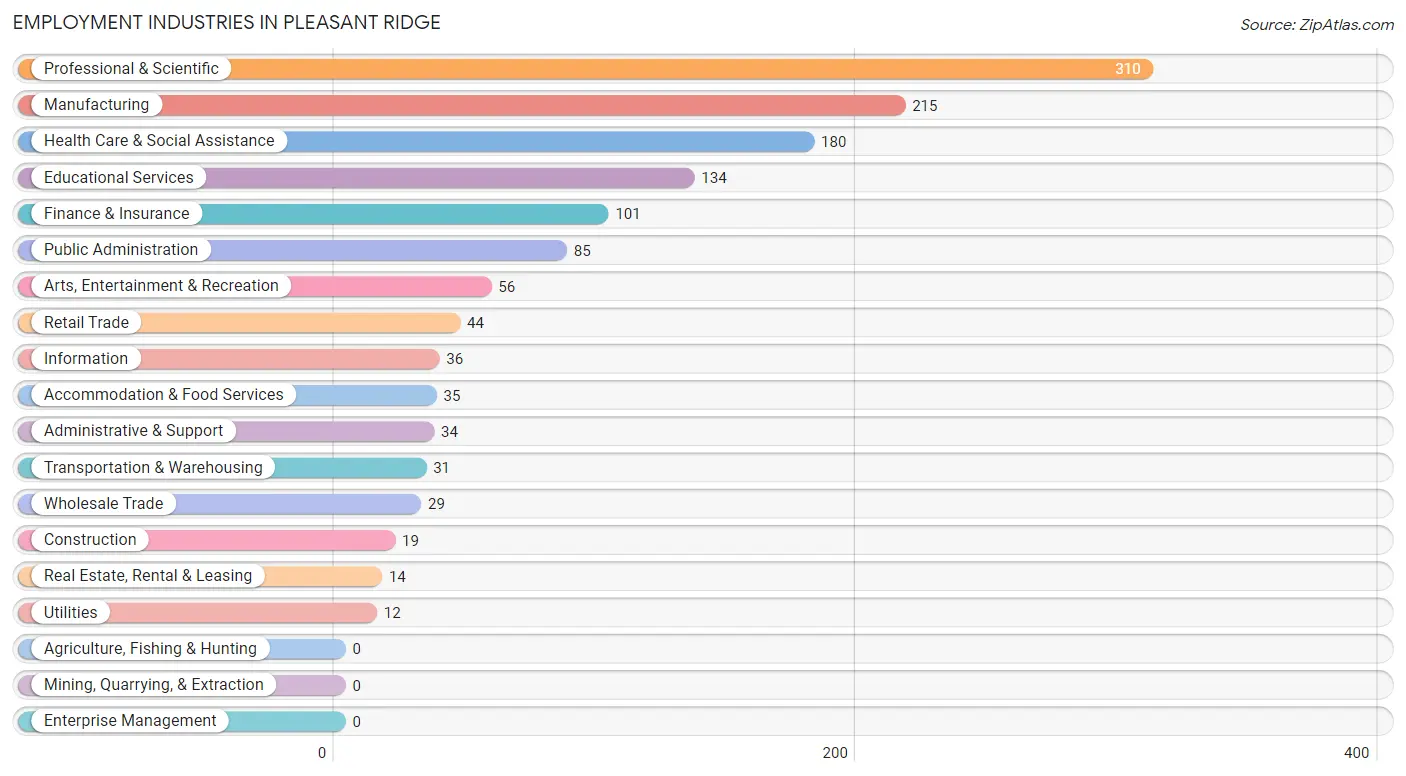
Employment Industries in Pleasant Ridge
The major employment industries in Pleasant Ridge include Professional & Scientific (310 | 21.7%), Manufacturing (215 | 15.1%), Health Care & Social Assistance (180 | 12.6%), Educational Services (134 | 9.4%), and Finance & Insurance (101 | 7.1%).
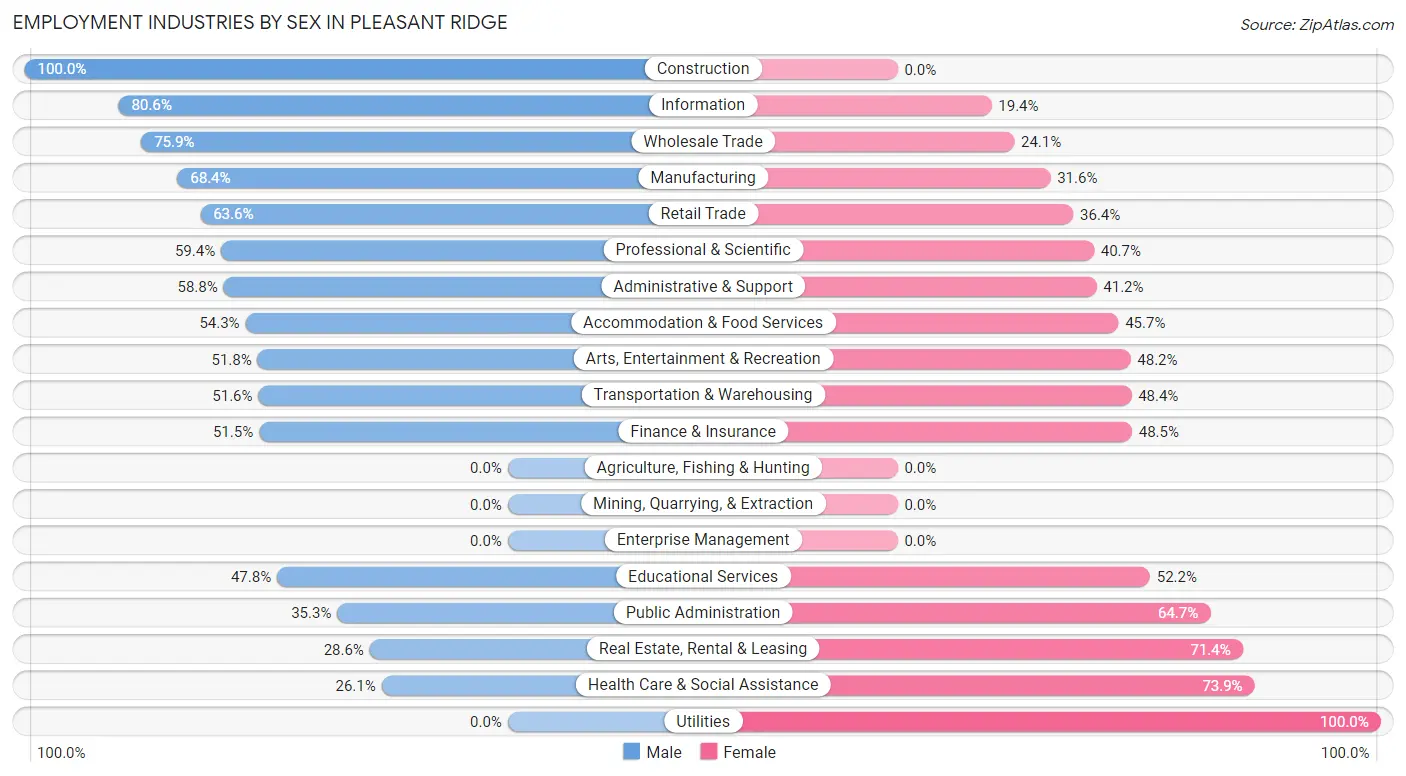
Employment Industries by Sex in Pleasant Ridge
The Pleasant Ridge industries that see more men than women are Construction (100.0%), Information (80.6%), and Wholesale Trade (75.9%), whereas the industries that tend to have a higher number of women are Utilities (100.0%), Health Care & Social Assistance (73.9%), and Real Estate, Rental & Leasing (71.4%).
| Industry | Male | Female |
| Agriculture, Fishing & Hunting | 0 (0.0%) | 0 (0.0%) |
| Mining, Quarrying, & Extraction | 0 (0.0%) | 0 (0.0%) |
| Construction | 19 (100.0%) | 0 (0.0%) |
| Manufacturing | 147 (68.4%) | 68 (31.6%) |
| Wholesale Trade | 22 (75.9%) | 7 (24.1%) |
| Retail Trade | 28 (63.6%) | 16 (36.4%) |
| Transportation & Warehousing | 16 (51.6%) | 15 (48.4%) |
| Utilities | 0 (0.0%) | 12 (100.0%) |
| Information | 29 (80.6%) | 7 (19.4%) |
| Finance & Insurance | 52 (51.5%) | 49 (48.5%) |
| Real Estate, Rental & Leasing | 4 (28.6%) | 10 (71.4%) |
| Professional & Scientific | 184 (59.4%) | 126 (40.6%) |
| Enterprise Management | 0 (0.0%) | 0 (0.0%) |
| Administrative & Support | 20 (58.8%) | 14 (41.2%) |
| Educational Services | 64 (47.8%) | 70 (52.2%) |
| Health Care & Social Assistance | 47 (26.1%) | 133 (73.9%) |
| Arts, Entertainment & Recreation | 29 (51.8%) | 27 (48.2%) |
| Accommodation & Food Services | 19 (54.3%) | 16 (45.7%) |
| Public Administration | 30 (35.3%) | 55 (64.7%) |
| Total | 762 (53.4%) | 664 (46.6%) |
Education in Pleasant Ridge
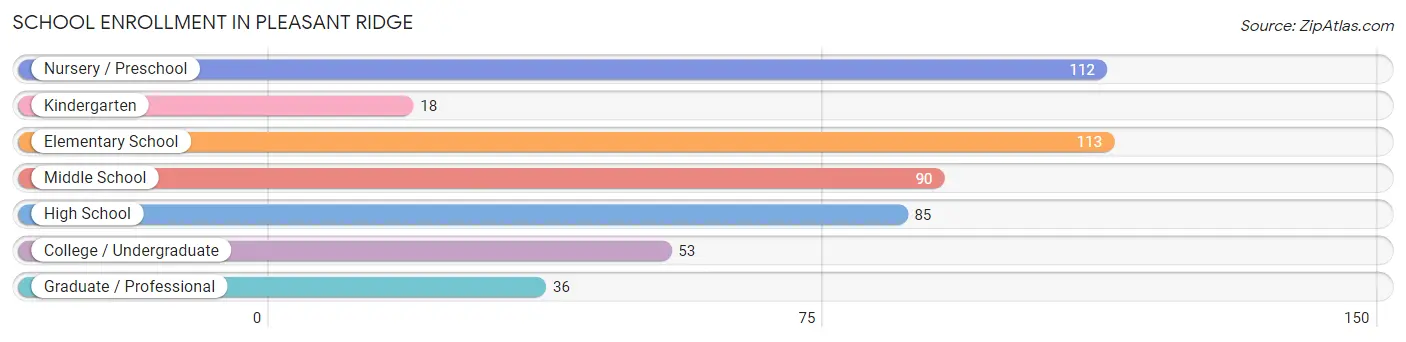
School Enrollment in Pleasant Ridge
The most common levels of schooling among the 507 students in Pleasant Ridge are elementary school (113 | 22.3%), nursery / preschool (112 | 22.1%), and middle school (90 | 17.7%).
| School Level | # Students | % Students |
| Nursery / Preschool | 112 | 22.1% |
| Kindergarten | 18 | 3.5% |
| Elementary School | 113 | 22.3% |
| Middle School | 90 | 17.7% |
| High School | 85 | 16.8% |
| College / Undergraduate | 53 | 10.4% |
| Graduate / Professional | 36 | 7.1% |
| Total | 507 | 100.0% |
School Enrollment by Age by Funding Source in Pleasant Ridge
Out of a total of 507 students who are enrolled in schools in Pleasant Ridge, 199 (39.3%) attend a private institution, while the remaining 308 (60.7%) are enrolled in public schools. The age group of 15 to 17 year olds has the highest likelihood of being enrolled in private schools, with 28 (90.3% in the age bracket) enrolled. Conversely, the age group of 18 to 19 year olds has the lowest likelihood of being enrolled in a private school, with 36 (83.7% in the age bracket) attending a public institution.
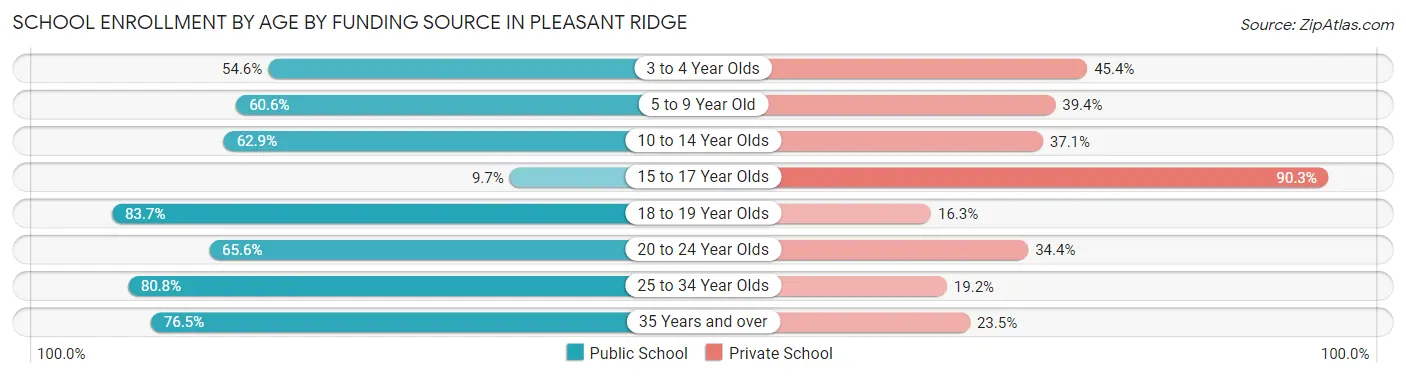
| Age Bracket | Public School | Private School |
| 3 to 4 Year Olds | 53 (54.6%) | 44 (45.4%) |
| 5 to 9 Year Old | 83 (60.6%) | 54 (39.4%) |
| 10 to 14 Year Olds | 78 (62.9%) | 46 (37.1%) |
| 15 to 17 Year Olds | 3 (9.7%) | 28 (90.3%) |
| 18 to 19 Year Olds | 36 (83.7%) | 7 (16.3%) |
| 20 to 24 Year Olds | 21 (65.6%) | 11 (34.4%) |
| 25 to 34 Year Olds | 21 (80.8%) | 5 (19.2%) |
| 35 Years and over | 13 (76.5%) | 4 (23.5%) |
| Total | 308 (60.7%) | 199 (39.3%) |
Educational Attainment by Field of Study in Pleasant Ridge
Business (269 | 15.9%), visual & performing arts (142 | 8.4%), engineering (135 | 8.0%), communications (132 | 7.8%), and bio, nature & agricultural (130 | 7.7%) are the most common fields of study among 1,696 individuals in Pleasant Ridge who have obtained a bachelor's degree or higher.
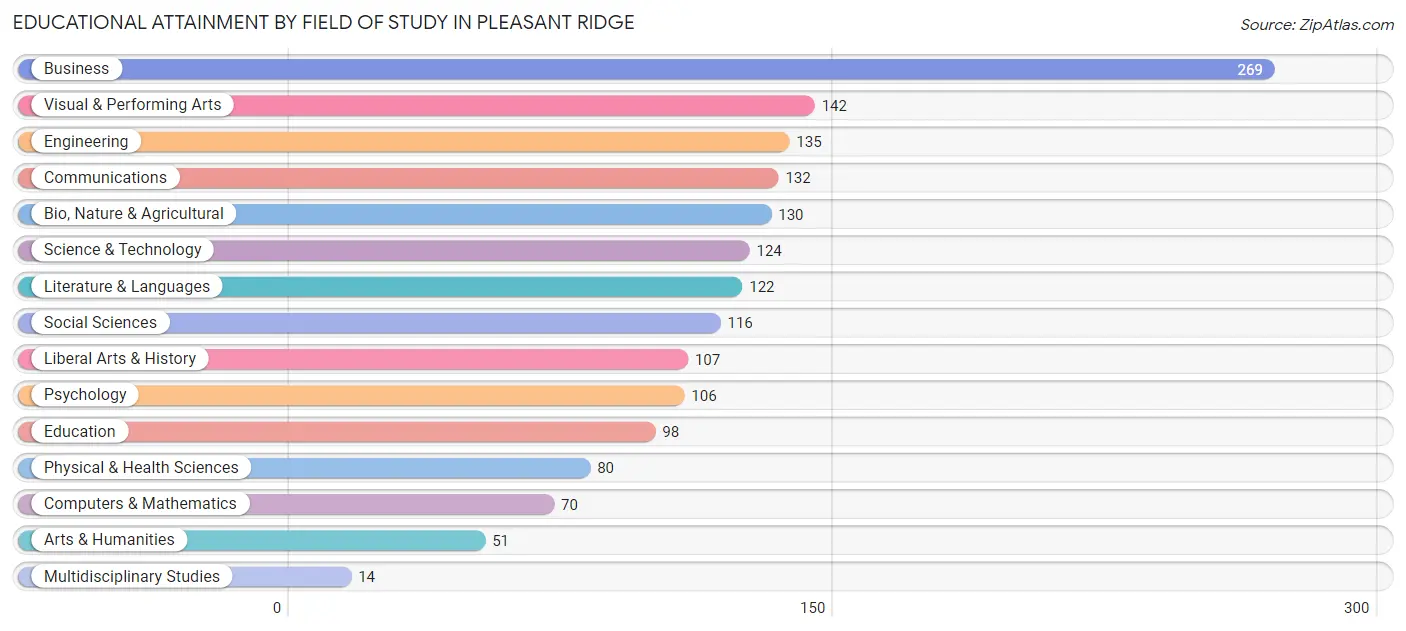
| Field of Study | # Graduates | % Graduates |
| Computers & Mathematics | 70 | 4.1% |
| Bio, Nature & Agricultural | 130 | 7.7% |
| Physical & Health Sciences | 80 | 4.7% |
| Psychology | 106 | 6.2% |
| Social Sciences | 116 | 6.8% |
| Engineering | 135 | 8.0% |
| Multidisciplinary Studies | 14 | 0.8% |
| Science & Technology | 124 | 7.3% |
| Business | 269 | 15.9% |
| Education | 98 | 5.8% |
| Literature & Languages | 122 | 7.2% |
| Liberal Arts & History | 107 | 6.3% |
| Visual & Performing Arts | 142 | 8.4% |
| Communications | 132 | 7.8% |
| Arts & Humanities | 51 | 3.0% |
| Total | 1,696 | 100.0% |
Transportation & Commute in Pleasant Ridge
Vehicle Availability by Sex in Pleasant Ridge
The most prevalent vehicle ownership categories in Pleasant Ridge are males with 2 vehicles (417, accounting for 55.0%) and females with 2 vehicles (328, making up 63.5%).
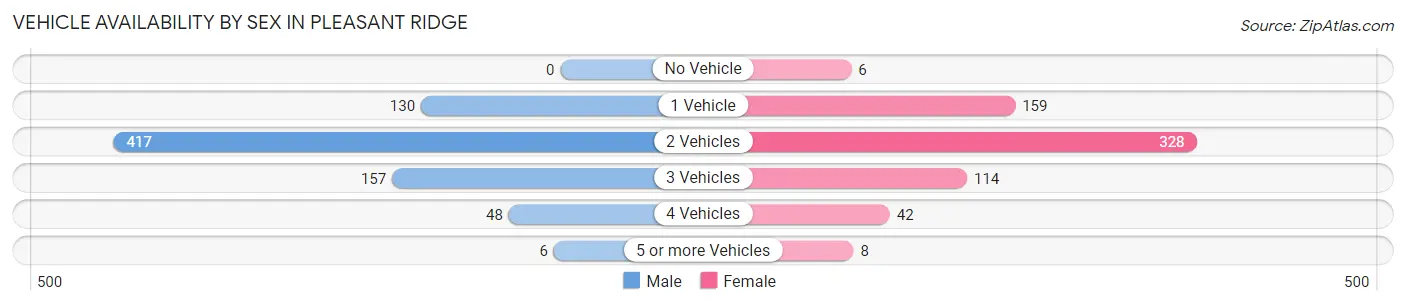
| Vehicles Available | Male | Female |
| No Vehicle | 0 (0.0%) | 6 (0.9%) |
| 1 Vehicle | 130 (17.2%) | 159 (24.2%) |
| 2 Vehicles | 417 (55.0%) | 328 (49.9%) |
| 3 Vehicles | 157 (20.7%) | 114 (17.3%) |
| 4 Vehicles | 48 (6.3%) | 42 (6.4%) |
| 5 or more Vehicles | 6 (0.8%) | 8 (1.2%) |
| Total | 758 (100.0%) | 657 (100.0%) |
Commute Time in Pleasant Ridge
The most frequently occuring commute durations in Pleasant Ridge are 20 to 24 minutes (208 commuters, 19.3%), 15 to 19 minutes (180 commuters, 16.7%), and 25 to 29 minutes (177 commuters, 16.4%).
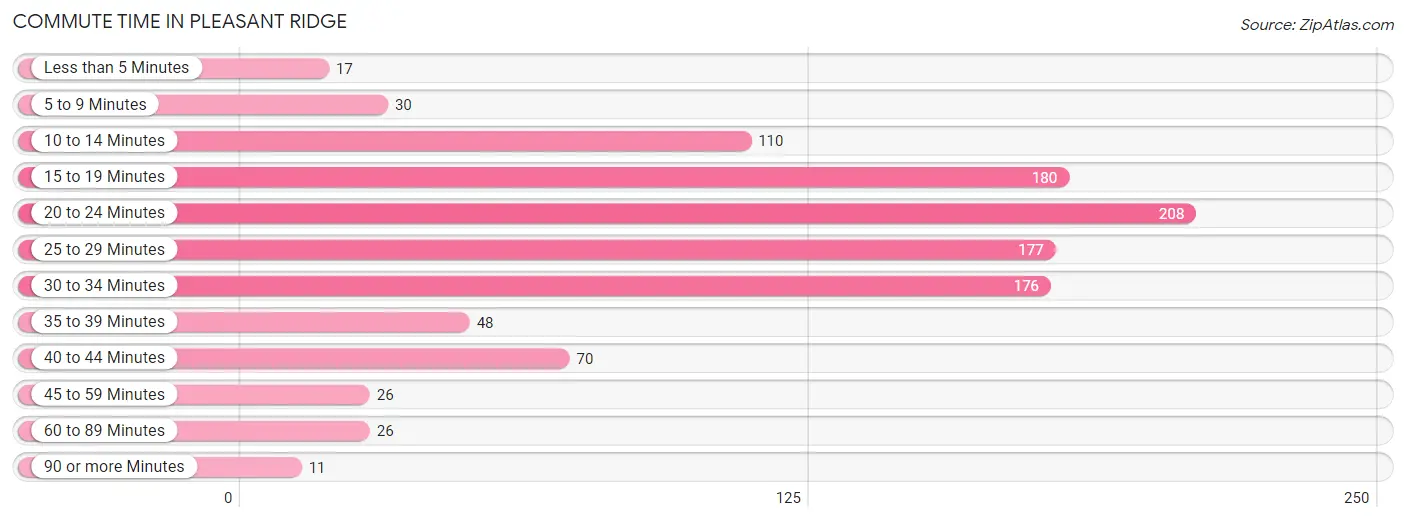
| Commute Time | # Commuters | % Commuters |
| Less than 5 Minutes | 17 | 1.6% |
| 5 to 9 Minutes | 30 | 2.8% |
| 10 to 14 Minutes | 110 | 10.2% |
| 15 to 19 Minutes | 180 | 16.7% |
| 20 to 24 Minutes | 208 | 19.3% |
| 25 to 29 Minutes | 177 | 16.4% |
| 30 to 34 Minutes | 176 | 16.3% |
| 35 to 39 Minutes | 48 | 4.4% |
| 40 to 44 Minutes | 70 | 6.5% |
| 45 to 59 Minutes | 26 | 2.4% |
| 60 to 89 Minutes | 26 | 2.4% |
| 90 or more Minutes | 11 | 1.0% |
Commute Time by Sex in Pleasant Ridge
The most common commute times in Pleasant Ridge are 25 to 29 minutes (133 commuters, 22.7%) for males and 15 to 19 minutes (120 commuters, 24.3%) for females.
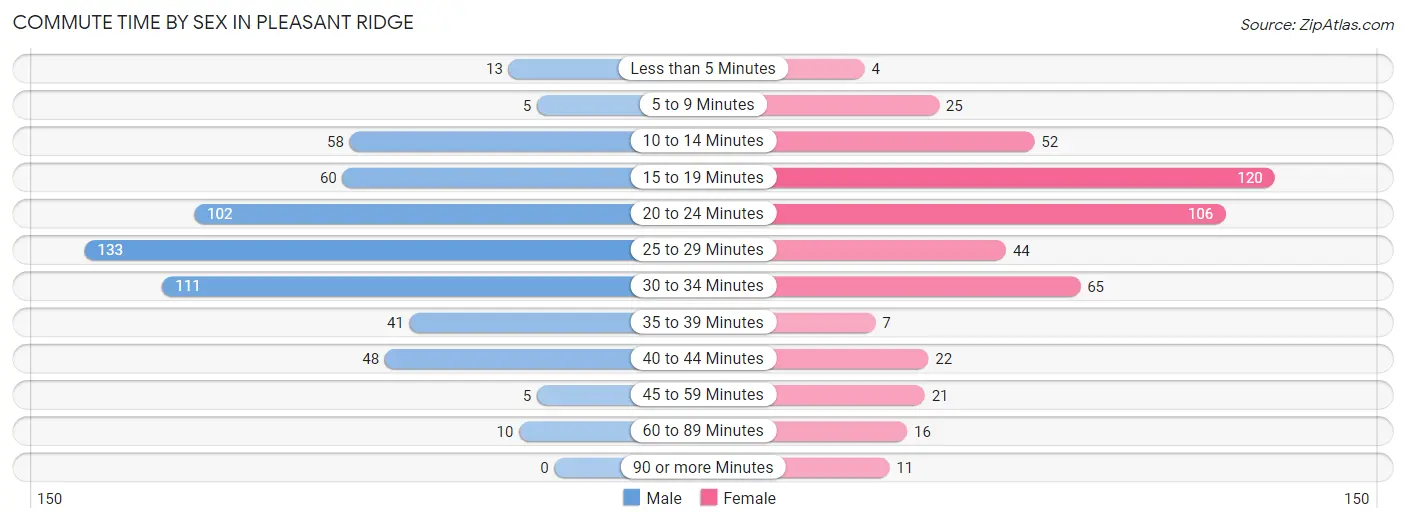
| Commute Time | Male | Female |
| Less than 5 Minutes | 13 (2.2%) | 4 (0.8%) |
| 5 to 9 Minutes | 5 (0.9%) | 25 (5.1%) |
| 10 to 14 Minutes | 58 (9.9%) | 52 (10.5%) |
| 15 to 19 Minutes | 60 (10.2%) | 120 (24.3%) |
| 20 to 24 Minutes | 102 (17.4%) | 106 (21.5%) |
| 25 to 29 Minutes | 133 (22.7%) | 44 (8.9%) |
| 30 to 34 Minutes | 111 (18.9%) | 65 (13.2%) |
| 35 to 39 Minutes | 41 (7.0%) | 7 (1.4%) |
| 40 to 44 Minutes | 48 (8.2%) | 22 (4.5%) |
| 45 to 59 Minutes | 5 (0.9%) | 21 (4.3%) |
| 60 to 89 Minutes | 10 (1.7%) | 16 (3.3%) |
| 90 or more Minutes | 0 (0.0%) | 11 (2.2%) |
Time of Departure to Work by Sex in Pleasant Ridge
The most frequent times of departure to work in Pleasant Ridge are 8:00 AM to 8:29 AM (110, 18.8%) for males and 7:30 AM to 7:59 AM (86, 17.4%) for females.
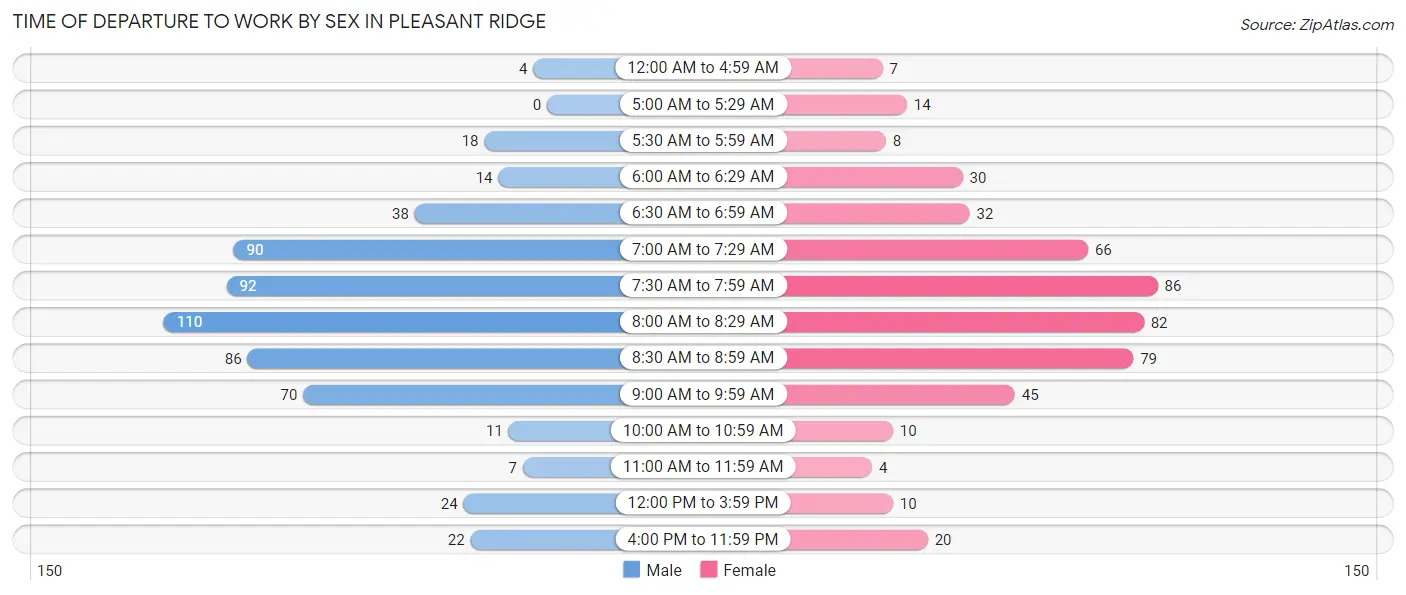
| Time of Departure | Male | Female |
| 12:00 AM to 4:59 AM | 4 (0.7%) | 7 (1.4%) |
| 5:00 AM to 5:29 AM | 0 (0.0%) | 14 (2.8%) |
| 5:30 AM to 5:59 AM | 18 (3.1%) | 8 (1.6%) |
| 6:00 AM to 6:29 AM | 14 (2.4%) | 30 (6.1%) |
| 6:30 AM to 6:59 AM | 38 (6.5%) | 32 (6.5%) |
| 7:00 AM to 7:29 AM | 90 (15.4%) | 66 (13.4%) |
| 7:30 AM to 7:59 AM | 92 (15.7%) | 86 (17.4%) |
| 8:00 AM to 8:29 AM | 110 (18.8%) | 82 (16.6%) |
| 8:30 AM to 8:59 AM | 86 (14.7%) | 79 (16.0%) |
| 9:00 AM to 9:59 AM | 70 (11.9%) | 45 (9.1%) |
| 10:00 AM to 10:59 AM | 11 (1.9%) | 10 (2.0%) |
| 11:00 AM to 11:59 AM | 7 (1.2%) | 4 (0.8%) |
| 12:00 PM to 3:59 PM | 24 (4.1%) | 10 (2.0%) |
| 4:00 PM to 11:59 PM | 22 (3.7%) | 20 (4.1%) |
| Total | 586 (100.0%) | 493 (100.0%) |
Housing Occupancy in Pleasant Ridge
Occupancy by Ownership in Pleasant Ridge
Of the total 1,149 dwellings in Pleasant Ridge, owner-occupied units account for 1,091 (95.0%), while renter-occupied units make up 58 (5.1%).
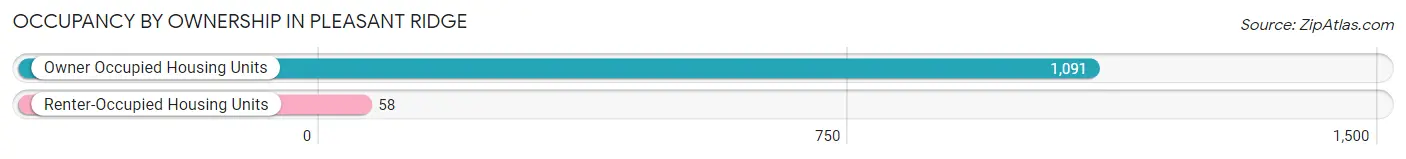
| Occupancy | # Housing Units | % Housing Units |
| Owner Occupied Housing Units | 1,091 | 95.0% |
| Renter-Occupied Housing Units | 58 | 5.1% |
| Total Occupied Housing Units | 1,149 | 100.0% |
Occupancy by Household Size in Pleasant Ridge
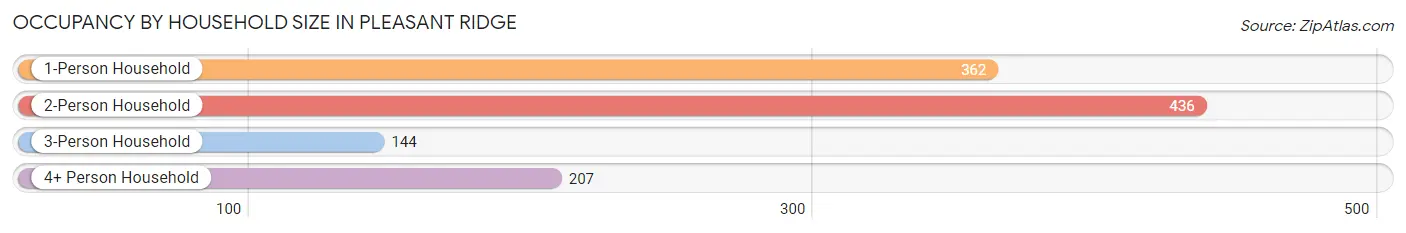
| Household Size | # Housing Units | % Housing Units |
| 1-Person Household | 362 | 31.5% |
| 2-Person Household | 436 | 38.0% |
| 3-Person Household | 144 | 12.5% |
| 4+ Person Household | 207 | 18.0% |
| Total Housing Units | 1,149 | 100.0% |
Occupancy by Ownership by Household Size in Pleasant Ridge
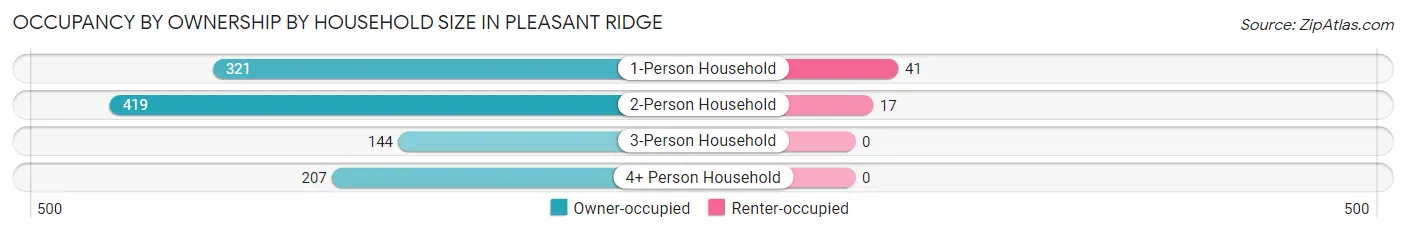
| Household Size | Owner-occupied | Renter-occupied |
| 1-Person Household | 321 (88.7%) | 41 (11.3%) |
| 2-Person Household | 419 (96.1%) | 17 (3.9%) |
| 3-Person Household | 144 (100.0%) | 0 (0.0%) |
| 4+ Person Household | 207 (100.0%) | 0 (0.0%) |
| Total Housing Units | 1,091 (95.0%) | 58 (5.1%) |
Occupancy by Educational Attainment in Pleasant Ridge
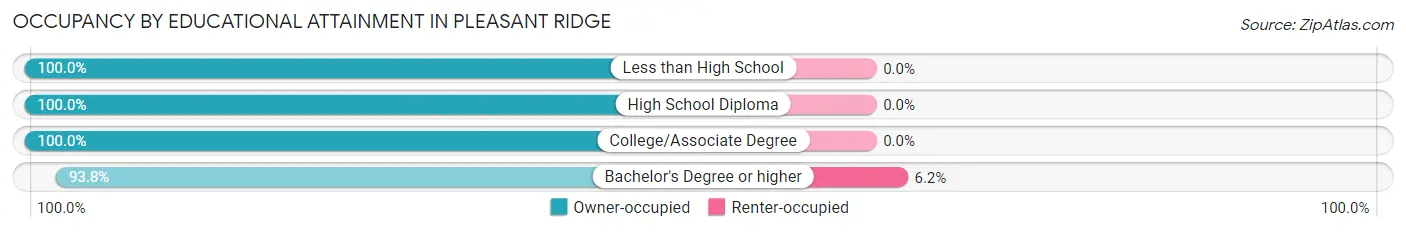
| Household Size | Owner-occupied | Renter-occupied |
| Less than High School | 4 (100.0%) | 0 (0.0%) |
| High School Diploma | 50 (100.0%) | 0 (0.0%) |
| College/Associate Degree | 163 (100.0%) | 0 (0.0%) |
| Bachelor's Degree or higher | 874 (93.8%) | 58 (6.2%) |
Occupancy by Age of Householder in Pleasant Ridge
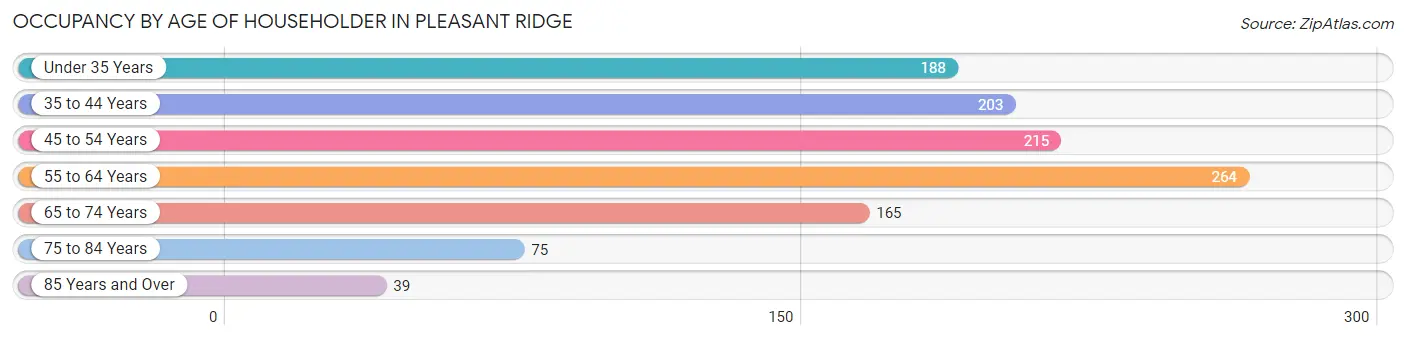
| Age Bracket | # Households | % Households |
| Under 35 Years | 188 | 16.4% |
| 35 to 44 Years | 203 | 17.7% |
| 45 to 54 Years | 215 | 18.7% |
| 55 to 64 Years | 264 | 23.0% |
| 65 to 74 Years | 165 | 14.4% |
| 75 to 84 Years | 75 | 6.5% |
| 85 Years and Over | 39 | 3.4% |
| Total | 1,149 | 100.0% |
Housing Finances in Pleasant Ridge
Median Income by Occupancy in Pleasant Ridge
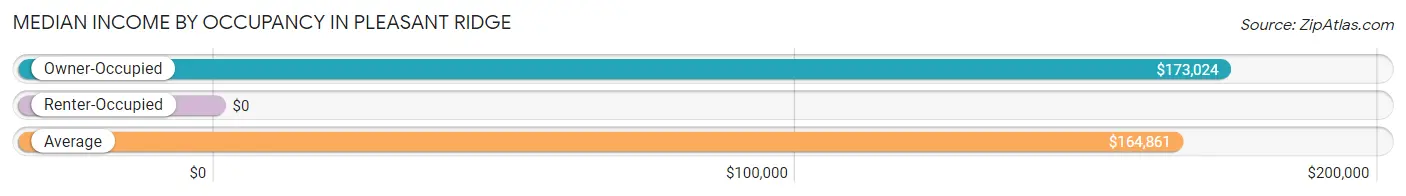
| Occupancy Type | # Households | Median Income |
| Owner-Occupied | 1,091 (95.0%) | $173,024 |
| Renter-Occupied | 58 (5.1%) | $0 |
| Average | 1,149 (100.0%) | $164,861 |
Occupancy by Householder Income Bracket in Pleasant Ridge
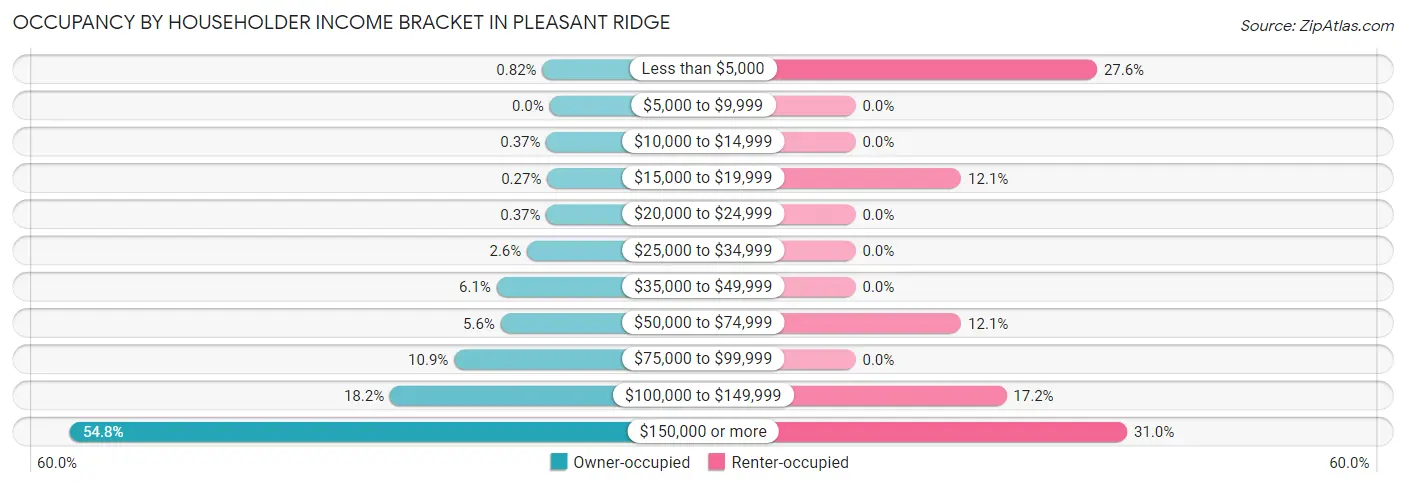
| Income Bracket | Owner-occupied | Renter-occupied |
| Less than $5,000 | 9 (0.8%) | 16 (27.6%) |
| $5,000 to $9,999 | 0 (0.0%) | 0 (0.0%) |
| $10,000 to $14,999 | 4 (0.4%) | 0 (0.0%) |
| $15,000 to $19,999 | 3 (0.3%) | 7 (12.1%) |
| $20,000 to $24,999 | 4 (0.4%) | 0 (0.0%) |
| $25,000 to $34,999 | 28 (2.6%) | 0 (0.0%) |
| $35,000 to $49,999 | 66 (6.0%) | 0 (0.0%) |
| $50,000 to $74,999 | 61 (5.6%) | 7 (12.1%) |
| $75,000 to $99,999 | 119 (10.9%) | 0 (0.0%) |
| $100,000 to $149,999 | 199 (18.2%) | 10 (17.2%) |
| $150,000 or more | 598 (54.8%) | 18 (31.0%) |
| Total | 1,091 (100.0%) | 58 (100.0%) |
Monthly Housing Cost Tiers in Pleasant Ridge
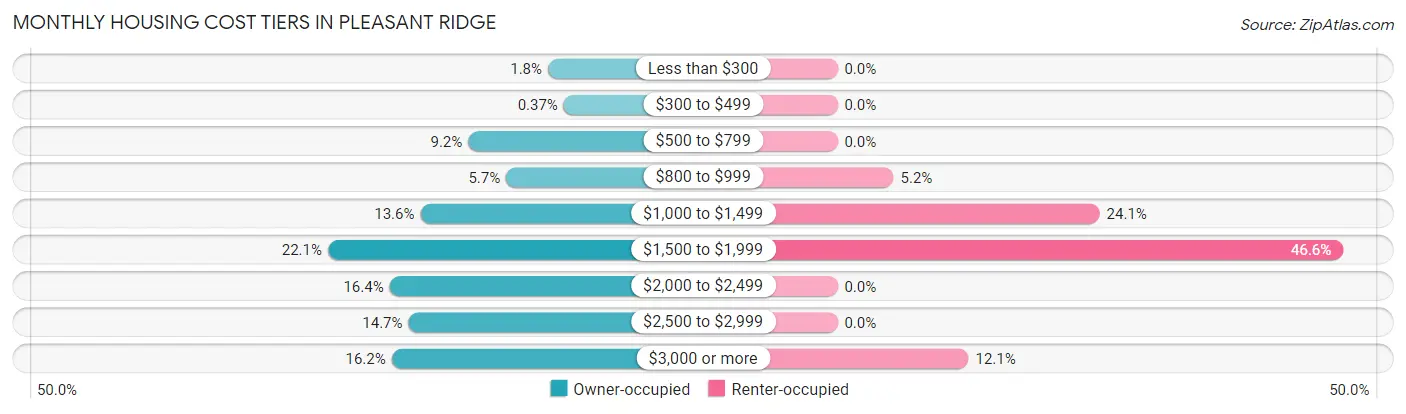
| Monthly Cost | Owner-occupied | Renter-occupied |
| Less than $300 | 20 (1.8%) | 0 (0.0%) |
| $300 to $499 | 4 (0.4%) | 0 (0.0%) |
| $500 to $799 | 100 (9.2%) | 0 (0.0%) |
| $800 to $999 | 62 (5.7%) | 3 (5.2%) |
| $1,000 to $1,499 | 148 (13.6%) | 14 (24.1%) |
| $1,500 to $1,999 | 241 (22.1%) | 27 (46.6%) |
| $2,000 to $2,499 | 179 (16.4%) | 0 (0.0%) |
| $2,500 to $2,999 | 160 (14.7%) | 0 (0.0%) |
| $3,000 or more | 177 (16.2%) | 7 (12.1%) |
| Total | 1,091 (100.0%) | 58 (100.0%) |
Physical Housing Characteristics in Pleasant Ridge
Housing Structures in Pleasant Ridge
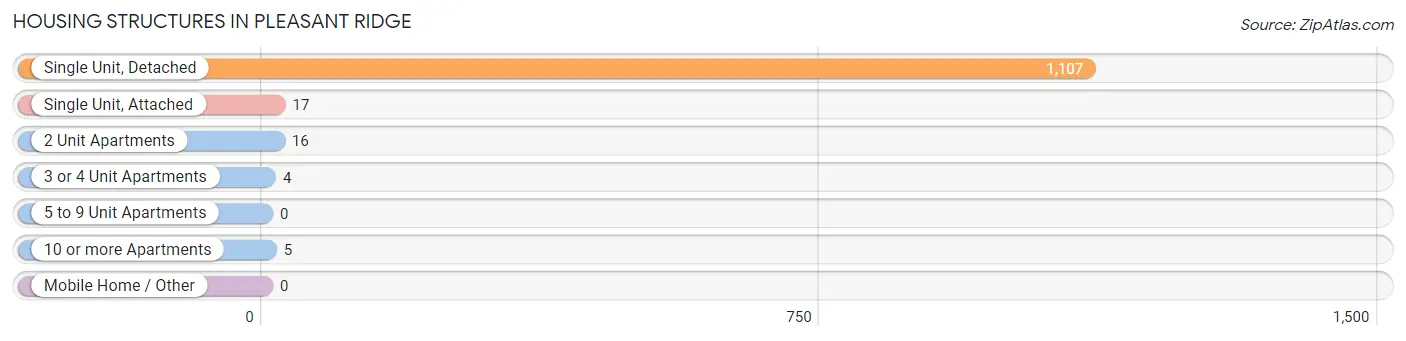
| Structure Type | # Housing Units | % Housing Units |
| Single Unit, Detached | 1,107 | 96.3% |
| Single Unit, Attached | 17 | 1.5% |
| 2 Unit Apartments | 16 | 1.4% |
| 3 or 4 Unit Apartments | 4 | 0.4% |
| 5 to 9 Unit Apartments | 0 | 0.0% |
| 10 or more Apartments | 5 | 0.4% |
| Mobile Home / Other | 0 | 0.0% |
| Total | 1,149 | 100.0% |
Housing Structures by Occupancy in Pleasant Ridge
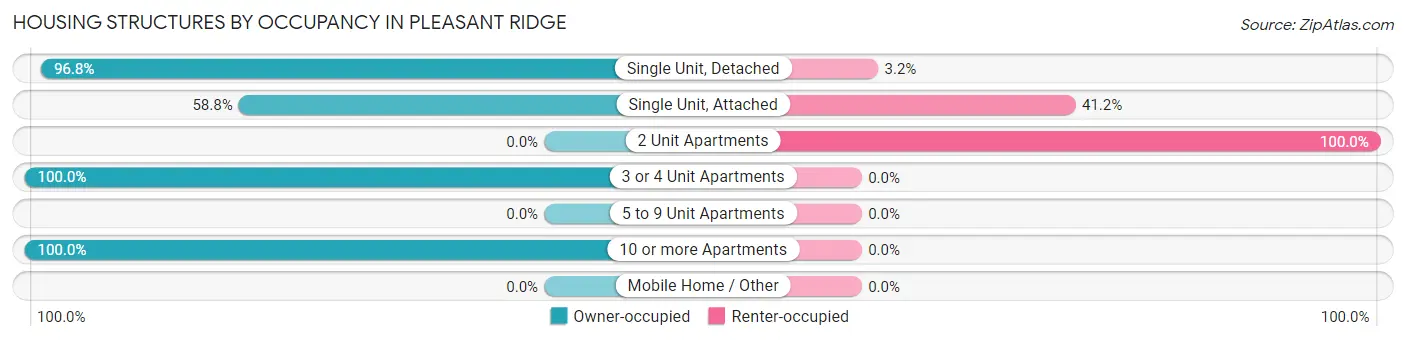
| Structure Type | Owner-occupied | Renter-occupied |
| Single Unit, Detached | 1,072 (96.8%) | 35 (3.2%) |
| Single Unit, Attached | 10 (58.8%) | 7 (41.2%) |
| 2 Unit Apartments | 0 (0.0%) | 16 (100.0%) |
| 3 or 4 Unit Apartments | 4 (100.0%) | 0 (0.0%) |
| 5 to 9 Unit Apartments | 0 (0.0%) | 0 (0.0%) |
| 10 or more Apartments | 5 (100.0%) | 0 (0.0%) |
| Mobile Home / Other | 0 (0.0%) | 0 (0.0%) |
| Total | 1,091 (95.0%) | 58 (5.1%) |
Housing Structures by Number of Rooms in Pleasant Ridge
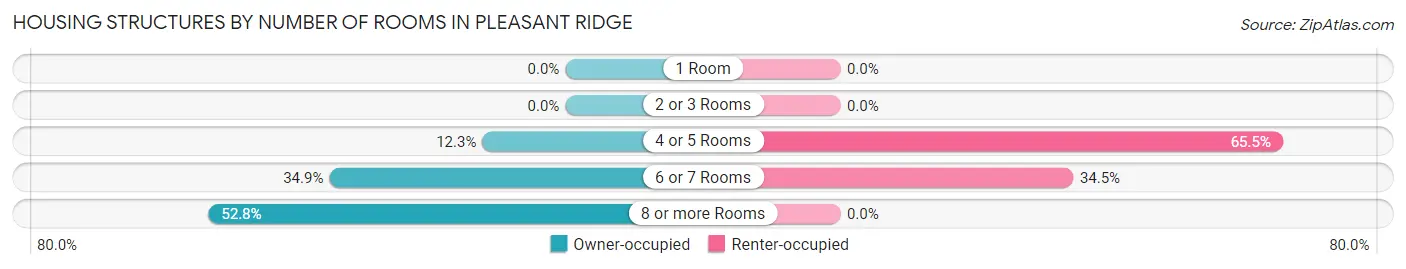
| Number of Rooms | Owner-occupied | Renter-occupied |
| 1 Room | 0 (0.0%) | 0 (0.0%) |
| 2 or 3 Rooms | 0 (0.0%) | 0 (0.0%) |
| 4 or 5 Rooms | 134 (12.3%) | 38 (65.5%) |
| 6 or 7 Rooms | 381 (34.9%) | 20 (34.5%) |
| 8 or more Rooms | 576 (52.8%) | 0 (0.0%) |
| Total | 1,091 (100.0%) | 58 (100.0%) |
Housing Structure by Heating Type in Pleasant Ridge
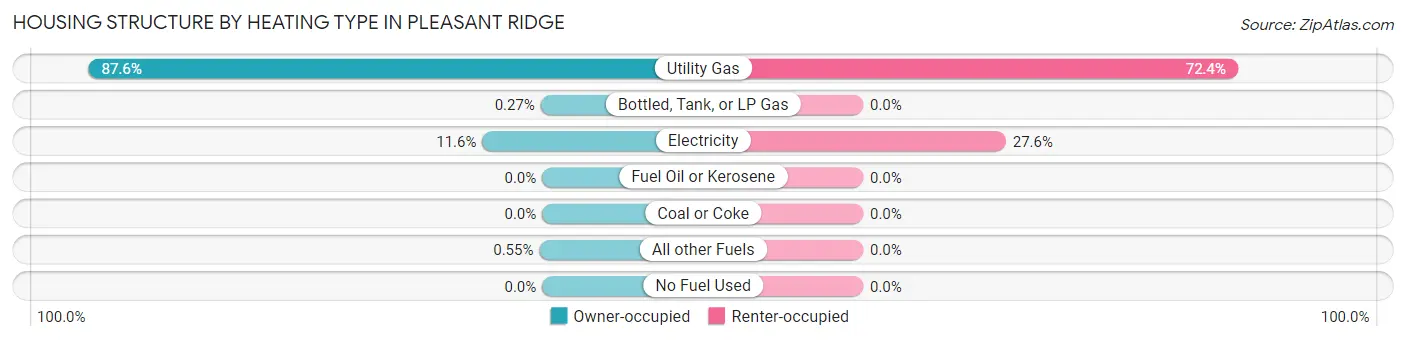
| Heating Type | Owner-occupied | Renter-occupied |
| Utility Gas | 956 (87.6%) | 42 (72.4%) |
| Bottled, Tank, or LP Gas | 3 (0.3%) | 0 (0.0%) |
| Electricity | 126 (11.6%) | 16 (27.6%) |
| Fuel Oil or Kerosene | 0 (0.0%) | 0 (0.0%) |
| Coal or Coke | 0 (0.0%) | 0 (0.0%) |
| All other Fuels | 6 (0.5%) | 0 (0.0%) |
| No Fuel Used | 0 (0.0%) | 0 (0.0%) |
| Total | 1,091 (100.0%) | 58 (100.0%) |
Household Vehicle Usage in Pleasant Ridge
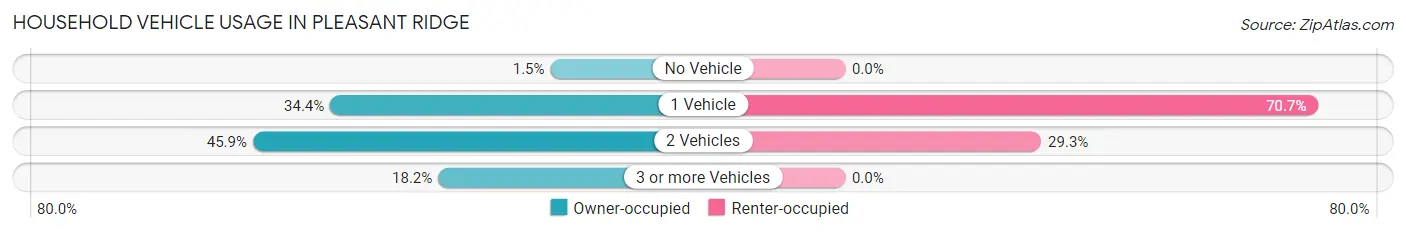
| Vehicles per Household | Owner-occupied | Renter-occupied |
| No Vehicle | 16 (1.5%) | 0 (0.0%) |
| 1 Vehicle | 375 (34.4%) | 41 (70.7%) |
| 2 Vehicles | 501 (45.9%) | 17 (29.3%) |
| 3 or more Vehicles | 199 (18.2%) | 0 (0.0%) |
| Total | 1,091 (100.0%) | 58 (100.0%) |
Real Estate & Mortgages in Pleasant Ridge
Real Estate and Mortgage Overview in Pleasant Ridge
| Characteristic | Without Mortgage | With Mortgage |
| Housing Units | 270 | 821 |
| Median Property Value | $391,400 | $394,600 |
| Median Household Income | $132,000 | $484 |
| Monthly Housing Costs | $842 | $177 |
| Real Estate Taxes | $6,105 | $4 |
Property Value by Mortgage Status in Pleasant Ridge
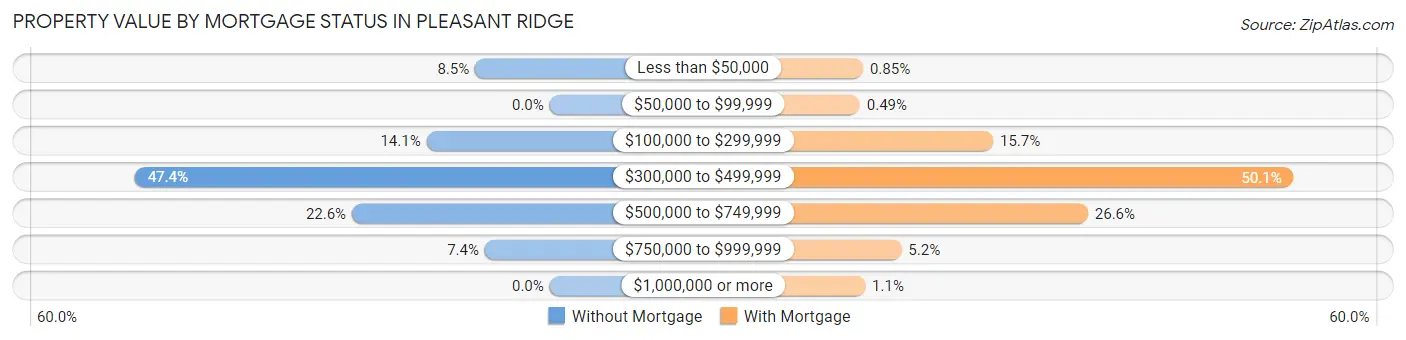
| Property Value | Without Mortgage | With Mortgage |
| Less than $50,000 | 23 (8.5%) | 7 (0.9%) |
| $50,000 to $99,999 | 0 (0.0%) | 4 (0.5%) |
| $100,000 to $299,999 | 38 (14.1%) | 129 (15.7%) |
| $300,000 to $499,999 | 128 (47.4%) | 411 (50.1%) |
| $500,000 to $749,999 | 61 (22.6%) | 218 (26.6%) |
| $750,000 to $999,999 | 20 (7.4%) | 43 (5.2%) |
| $1,000,000 or more | 0 (0.0%) | 9 (1.1%) |
| Total | 270 (100.0%) | 821 (100.0%) |
Household Income by Mortgage Status in Pleasant Ridge
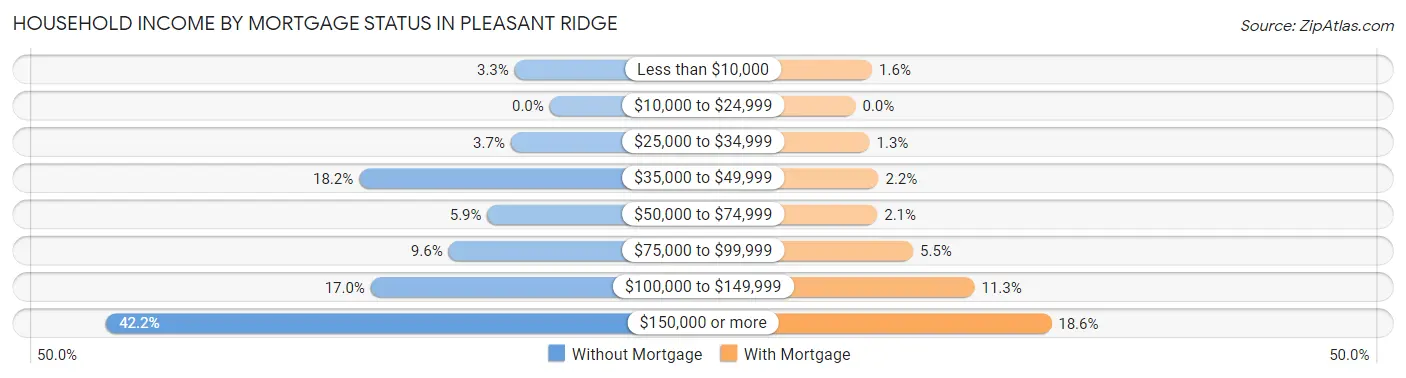
| Household Income | Without Mortgage | With Mortgage |
| Less than $10,000 | 9 (3.3%) | 13 (1.6%) |
| $10,000 to $24,999 | 0 (0.0%) | 0 (0.0%) |
| $25,000 to $34,999 | 10 (3.7%) | 11 (1.3%) |
| $35,000 to $49,999 | 49 (18.1%) | 18 (2.2%) |
| $50,000 to $74,999 | 16 (5.9%) | 17 (2.1%) |
| $75,000 to $99,999 | 26 (9.6%) | 45 (5.5%) |
| $100,000 to $149,999 | 46 (17.0%) | 93 (11.3%) |
| $150,000 or more | 114 (42.2%) | 153 (18.6%) |
| Total | 270 (100.0%) | 821 (100.0%) |
Property Value to Household Income Ratio in Pleasant Ridge
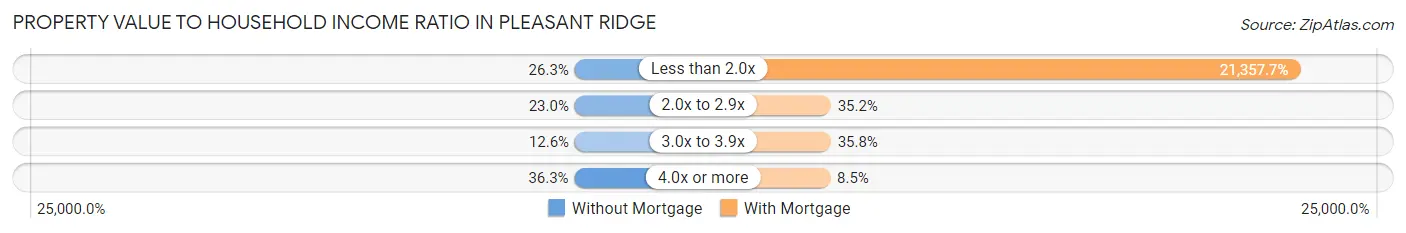
| Value-to-Income Ratio | Without Mortgage | With Mortgage |
| Less than 2.0x | 71 (26.3%) | 175,347 (21,357.7%) |
| 2.0x to 2.9x | 62 (23.0%) | 289 (35.2%) |
| 3.0x to 3.9x | 34 (12.6%) | 294 (35.8%) |
| 4.0x or more | 98 (36.3%) | 70 (8.5%) |
| Total | 270 (100.0%) | 821 (100.0%) |
Real Estate Taxes by Mortgage Status in Pleasant Ridge
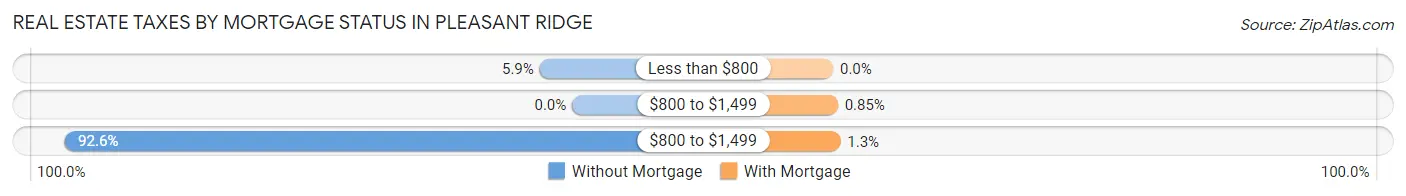
| Property Taxes | Without Mortgage | With Mortgage |
| Less than $800 | 16 (5.9%) | 0 (0.0%) |
| $800 to $1,499 | 0 (0.0%) | 7 (0.9%) |
| $800 to $1,499 | 250 (92.6%) | 11 (1.3%) |
| Total | 270 (100.0%) | 821 (100.0%) |
Health & Disability in Pleasant Ridge
Health Insurance Coverage by Age in Pleasant Ridge
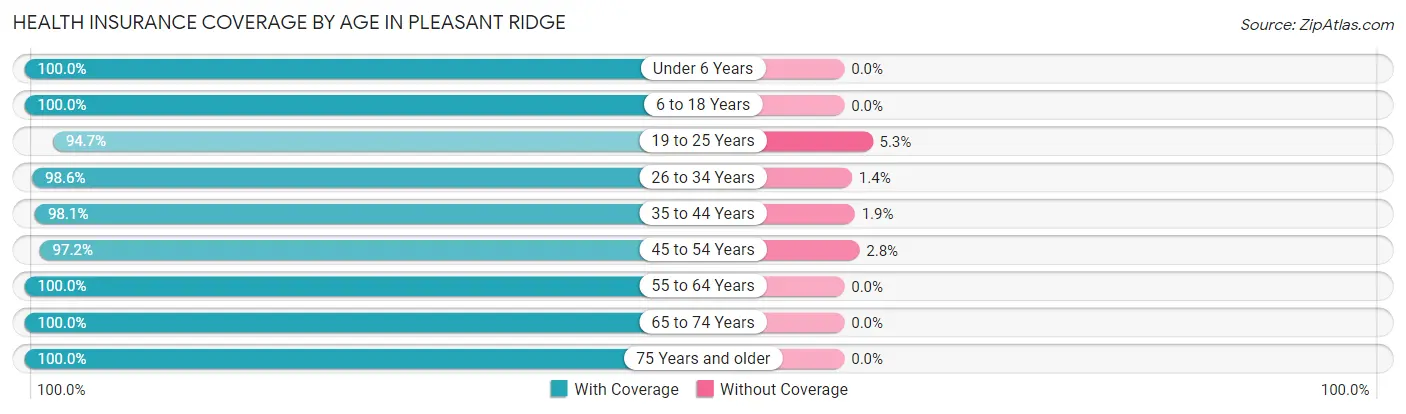
| Age Bracket | With Coverage | Without Coverage |
| Under 6 Years | 234 (100.0%) | 0 (0.0%) |
| 6 to 18 Years | 304 (100.0%) | 0 (0.0%) |
| 19 to 25 Years | 72 (94.7%) | 4 (5.3%) |
| 26 to 34 Years | 346 (98.6%) | 5 (1.4%) |
| 35 to 44 Years | 354 (98.1%) | 7 (1.9%) |
| 45 to 54 Years | 380 (97.2%) | 11 (2.8%) |
| 55 to 64 Years | 445 (100.0%) | 0 (0.0%) |
| 65 to 74 Years | 294 (100.0%) | 0 (0.0%) |
| 75 Years and older | 153 (100.0%) | 0 (0.0%) |
| Total | 2,582 (99.0%) | 27 (1.0%) |
Health Insurance Coverage by Citizenship Status in Pleasant Ridge
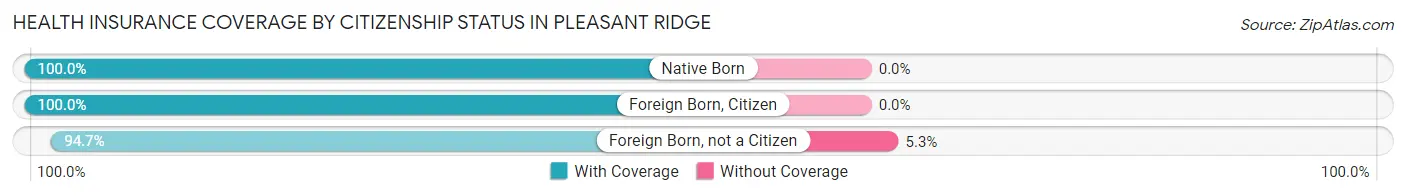
| Citizenship Status | With Coverage | Without Coverage |
| Native Born | 234 (100.0%) | 0 (0.0%) |
| Foreign Born, Citizen | 304 (100.0%) | 0 (0.0%) |
| Foreign Born, not a Citizen | 72 (94.7%) | 4 (5.3%) |
Health Insurance Coverage by Household Income in Pleasant Ridge
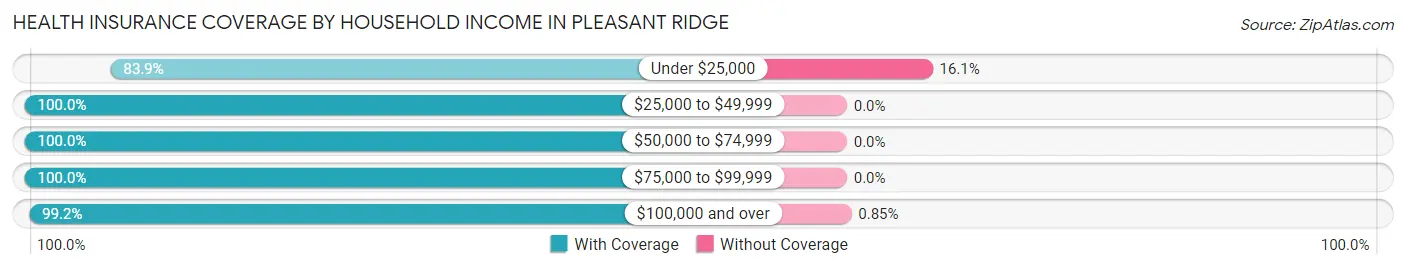
| Household Income | With Coverage | Without Coverage |
| Under $25,000 | 47 (83.9%) | 9 (16.1%) |
| $25,000 to $49,999 | 128 (100.0%) | 0 (0.0%) |
| $50,000 to $74,999 | 104 (100.0%) | 0 (0.0%) |
| $75,000 to $99,999 | 194 (100.0%) | 0 (0.0%) |
| $100,000 and over | 2,109 (99.2%) | 18 (0.9%) |
Public vs Private Health Insurance Coverage by Age in Pleasant Ridge
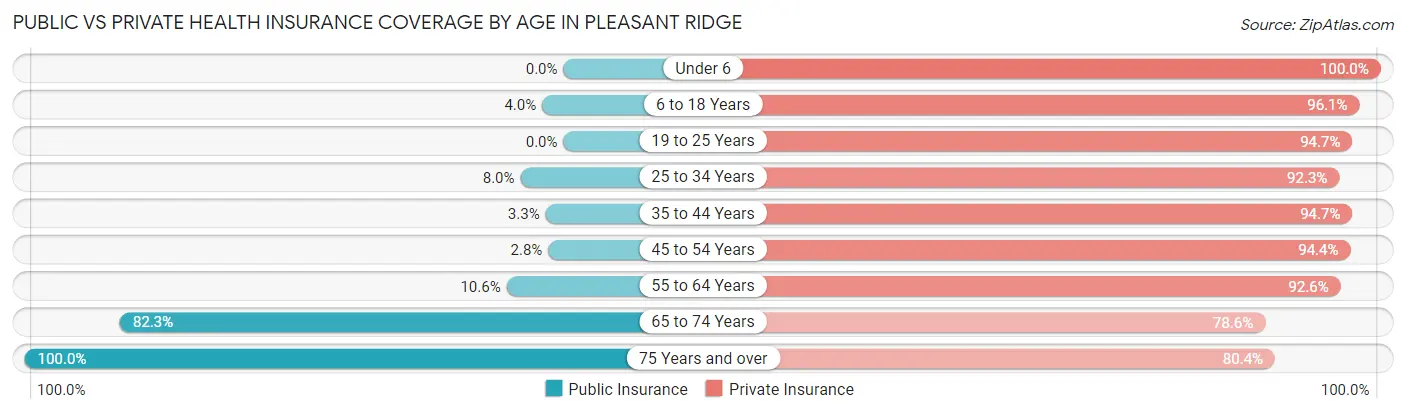
| Age Bracket | Public Insurance | Private Insurance |
| Under 6 | 0 (0.0%) | 234 (100.0%) |
| 6 to 18 Years | 12 (4.0%) | 292 (96.1%) |
| 19 to 25 Years | 0 (0.0%) | 72 (94.7%) |
| 25 to 34 Years | 28 (8.0%) | 324 (92.3%) |
| 35 to 44 Years | 12 (3.3%) | 342 (94.7%) |
| 45 to 54 Years | 11 (2.8%) | 369 (94.4%) |
| 55 to 64 Years | 47 (10.6%) | 412 (92.6%) |
| 65 to 74 Years | 242 (82.3%) | 231 (78.6%) |
| 75 Years and over | 153 (100.0%) | 123 (80.4%) |
| Total | 505 (19.4%) | 2,399 (91.9%) |
Disability Status by Sex by Age in Pleasant Ridge
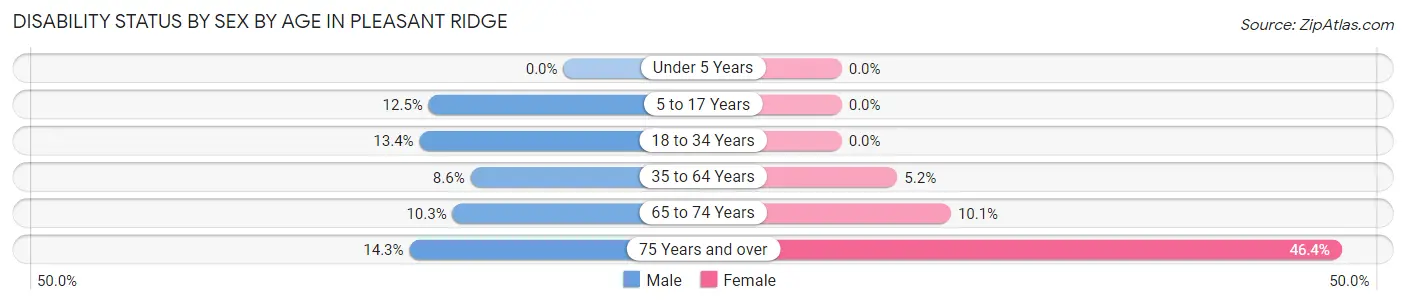
| Age Bracket | Male | Female |
| Under 5 Years | 0 (0.0%) | 0 (0.0%) |
| 5 to 17 Years | 15 (12.5%) | 0 (0.0%) |
| 18 to 34 Years | 37 (13.4%) | 0 (0.0%) |
| 35 to 64 Years | 48 (8.6%) | 33 (5.2%) |
| 65 to 74 Years | 14 (10.3%) | 16 (10.1%) |
| 75 Years and over | 8 (14.3%) | 45 (46.4%) |
Disability Class by Sex by Age in Pleasant Ridge
Disability Class: Hearing Difficulty
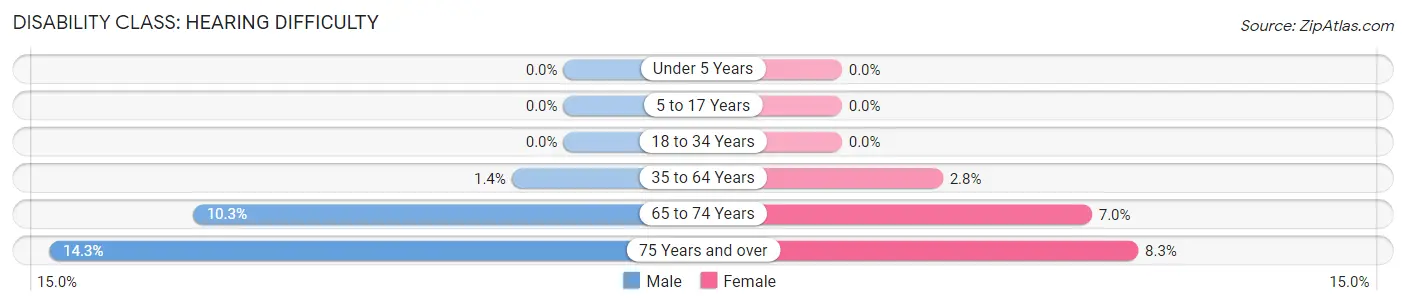
| Age Bracket | Male | Female |
| Under 5 Years | 0 (0.0%) | 0 (0.0%) |
| 5 to 17 Years | 0 (0.0%) | 0 (0.0%) |
| 18 to 34 Years | 0 (0.0%) | 0 (0.0%) |
| 35 to 64 Years | 8 (1.4%) | 18 (2.8%) |
| 65 to 74 Years | 14 (10.3%) | 11 (7.0%) |
| 75 Years and over | 8 (14.3%) | 8 (8.3%) |
Disability Class: Vision Difficulty
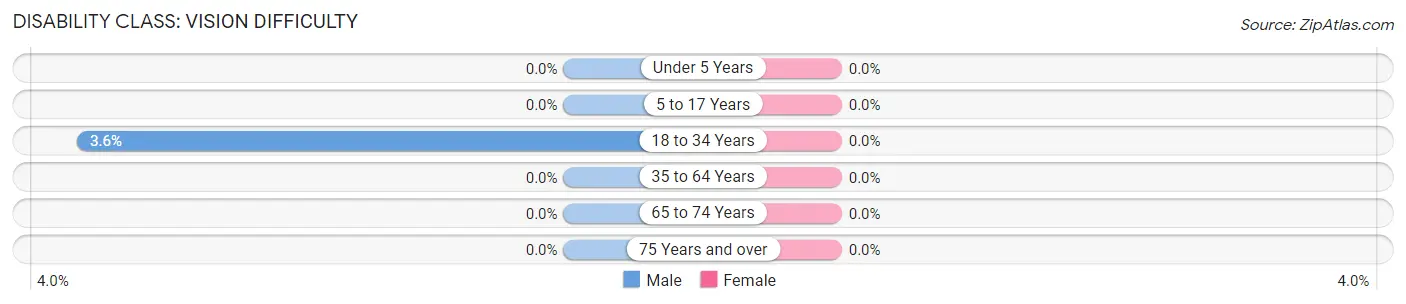
| Age Bracket | Male | Female |
| Under 5 Years | 0 (0.0%) | 0 (0.0%) |
| 5 to 17 Years | 0 (0.0%) | 0 (0.0%) |
| 18 to 34 Years | 10 (3.6%) | 0 (0.0%) |
| 35 to 64 Years | 0 (0.0%) | 0 (0.0%) |
| 65 to 74 Years | 0 (0.0%) | 0 (0.0%) |
| 75 Years and over | 0 (0.0%) | 0 (0.0%) |
Disability Class: Cognitive Difficulty
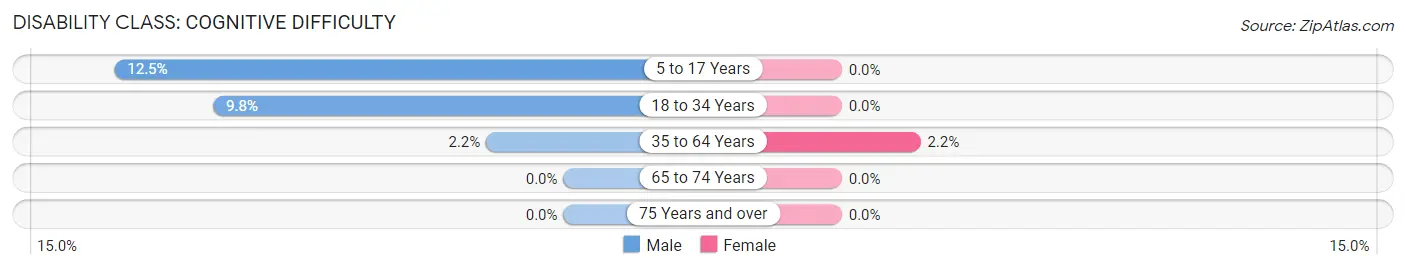
| Age Bracket | Male | Female |
| 5 to 17 Years | 15 (12.5%) | 0 (0.0%) |
| 18 to 34 Years | 27 (9.8%) | 0 (0.0%) |
| 35 to 64 Years | 12 (2.1%) | 14 (2.2%) |
| 65 to 74 Years | 0 (0.0%) | 0 (0.0%) |
| 75 Years and over | 0 (0.0%) | 0 (0.0%) |
Disability Class: Ambulatory Difficulty
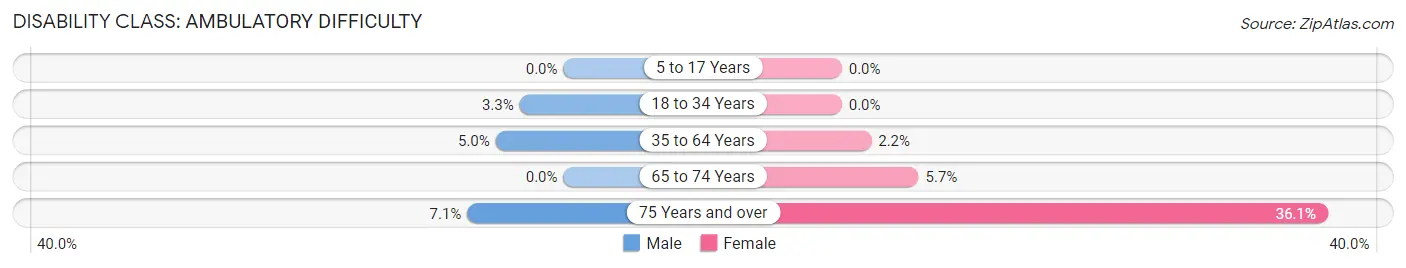
| Age Bracket | Male | Female |
| 5 to 17 Years | 0 (0.0%) | 0 (0.0%) |
| 18 to 34 Years | 9 (3.3%) | 0 (0.0%) |
| 35 to 64 Years | 28 (5.0%) | 14 (2.2%) |
| 65 to 74 Years | 0 (0.0%) | 9 (5.7%) |
| 75 Years and over | 4 (7.1%) | 35 (36.1%) |
Disability Class: Self-Care Difficulty
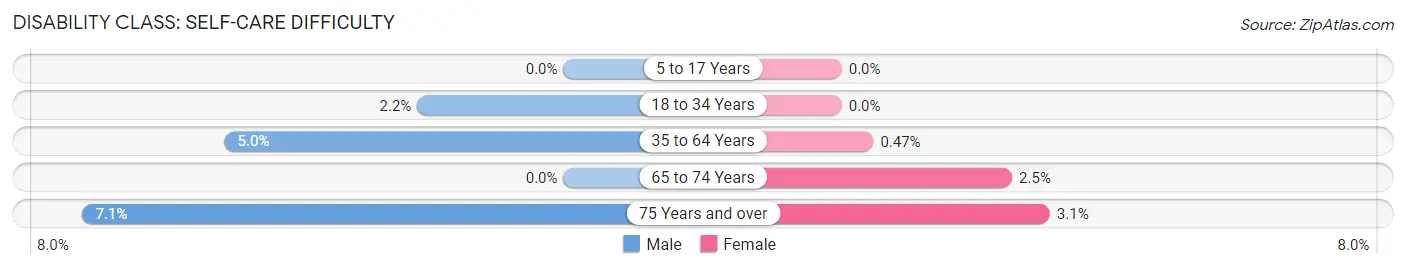
| Age Bracket | Male | Female |
| 5 to 17 Years | 0 (0.0%) | 0 (0.0%) |
| 18 to 34 Years | 6 (2.2%) | 0 (0.0%) |
| 35 to 64 Years | 28 (5.0%) | 3 (0.5%) |
| 65 to 74 Years | 0 (0.0%) | 4 (2.5%) |
| 75 Years and over | 4 (7.1%) | 3 (3.1%) |
Technology Access in Pleasant Ridge
Computing Device Access in Pleasant Ridge
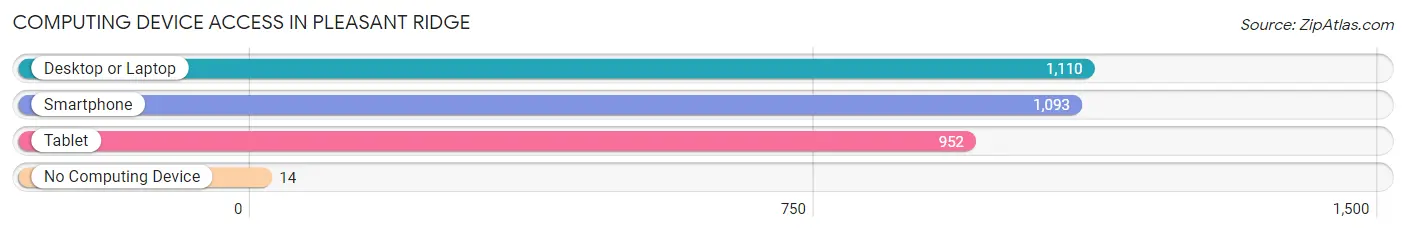
| Device Type | # Households | % Households |
| Desktop or Laptop | 1,110 | 96.6% |
| Smartphone | 1,093 | 95.1% |
| Tablet | 952 | 82.9% |
| No Computing Device | 14 | 1.2% |
| Total | 1,149 | 100.0% |
Internet Access in Pleasant Ridge
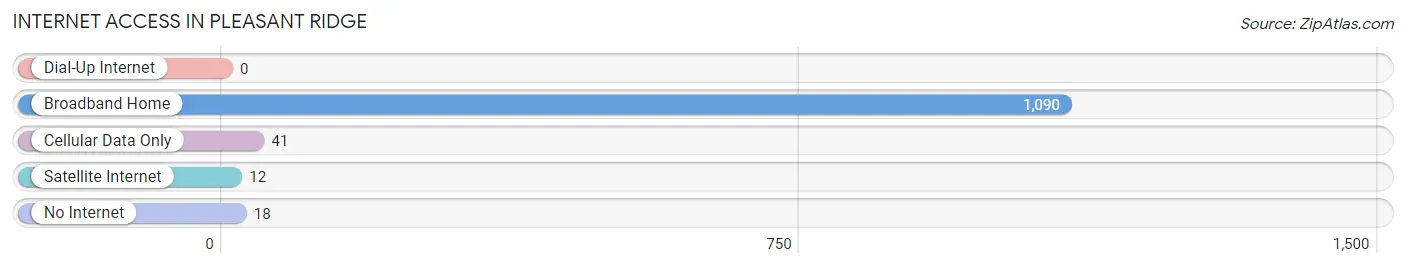
| Internet Type | # Households | % Households |
| Dial-Up Internet | 0 | 0.0% |
| Broadband Home | 1,090 | 94.9% |
| Cellular Data Only | 41 | 3.6% |
| Satellite Internet | 12 | 1.0% |
| No Internet | 18 | 1.6% |
| Total | 1,149 | 100.0% |
Pleasant Ridge Summary
Pleasant Ridge is a city located in Oakland County, Michigan. It is a suburb of Detroit and is part of the Metro Detroit area. The city is located in the northwest corner of the county, bordered by the cities of Royal Oak, Huntington Woods, and Oak Park. As of the 2010 census, the city had a population of 4,547.
History
The area that is now Pleasant Ridge was originally inhabited by the Potawatomi Native Americans. The first European settlers arrived in the area in the early 1800s. The area was originally known as "Ridgeville" and was part of Royal Oak Township. In 1891, the area was incorporated as the Village of Pleasant Ridge. The village was named after the ridge that runs through the area.
In the early 1900s, the village began to grow and develop. The population increased from just over 500 in 1910 to over 1,000 in 1920. The village was officially incorporated as a city in 1925.
Geography
Pleasant Ridge is located at 42°27'N 83°7'W (42.45, -83.12). According to the United States Census Bureau, the city has a total area of 1.2 square miles (3.1 km2), all land.
The city is located in the northwest corner of Oakland County, bordered by the cities of Royal Oak, Huntington Woods, and Oak Park. The city is located on a ridge that runs through the area, hence the name. The city is located approximately 10 miles (16 km) north of downtown Detroit.
Economy
Pleasant Ridge is a primarily residential community. The city does not have any major industries or businesses. The city's economy is largely based on the service industry, with many residents commuting to nearby cities for work.
Demographics
As of the 2010 census, there were 4,547 people, 1,945 households, and 1,093 families residing in the city. The population density was 3,817.3 people per square mile (1,475.2/km2). There were 2,072 housing units at an average density of 1,717.2 per square mile (662.3/km2). The racial makeup of the city was 92.2% White, 3.2% African American, 0.2% Native American, 1.7% Asian, 0.1% Pacific Islander, 0.7% from other races, and 2.0% from two or more races. Hispanic or Latino of any race were 2.7% of the population.
There were 1,945 households, out of which 25.2% had children under the age of 18 living with them, 43.2% were married couples living together, 10.2% had a female householder with no husband present, and 42.7% were non-families. 36.2% of all households were made up of individuals, and 11.2% had someone living alone who was 65 years of age or older. The average household size was 2.25 and the average family size was 3.02.
In the city, the population was spread out, with 21.2% under the age of 18, 6.2% from 18 to 24, 28.2% from 25 to 44, 28.2% from 45 to 64, and 16.2% who were 65 years of age or older. The median age was 41 years. For every 100 females, there were 91.2 males. For every 100 females age 18 and over, there were 88.2 males.
The median income for a household in the city was $50,938, and the median income for a family was $62,917. Males had a median income of $45,938 versus $35,938 for females. The per capita income for the city was $27,938. About 4.2% of families and 5.2% of the population were below the poverty line, including 6.2% of those under age 18 and 4.2% of those age 65 or over.
Common Questions
What is Per Capita Income in Pleasant Ridge?
Per Capita income in Pleasant Ridge is $84,370.
What is the Median Family Income in Pleasant Ridge?
Median Family Income in Pleasant Ridge is $195,278.
What is the Median Household income in Pleasant Ridge?
Median Household Income in Pleasant Ridge is $164,861.
What is Income or Wage Gap in Pleasant Ridge?
Income or Wage Gap in Pleasant Ridge is 25.9%.
Women in Pleasant Ridge earn 74.1 cents for every dollar earned by a man.
What is Inequality or Gini Index in Pleasant Ridge?
Inequality or Gini Index in Pleasant Ridge is 0.39.
What is the Total Population of Pleasant Ridge?
Total Population of Pleasant Ridge is 2,609.
What is the Total Male Population of Pleasant Ridge?
Total Male Population of Pleasant Ridge is 1,288.
What is the Total Female Population of Pleasant Ridge?
Total Female Population of Pleasant Ridge is 1,321.
What is the Ratio of Males per 100 Females in Pleasant Ridge?
There are 97.50 Males per 100 Females in Pleasant Ridge.
What is the Ratio of Females per 100 Males in Pleasant Ridge?
There are 102.56 Females per 100 Males in Pleasant Ridge.
What is the Median Population Age in Pleasant Ridge?
Median Population Age in Pleasant Ridge is 43.9 Years.
What is the Average Family Size in Pleasant Ridge
Average Family Size in Pleasant Ridge is 3.0 People.
What is the Average Household Size in Pleasant Ridge
Average Household Size in Pleasant Ridge is 2.3 People.
How Large is the Labor Force in Pleasant Ridge?
There are 1,528 People in the Labor Forcein in Pleasant Ridge.
What is the Percentage of People in the Labor Force in Pleasant Ridge?
72.0% of People are in the Labor Force in Pleasant Ridge.
What is the Unemployment Rate in Pleasant Ridge?
Unemployment Rate in Pleasant Ridge is 6.7%.