Indian River, MI Map & Demographics
Indian River Map
Indian River Overview
$42,276
PER CAPITA INCOME
$85,375
AVG FAMILY INCOME
$57,148
AVG HOUSEHOLD INCOME
0.50
INEQUALITY / GINI INDEX
2,076
TOTAL POPULATION
1,051
MALE POPULATION
1,025
FEMALE POPULATION
102.54
MALES / 100 FEMALES
97.53
FEMALES / 100 MALES
59.1
MEDIAN AGE
2.7
AVG FAMILY SIZE
2.0
AVG HOUSEHOLD SIZE
989
LABOR FORCE [ PEOPLE ]
51.2%
PERCENT IN LABOR FORCE
4.1%
UNEMPLOYMENT RATE
Indian River Zip Codes
Indian River Area Codes
Income in Indian River
Income Overview in Indian River
Per Capita Income in Indian River is $42,276, while median incomes of families and households are $85,375 and $57,148 respectively.
| Characteristic | Number | Measure |
| Per Capita Income | 2,076 | $42,276 |
| Median Family Income | 511 | $85,375 |
| Mean Family Income | 511 | $111,841 |
| Median Household Income | 1,013 | $57,148 |
| Mean Household Income | 1,013 | $84,344 |
| Income Deficit | 511 | $0 |
| Wage / Income Gap (%) | 2,076 | 0.00% |
| Wage / Income Gap ($) | 2,076 | 100.00¢ per $1 |
| Gini / Inequality Index | 2,076 | 0.50 |
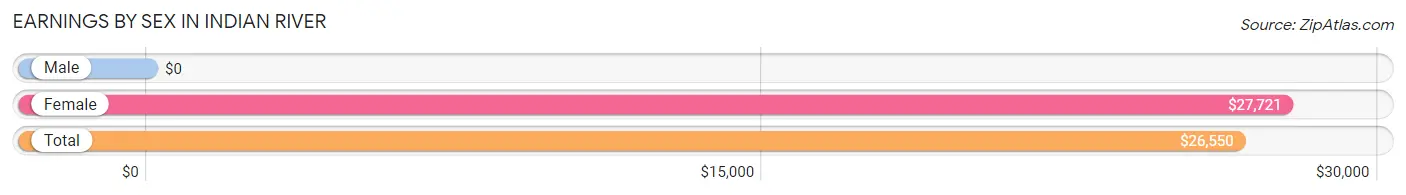
Earnings by Sex in Indian River
| Sex | Number | Average Earnings |
| Male | 536 (54.2%) | $0 |
| Female | 453 (45.8%) | $27,721 |
| Total | 989 (100.0%) | $26,550 |
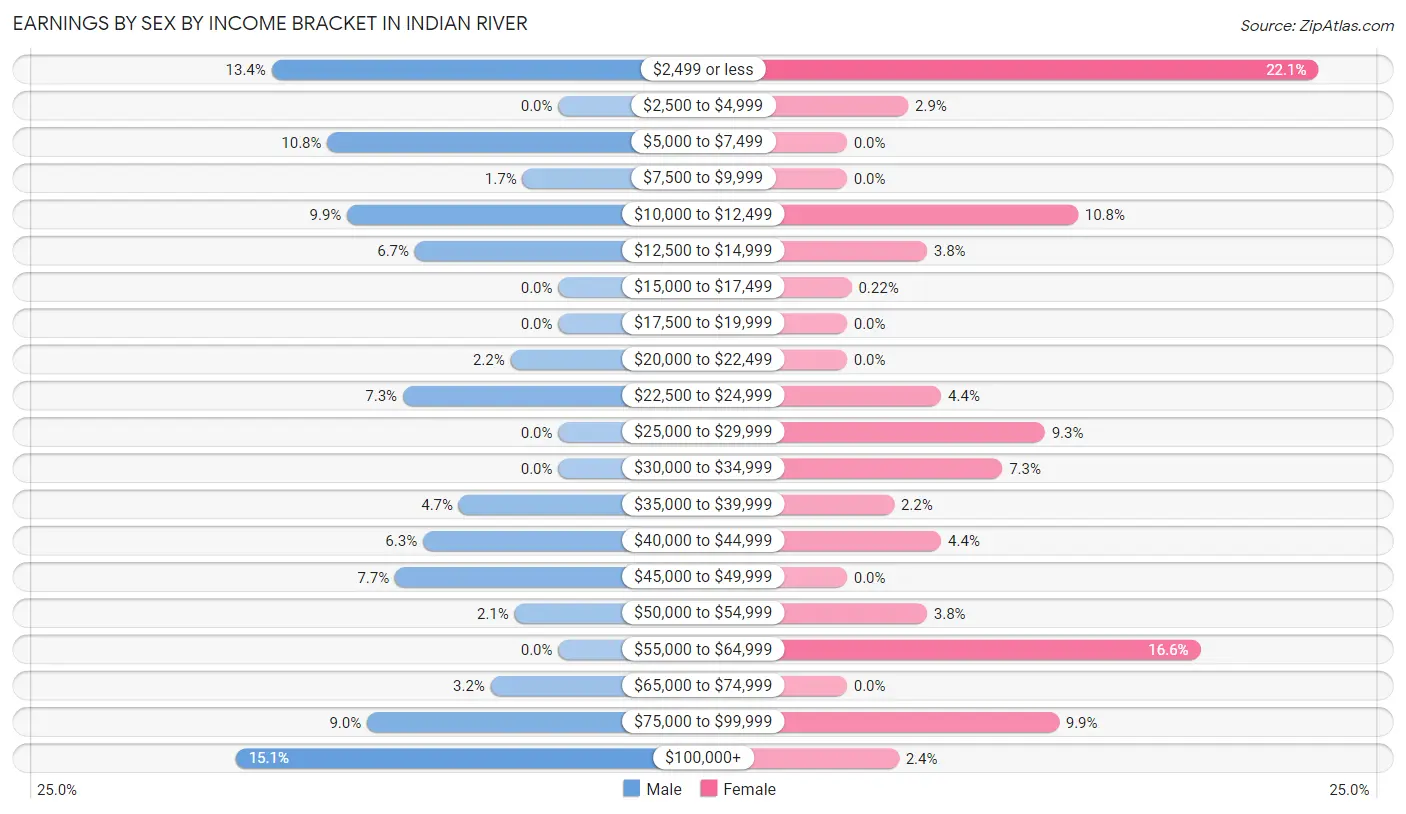
Earnings by Sex by Income Bracket in Indian River
The most common earnings brackets in Indian River are $100,000+ for men (81 | 15.1%) and $2,499 or less for women (100 | 22.1%).
| Income | Male | Female |
| $2,499 or less | 72 (13.4%) | 100 (22.1%) |
| $2,500 to $4,999 | 0 (0.0%) | 13 (2.9%) |
| $5,000 to $7,499 | 58 (10.8%) | 0 (0.0%) |
| $7,500 to $9,999 | 9 (1.7%) | 0 (0.0%) |
| $10,000 to $12,499 | 53 (9.9%) | 49 (10.8%) |
| $12,500 to $14,999 | 36 (6.7%) | 17 (3.7%) |
| $15,000 to $17,499 | 0 (0.0%) | 1 (0.2%) |
| $17,500 to $19,999 | 0 (0.0%) | 0 (0.0%) |
| $20,000 to $22,499 | 12 (2.2%) | 0 (0.0%) |
| $22,500 to $24,999 | 39 (7.3%) | 20 (4.4%) |
| $25,000 to $29,999 | 0 (0.0%) | 42 (9.3%) |
| $30,000 to $34,999 | 0 (0.0%) | 33 (7.3%) |
| $35,000 to $39,999 | 25 (4.7%) | 10 (2.2%) |
| $40,000 to $44,999 | 34 (6.3%) | 20 (4.4%) |
| $45,000 to $49,999 | 41 (7.6%) | 0 (0.0%) |
| $50,000 to $54,999 | 11 (2.1%) | 17 (3.7%) |
| $55,000 to $64,999 | 0 (0.0%) | 75 (16.6%) |
| $65,000 to $74,999 | 17 (3.2%) | 0 (0.0%) |
| $75,000 to $99,999 | 48 (9.0%) | 45 (9.9%) |
| $100,000+ | 81 (15.1%) | 11 (2.4%) |
| Total | 536 (100.0%) | 453 (100.0%) |
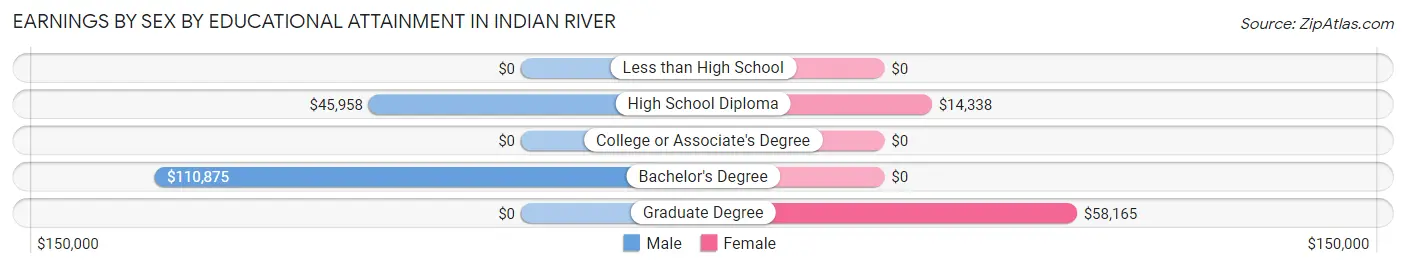
Earnings by Sex by Educational Attainment in Indian River
Average earnings in Indian River are $44,412 for men and $33,598 for women, a difference of 24.3%. Men with an educational attainment of bachelor's degree enjoy the highest average annual earnings of $110,875, while those with high school diploma education earn the least with $45,958. Women with an educational attainment of graduate degree earn the most with the average annual earnings of $58,165, while those with high school diploma education have the smallest earnings of $14,338.
| Educational Attainment | Male Income | Female Income |
| Less than High School | - | - |
| High School Diploma | $45,958 | $14,338 |
| College or Associate's Degree | - | - |
| Bachelor's Degree | $110,875 | $0 |
| Graduate Degree | - | - |
| Total | $44,412 | $33,598 |
Family Income in Indian River
Family Income Brackets in Indian River
According to the Indian River family income data, there are 104 families falling into the $75,000 to $99,999 income range, which is the most common income bracket and makes up 20.3% of all families.
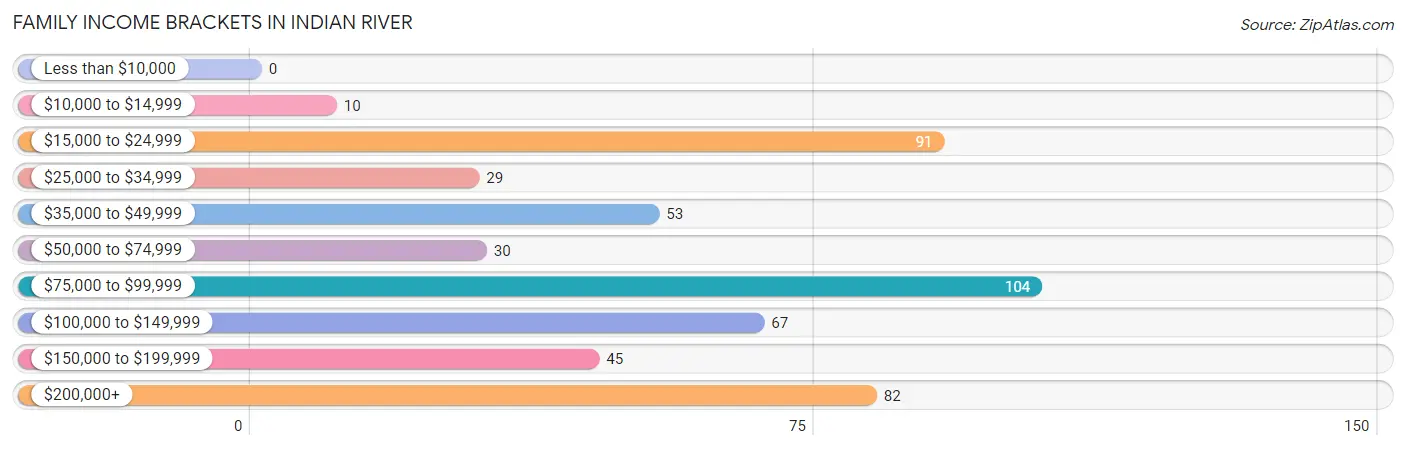
| Income Bracket | # Families | % Families |
| Less than $10,000 | 0 | 0.0% |
| $10,000 to $14,999 | 10 | 2.0% |
| $15,000 to $24,999 | 91 | 17.8% |
| $25,000 to $34,999 | 29 | 5.7% |
| $35,000 to $49,999 | 53 | 10.4% |
| $50,000 to $74,999 | 30 | 5.9% |
| $75,000 to $99,999 | 104 | 20.4% |
| $100,000 to $149,999 | 67 | 13.1% |
| $150,000 to $199,999 | 45 | 8.8% |
| $200,000+ | 82 | 16.0% |
Family Income by Famaliy Size in Indian River
2-person families (375 | 73.4%) account for the highest median family income in Indian River with $57,042 per family, while 2-person families (375 | 73.4%) have the highest median income of $28,521 per family member.
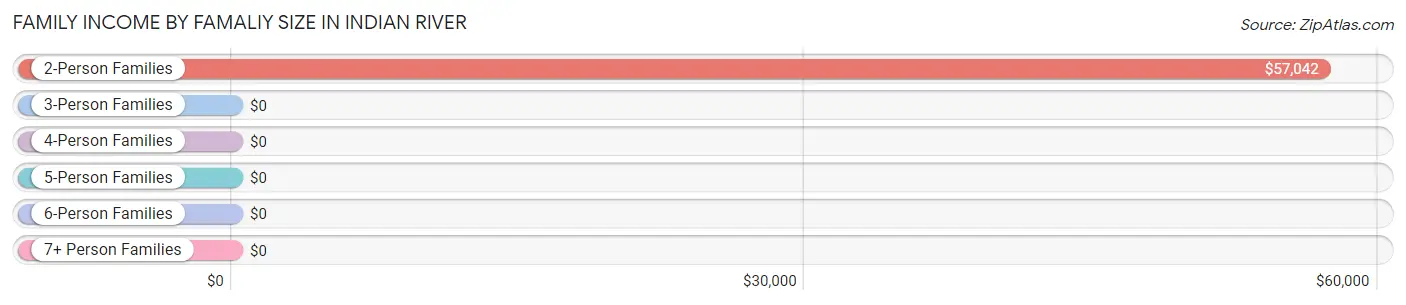
| Income Bracket | # Families | Median Income |
| 2-Person Families | 375 (73.4%) | $57,042 |
| 3-Person Families | 47 (9.2%) | $0 |
| 4-Person Families | 85 (16.6%) | $0 |
| 5-Person Families | 4 (0.8%) | $0 |
| 6-Person Families | 0 (0.0%) | $0 |
| 7+ Person Families | 0 (0.0%) | $0 |
| Total | 511 (100.0%) | $85,375 |
Family Income by Number of Earners in Indian River
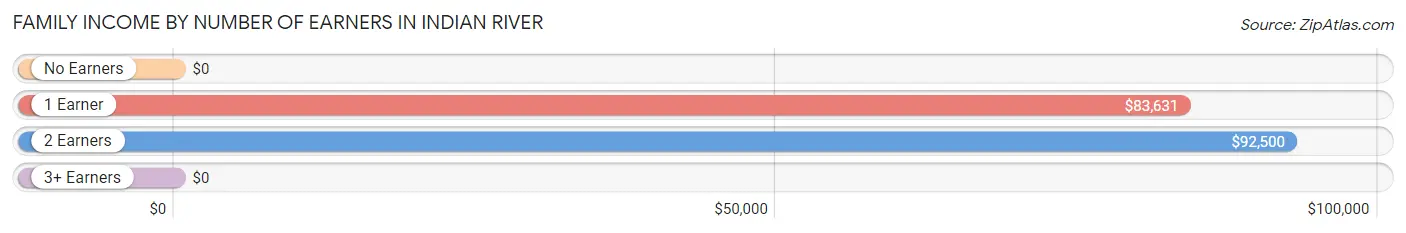
| Number of Earners | # Families | Median Income |
| No Earners | 200 (39.1%) | $0 |
| 1 Earner | 103 (20.2%) | $83,631 |
| 2 Earners | 172 (33.7%) | $92,500 |
| 3+ Earners | 36 (7.0%) | $0 |
| Total | 511 (100.0%) | $85,375 |
Household Income in Indian River
Household Income Brackets in Indian River
With 196 households falling in the category, the $75,000 to $99,999 income range is the most frequent in Indian River, accounting for 19.4% of all households. In contrast, only 27 households (2.7%) fall into the $10,000 to $14,999 income bracket, making it the least populous group.
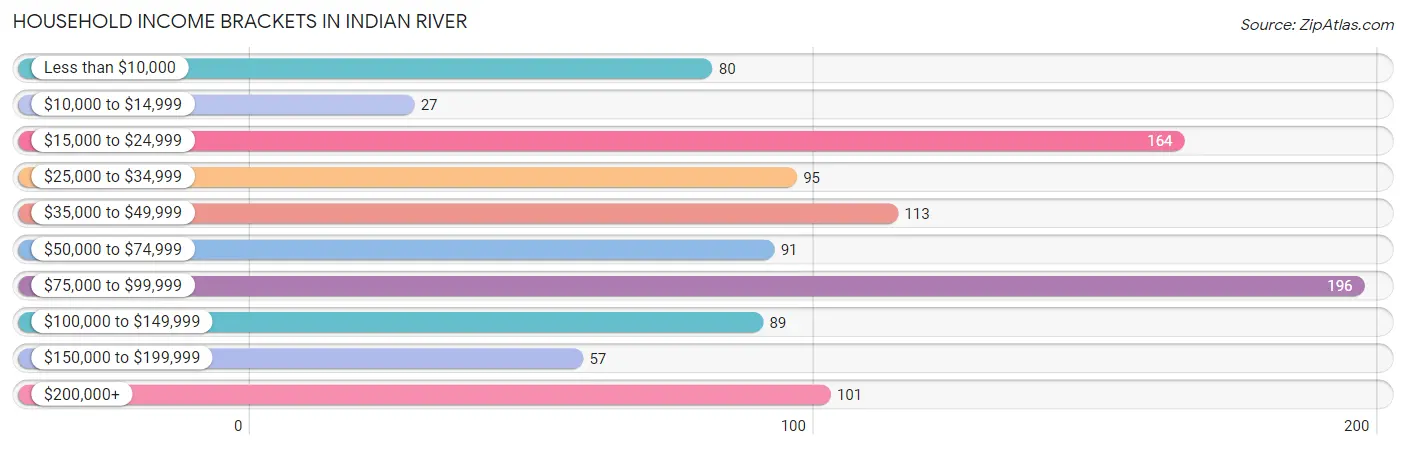
| Income Bracket | # Households | % Households |
| Less than $10,000 | 80 | 7.9% |
| $10,000 to $14,999 | 27 | 2.7% |
| $15,000 to $24,999 | 164 | 16.2% |
| $25,000 to $34,999 | 95 | 9.4% |
| $35,000 to $49,999 | 113 | 11.2% |
| $50,000 to $74,999 | 91 | 9.0% |
| $75,000 to $99,999 | 196 | 19.3% |
| $100,000 to $149,999 | 89 | 8.8% |
| $150,000 to $199,999 | 57 | 5.6% |
| $200,000+ | 101 | 10.0% |
Household Income by Householder Age in Indian River
The median household income in Indian River is $57,148, with the highest median household income of $83,750 found in the 45 to 64 years age bracket for the primary householder. A total of 427 households (42.1%) fall into this category.
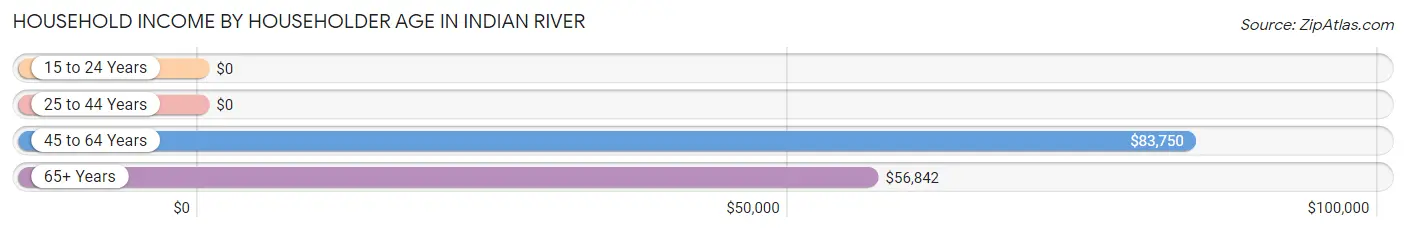
| Income Bracket | # Households | Median Income |
| 15 to 24 Years | 0 (0.0%) | $0 |
| 25 to 44 Years | 110 (10.9%) | $0 |
| 45 to 64 Years | 427 (42.1%) | $83,750 |
| 65+ Years | 476 (47.0%) | $56,842 |
| Total | 1,013 (100.0%) | $57,148 |
Poverty in Indian River
Income Below Poverty by Sex and Age in Indian River
With 11.4% poverty level for males and 17.7% for females among the residents of Indian River, 25 to 34 year old males and 15 year old females are the most vulnerable to poverty, with 46 males (51.1%) and 15 females (100.0%) in their respective age groups living below the poverty level.
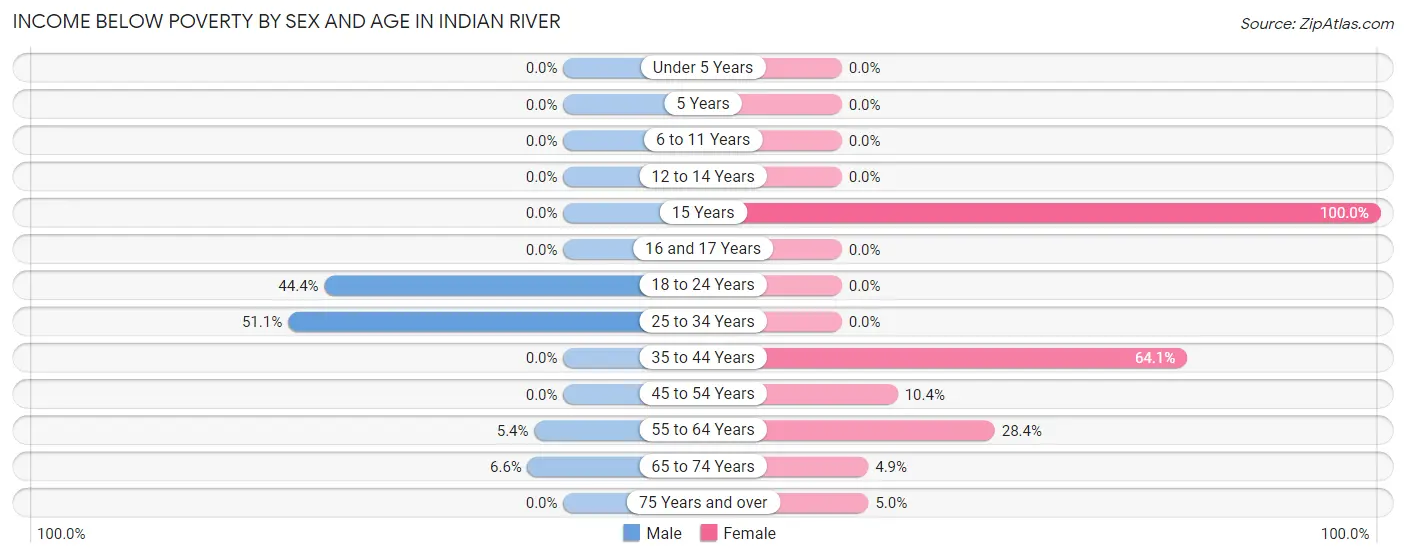
| Age Bracket | Male | Female |
| Under 5 Years | 0 (0.0%) | 0 (0.0%) |
| 5 Years | 0 (0.0%) | 0 (0.0%) |
| 6 to 11 Years | 0 (0.0%) | 0 (0.0%) |
| 12 to 14 Years | 0 (0.0%) | 0 (0.0%) |
| 15 Years | 0 (0.0%) | 15 (100.0%) |
| 16 and 17 Years | 0 (0.0%) | 0 (0.0%) |
| 18 to 24 Years | 55 (44.4%) | 0 (0.0%) |
| 25 to 34 Years | 46 (51.1%) | 0 (0.0%) |
| 35 to 44 Years | 0 (0.0%) | 66 (64.1%) |
| 45 to 54 Years | 0 (0.0%) | 11 (10.4%) |
| 55 to 64 Years | 10 (5.4%) | 69 (28.4%) |
| 65 to 74 Years | 9 (6.6%) | 9 (4.9%) |
| 75 Years and over | 0 (0.0%) | 11 (5.0%) |
| Total | 120 (11.4%) | 181 (17.7%) |
Income Above Poverty by Sex and Age in Indian River
According to the poverty statistics in Indian River, males aged 6 to 11 years and females aged under 5 years are the age groups that are most secure financially, with 100.0% of males and 100.0% of females in these age groups living above the poverty line.
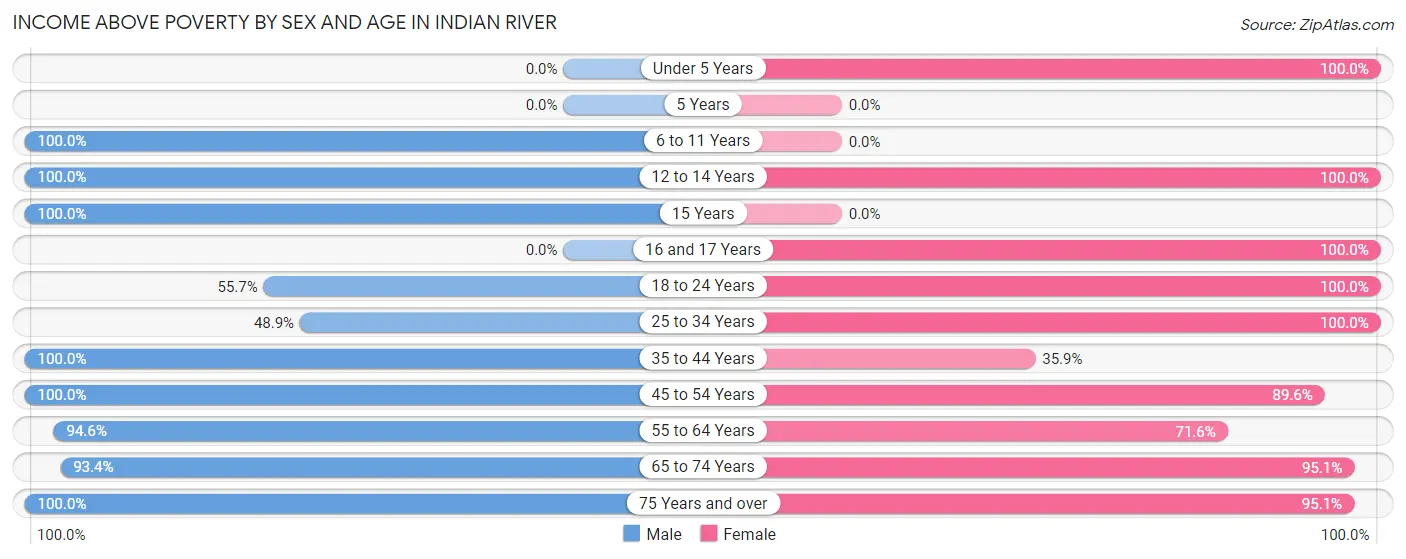
| Age Bracket | Male | Female |
| Under 5 Years | 0 (0.0%) | 22 (100.0%) |
| 5 Years | 0 (0.0%) | 0 (0.0%) |
| 6 to 11 Years | 43 (100.0%) | 0 (0.0%) |
| 12 to 14 Years | 25 (100.0%) | 24 (100.0%) |
| 15 Years | 16 (100.0%) | 0 (0.0%) |
| 16 and 17 Years | 0 (0.0%) | 35 (100.0%) |
| 18 to 24 Years | 69 (55.6%) | 25 (100.0%) |
| 25 to 34 Years | 44 (48.9%) | 47 (100.0%) |
| 35 to 44 Years | 11 (100.0%) | 37 (35.9%) |
| 45 to 54 Years | 222 (100.0%) | 95 (89.6%) |
| 55 to 64 Years | 176 (94.6%) | 174 (71.6%) |
| 65 to 74 Years | 127 (93.4%) | 174 (95.1%) |
| 75 Years and over | 198 (100.0%) | 211 (95.1%) |
| Total | 931 (88.6%) | 844 (82.3%) |
Income Below Poverty Among Married-Couple Families in Indian River
The poverty statistics for married-couple families in Indian River show that 4.2% or 19 of the total 449 families live below the poverty line. Families with no children have the highest poverty rate of 5.5%, comprising of 19 families. On the other hand, families with 1 or 2 children have the lowest poverty rate of 0.0%, which includes 0 families.
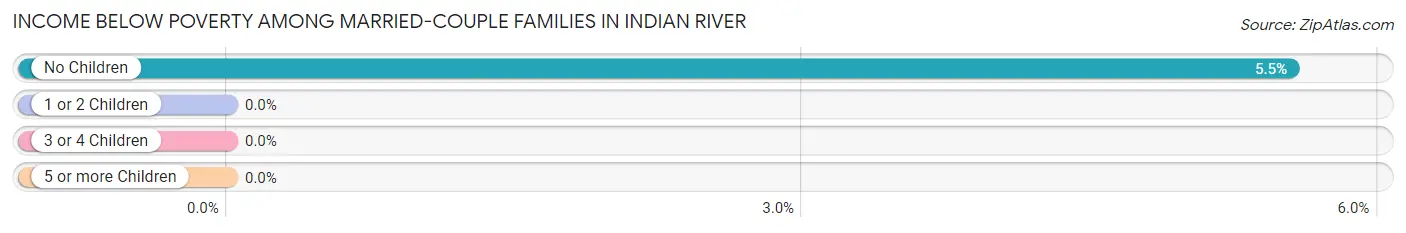
| Children | Above Poverty | Below Poverty |
| No Children | 324 (94.5%) | 19 (5.5%) |
| 1 or 2 Children | 106 (100.0%) | 0 (0.0%) |
| 3 or 4 Children | 0 (0.0%) | 0 (0.0%) |
| 5 or more Children | 0 (0.0%) | 0 (0.0%) |
| Total | 430 (95.8%) | 19 (4.2%) |
Income Below Poverty Among Single-Parent Households in Indian River
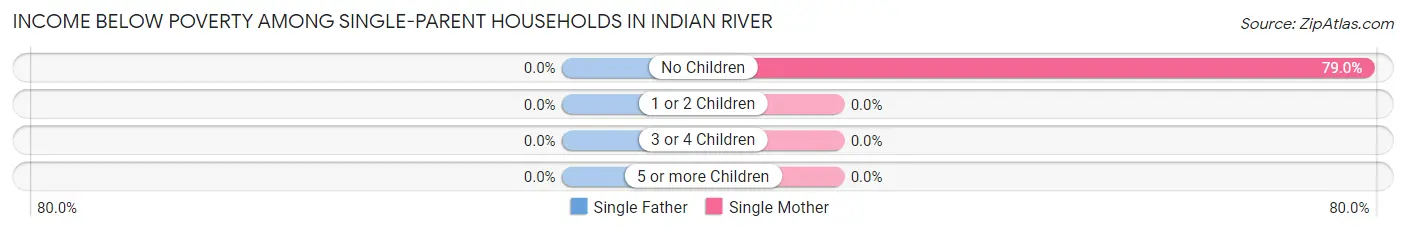
| Children | Single Father | Single Mother |
| No Children | 0 (0.0%) | 49 (79.0%) |
| 1 or 2 Children | 0 (0.0%) | 0 (0.0%) |
| 3 or 4 Children | 0 (0.0%) | 0 (0.0%) |
| 5 or more Children | 0 (0.0%) | 0 (0.0%) |
| Total | 0 (0.0%) | 49 (79.0%) |
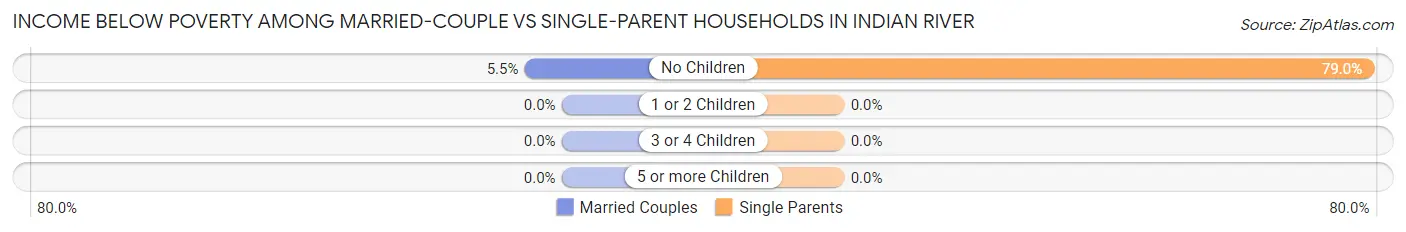
Income Below Poverty Among Married-Couple vs Single-Parent Households in Indian River
The poverty data for Indian River shows that 19 of the married-couple family households (4.2%) and 49 of the single-parent households (79.0%) are living below the poverty level. Within the married-couple family households, those with no children have the highest poverty rate, with 19 households (5.5%) falling below the poverty line. Among the single-parent households, those with no children have the highest poverty rate, with 49 household (79.0%) living below poverty.
| Children | Married-Couple Families | Single-Parent Households |
| No Children | 19 (5.5%) | 49 (79.0%) |
| 1 or 2 Children | 0 (0.0%) | 0 (0.0%) |
| 3 or 4 Children | 0 (0.0%) | 0 (0.0%) |
| 5 or more Children | 0 (0.0%) | 0 (0.0%) |
| Total | 19 (4.2%) | 49 (79.0%) |
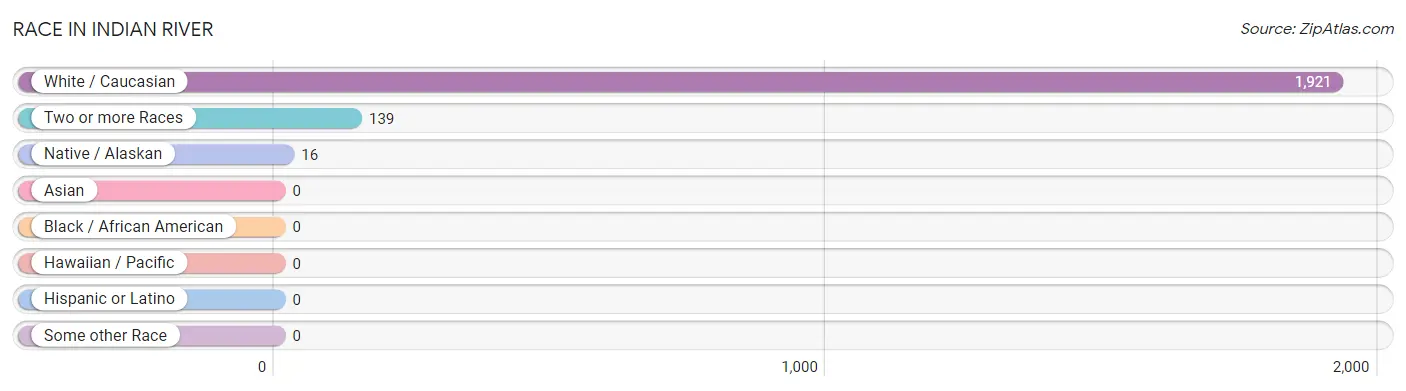
Race in Indian River
The most populous races in Indian River are White / Caucasian (1,921 | 92.5%), Two or more Races (139 | 6.7%), and Native / Alaskan (16 | 0.8%).
| Race | # Population | % Population |
| Asian | 0 | 0.0% |
| Black / African American | 0 | 0.0% |
| Hawaiian / Pacific | 0 | 0.0% |
| Hispanic or Latino | 0 | 0.0% |
| Native / Alaskan | 16 | 0.8% |
| White / Caucasian | 1,921 | 92.5% |
| Two or more Races | 139 | 6.7% |
| Some other Race | 0 | 0.0% |
| Total | 2,076 | 100.0% |
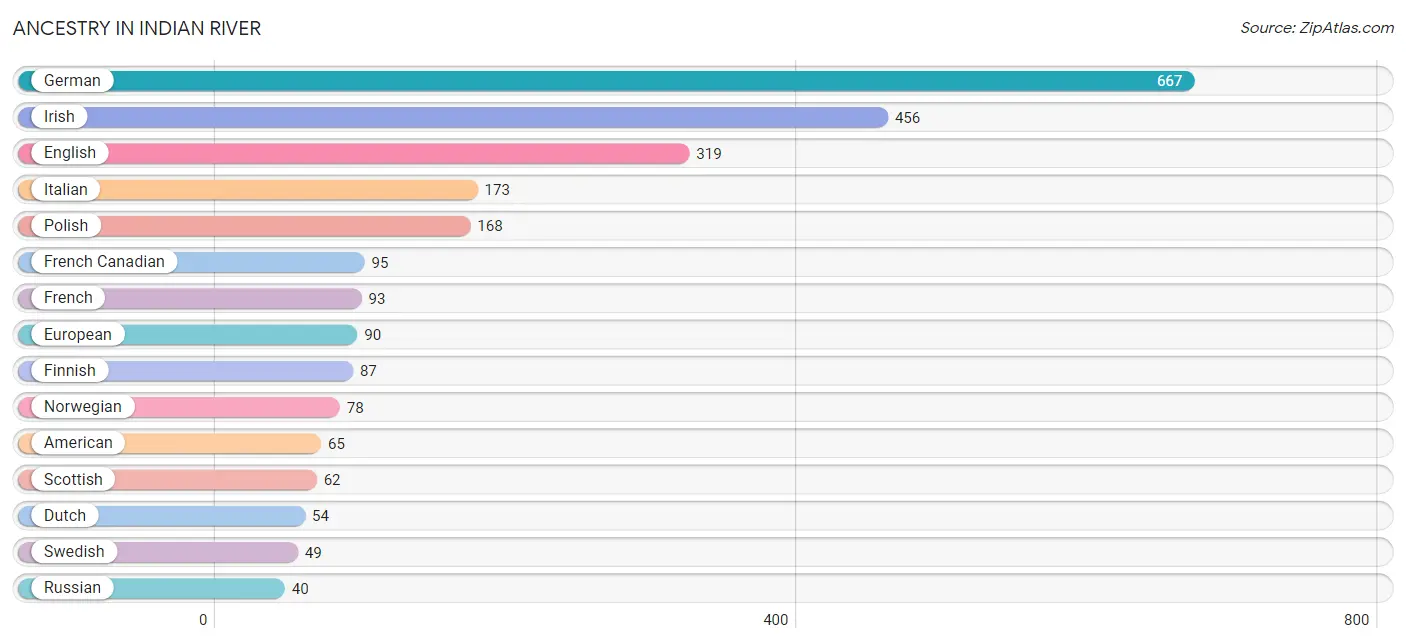
Ancestry in Indian River
The most populous ancestries reported in Indian River are German (667 | 32.1%), Irish (456 | 22.0%), English (319 | 15.4%), Italian (173 | 8.3%), and Polish (168 | 8.1%), together accounting for 85.9% of all Indian River residents.
| Ancestry | # Population | % Population |
| American | 65 | 3.1% |
| Austrian | 10 | 0.5% |
| Chippewa | 33 | 1.6% |
| Dutch | 54 | 2.6% |
| English | 319 | 15.4% |
| European | 90 | 4.3% |
| Finnish | 87 | 4.2% |
| French | 93 | 4.5% |
| French Canadian | 95 | 4.6% |
| German | 667 | 32.1% |
| Greek | 23 | 1.1% |
| Irish | 456 | 22.0% |
| Italian | 173 | 8.3% |
| Norwegian | 78 | 3.8% |
| Polish | 168 | 8.1% |
| Romanian | 12 | 0.6% |
| Russian | 40 | 1.9% |
| Scandinavian | 16 | 0.8% |
| Scotch-Irish | 12 | 0.6% |
| Scottish | 62 | 3.0% |
| Slovak | 8 | 0.4% |
| Swedish | 49 | 2.4% |
| Swiss | 13 | 0.6% |
| Welsh | 9 | 0.4% | View All 24 Rows |
Immigrants in Indian River
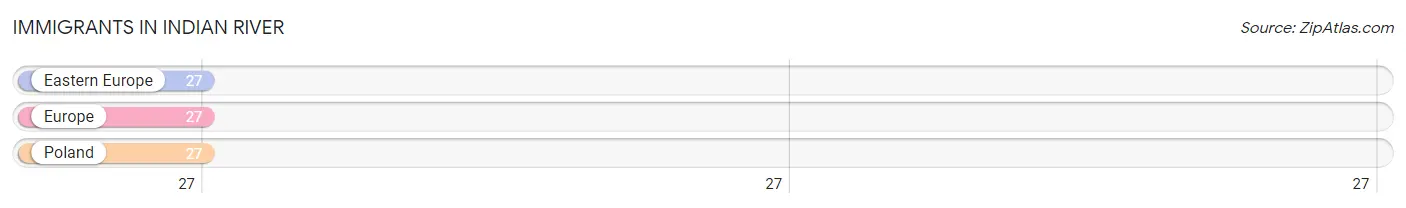
The most numerous immigrant groups reported in Indian River came from Eastern Europe (27 | 1.3%), Europe (27 | 1.3%), and Poland (27 | 1.3%), together accounting for 3.9% of all Indian River residents.
| Immigration Origin | # Population | % Population |
| Eastern Europe | 27 | 1.3% |
| Europe | 27 | 1.3% |
| Poland | 27 | 1.3% | View All 3 Rows |
Sex and Age in Indian River
Sex and Age in Indian River
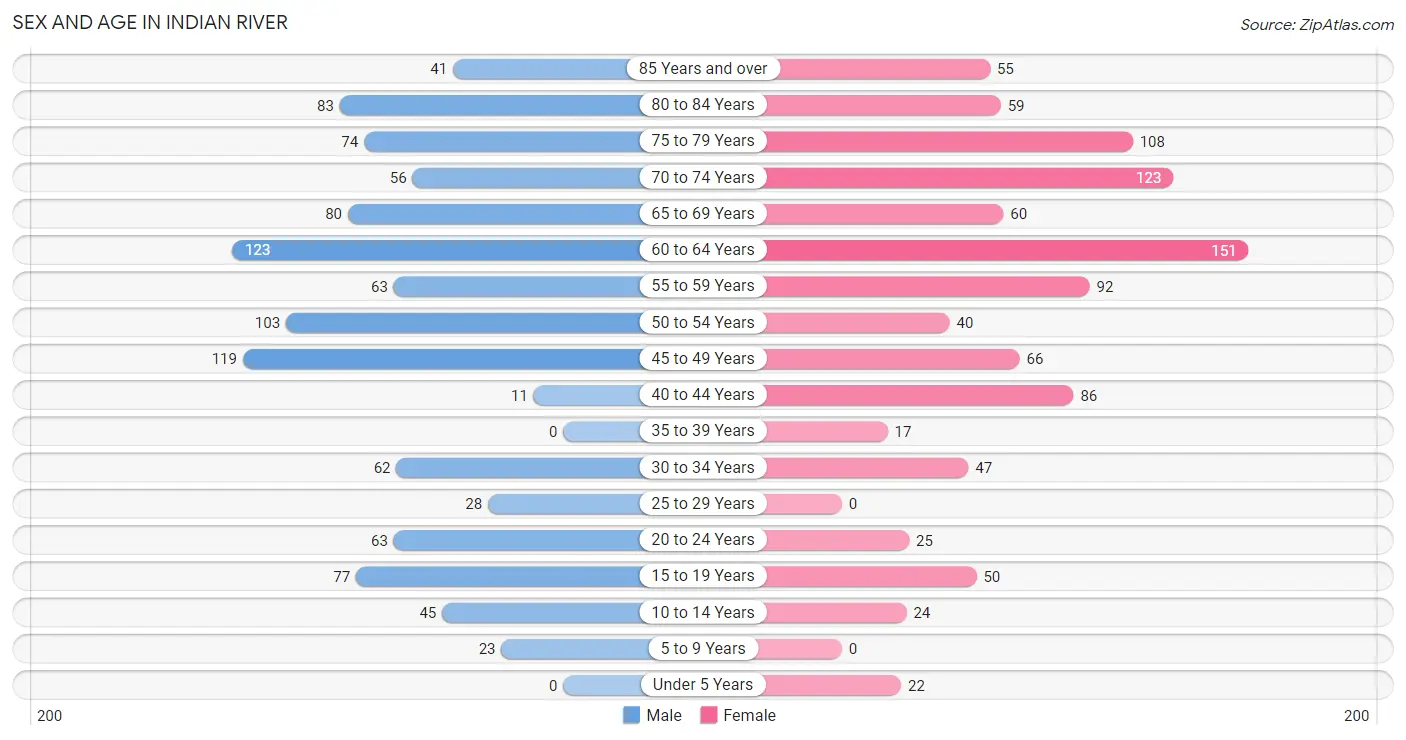
The most populous age groups in Indian River are 60 to 64 Years (123 | 11.7%) for men and 60 to 64 Years (151 | 14.7%) for women.
| Age Bracket | Male | Female |
| Under 5 Years | 0 (0.0%) | 22 (2.1%) |
| 5 to 9 Years | 23 (2.2%) | 0 (0.0%) |
| 10 to 14 Years | 45 (4.3%) | 24 (2.3%) |
| 15 to 19 Years | 77 (7.3%) | 50 (4.9%) |
| 20 to 24 Years | 63 (6.0%) | 25 (2.4%) |
| 25 to 29 Years | 28 (2.7%) | 0 (0.0%) |
| 30 to 34 Years | 62 (5.9%) | 47 (4.6%) |
| 35 to 39 Years | 0 (0.0%) | 17 (1.7%) |
| 40 to 44 Years | 11 (1.1%) | 86 (8.4%) |
| 45 to 49 Years | 119 (11.3%) | 66 (6.4%) |
| 50 to 54 Years | 103 (9.8%) | 40 (3.9%) |
| 55 to 59 Years | 63 (6.0%) | 92 (9.0%) |
| 60 to 64 Years | 123 (11.7%) | 151 (14.7%) |
| 65 to 69 Years | 80 (7.6%) | 60 (5.9%) |
| 70 to 74 Years | 56 (5.3%) | 123 (12.0%) |
| 75 to 79 Years | 74 (7.0%) | 108 (10.5%) |
| 80 to 84 Years | 83 (7.9%) | 59 (5.8%) |
| 85 Years and over | 41 (3.9%) | 55 (5.4%) |
| Total | 1,051 (100.0%) | 1,025 (100.0%) |
Families and Households in Indian River
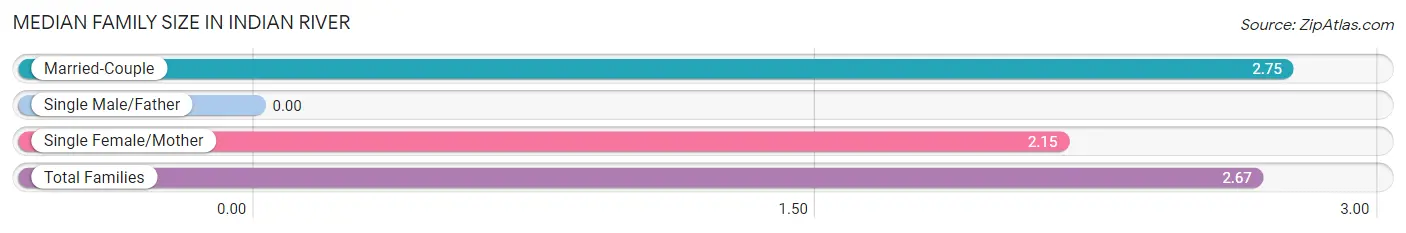
Median Family Size in Indian River
| Family Type | # Families | Family Size |
| Married-Couple | 449 (87.9%) | 2.75 |
| Single Male/Father | 0 (0.0%) | - |
| Single Female/Mother | 62 (12.1%) | 2.15 |
| Total Families | 511 (100.0%) | 2.67 |
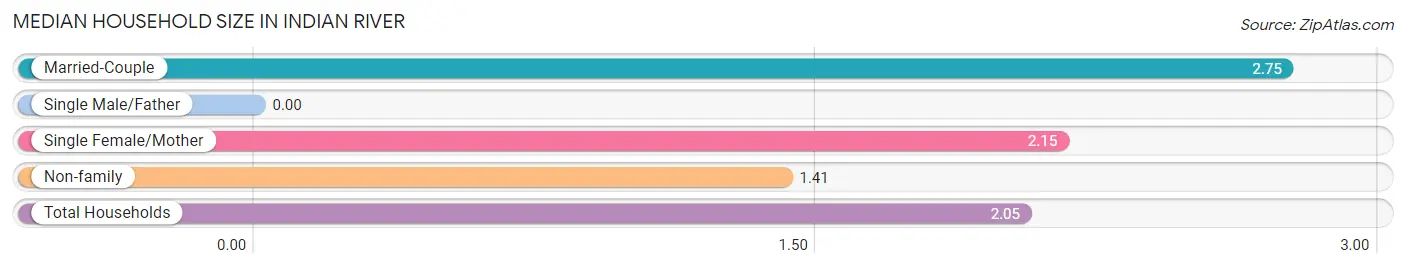
Median Household Size in Indian River
| Household Type | # Households | Household Size |
| Married-Couple | 449 (44.3%) | 2.75 |
| Single Male/Father | 0 (0.0%) | - |
| Single Female/Mother | 62 (6.1%) | 2.15 |
| Non-family | 502 (49.6%) | 1.41 |
| Total Households | 1,013 (100.0%) | 2.05 |
Household Size by Marriage Status in Indian River
Out of a total of 1,013 households in Indian River, 511 (50.4%) are family households, while 502 (49.6%) are nonfamily households. The most numerous type of family households are 2-person households, comprising 375, and the most common type of nonfamily households are 1-person households, comprising 376.
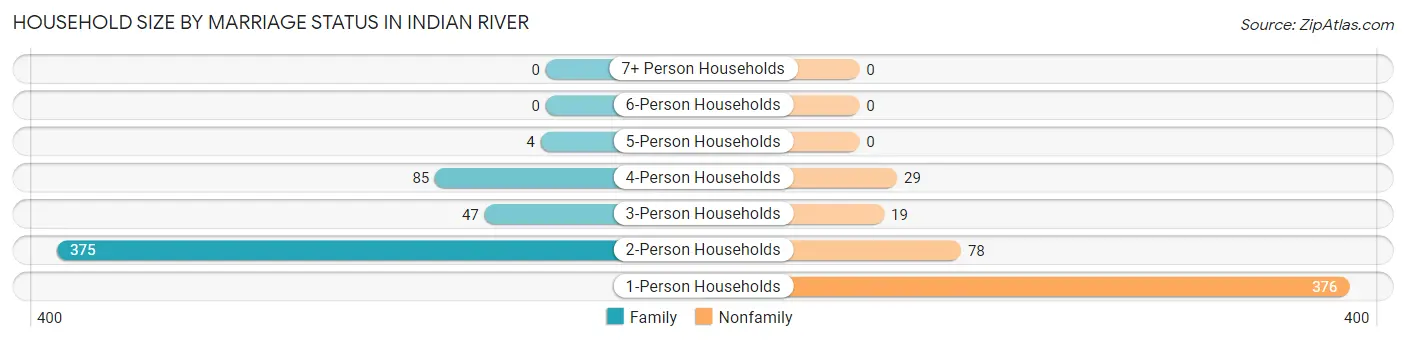
| Household Size | Family Households | Nonfamily Households |
| 1-Person Households | - | 376 (37.1%) |
| 2-Person Households | 375 (37.0%) | 78 (7.7%) |
| 3-Person Households | 47 (4.6%) | 19 (1.9%) |
| 4-Person Households | 85 (8.4%) | 29 (2.9%) |
| 5-Person Households | 4 (0.4%) | 0 (0.0%) |
| 6-Person Households | 0 (0.0%) | 0 (0.0%) |
| 7+ Person Households | 0 (0.0%) | 0 (0.0%) |
| Total | 511 (50.4%) | 502 (49.6%) |
Female Fertility in Indian River
Fertility by Age in Indian River
| Age Bracket | Women with Births | Births / 1,000 Women |
| 15 to 19 years | 0 (0.0%) | 0.0 |
| 20 to 34 years | 0 (0.0%) | 0.0 |
| 35 to 50 years | 0 (0.0%) | 0.0 |
| Total | 0 (0.0%) | 0.0 |
Fertility by Age by Marriage Status in Indian River
| Age Bracket | Married | Unmarried |
| 15 to 19 years | 0 (0.0%) | 0 (0.0%) |
| 20 to 34 years | 0 (0.0%) | 0 (0.0%) |
| 35 to 50 years | 0 (0.0%) | 0 (0.0%) |
| Total | 0 (0.0%) | 0 (0.0%) |
Fertility by Education in Indian River
| Educational Attainment | Women with Births | Births / 1,000 Women |
| Less than High School | 0 (0.0%) | 0.0 |
| High School Diploma | 0 (0.0%) | 0.0 |
| College or Associate's Degree | 0 (0.0%) | 0.0 |
| Bachelor's Degree | 0 (0.0%) | 0.0 |
| Graduate Degree | 0 (0.0%) | 0.0 |
| Total | 0 (0.0%) | 0.0 |
Fertility by Education by Marriage Status in Indian River
| Educational Attainment | Married | Unmarried |
| Less than High School | 0 (0.0%) | 0 (0.0%) |
| High School Diploma | 0 (0.0%) | 0 (0.0%) |
| College or Associate's Degree | 0 (0.0%) | 0 (0.0%) |
| Bachelor's Degree | 0 (0.0%) | 0 (0.0%) |
| Graduate Degree | 0 (0.0%) | 0 (0.0%) |
| Total | 0 (0.0%) | 0 (0.0%) |
Employment Characteristics in Indian River
Employment by Class of Employer in Indian River
Among the 938 employed individuals in Indian River, private company employees (577 | 61.5%), local government employees (101 | 10.8%), and not-for-profit organizations (93 | 9.9%) make up the most common classes of employment.
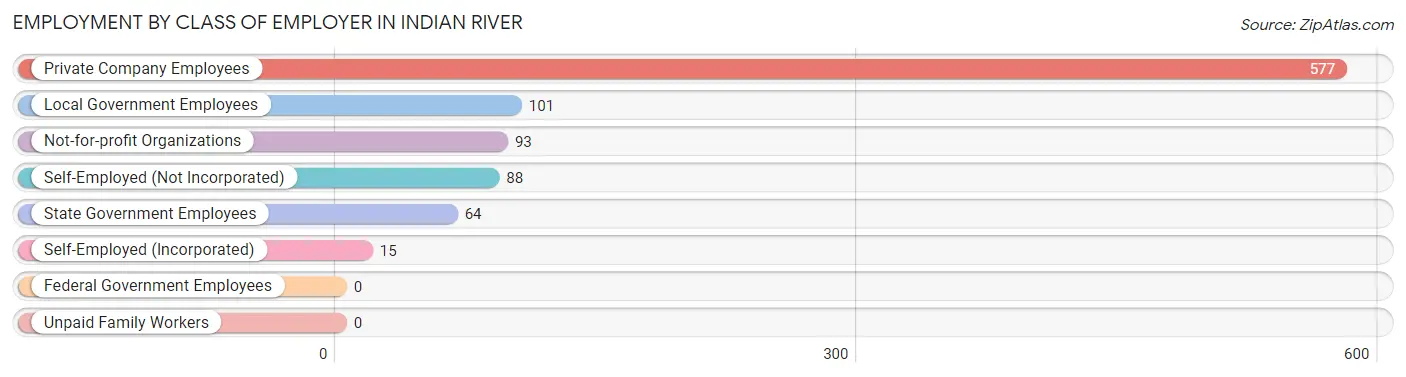
| Employer Class | # Employees | % Employees |
| Private Company Employees | 577 | 61.5% |
| Self-Employed (Incorporated) | 15 | 1.6% |
| Self-Employed (Not Incorporated) | 88 | 9.4% |
| Not-for-profit Organizations | 93 | 9.9% |
| Local Government Employees | 101 | 10.8% |
| State Government Employees | 64 | 6.8% |
| Federal Government Employees | 0 | 0.0% |
| Unpaid Family Workers | 0 | 0.0% |
| Total | 938 | 100.0% |
Employment Status by Age in Indian River
According to the labor force statistics for Indian River, out of the total population over 16 years of age (1,931), 51.2% or 989 individuals are in the labor force, with 4.1% or 41 of them unemployed. The age group with the highest labor force participation rate is 20 to 24 years, with 100.0% or 88 individuals in the labor force. Within the labor force, the 45 to 54 years age range has the highest percentage of unemployed individuals, with 11.1% or 29 of them being unemployed.
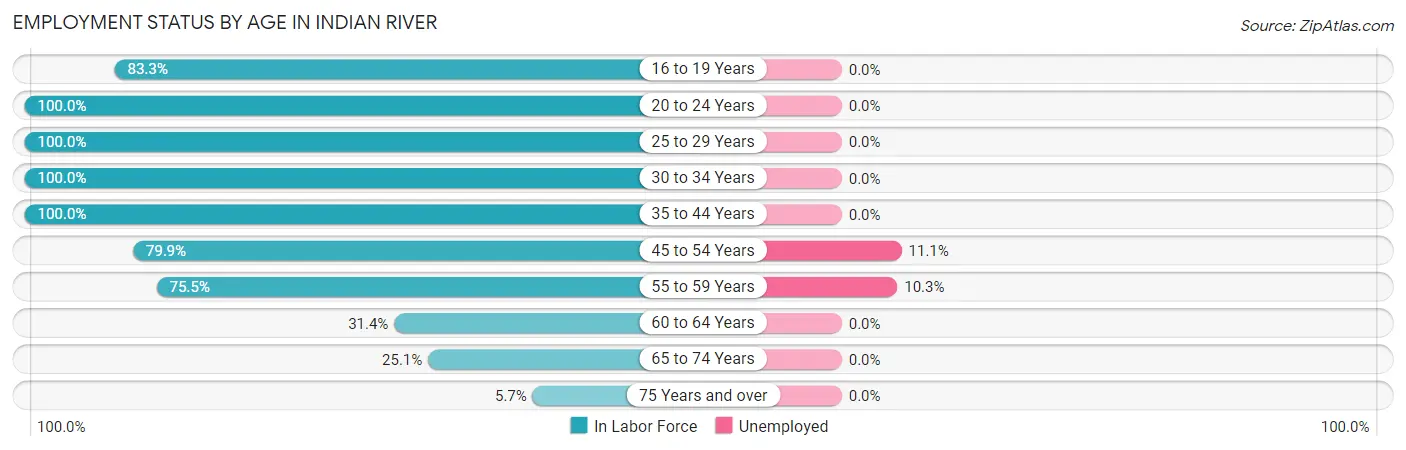
| Age Bracket | In Labor Force | Unemployed |
| 16 to 19 Years | 80 (83.3%) | 0 (0.0%) |
| 20 to 24 Years | 88 (100.0%) | 0 (0.0%) |
| 25 to 29 Years | 28 (100.0%) | 0 (0.0%) |
| 30 to 34 Years | 109 (100.0%) | 0 (0.0%) |
| 35 to 44 Years | 114 (100.0%) | 0 (0.0%) |
| 45 to 54 Years | 262 (79.9%) | 29 (11.1%) |
| 55 to 59 Years | 117 (75.5%) | 12 (10.3%) |
| 60 to 64 Years | 86 (31.4%) | 0 (0.0%) |
| 65 to 74 Years | 80 (25.1%) | 0 (0.0%) |
| 75 Years and over | 24 (5.7%) | 0 (0.0%) |
| Total | 989 (51.2%) | 41 (4.1%) |
Employment Status by Educational Attainment in Indian River
According to labor force statistics for Indian River, 71.0% of individuals (716) out of the total population between 25 and 64 years of age (1,008) are in the labor force, with 5.7% or 41 of them being unemployed. The group with the highest labor force participation rate are those with the educational attainment of bachelor's degree or higher, with 90.8% or 315 individuals in the labor force. Within the labor force, individuals with high school diploma education have the highest percentage of unemployment, with 24.4% or 41 of them being unemployed.
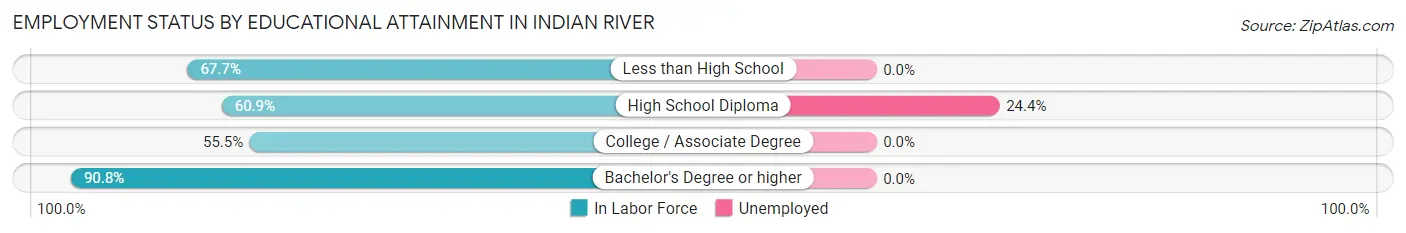
| Educational Attainment | In Labor Force | Unemployed |
| Less than High School | 107 (67.7%) | 0 (0.0%) |
| High School Diploma | 168 (60.9%) | 67 (24.4%) |
| College / Associate Degree | 126 (55.5%) | 0 (0.0%) |
| Bachelor's Degree or higher | 315 (90.8%) | 0 (0.0%) |
| Total | 716 (71.0%) | 57 (5.7%) |
Employment Occupations by Sex in Indian River
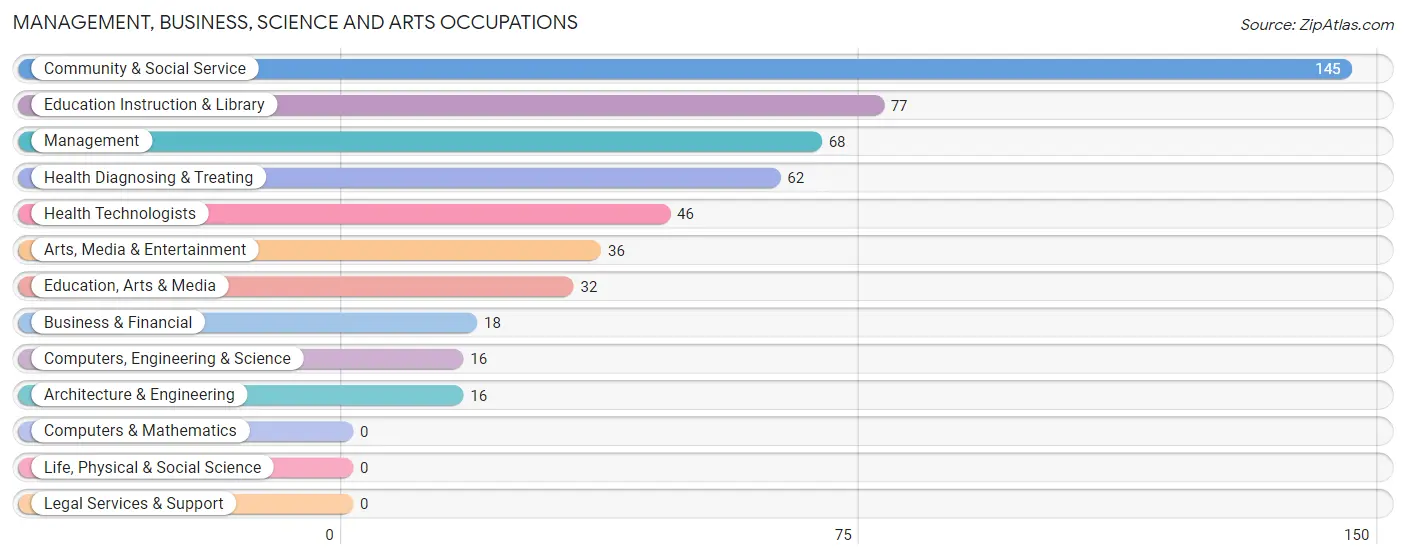
Management, Business, Science and Arts Occupations
The most common Management, Business, Science and Arts occupations in Indian River are Community & Social Service (145 | 15.3%), Education Instruction & Library (77 | 8.1%), Management (68 | 7.2%), Health Diagnosing & Treating (62 | 6.6%), and Health Technologists (46 | 4.9%).
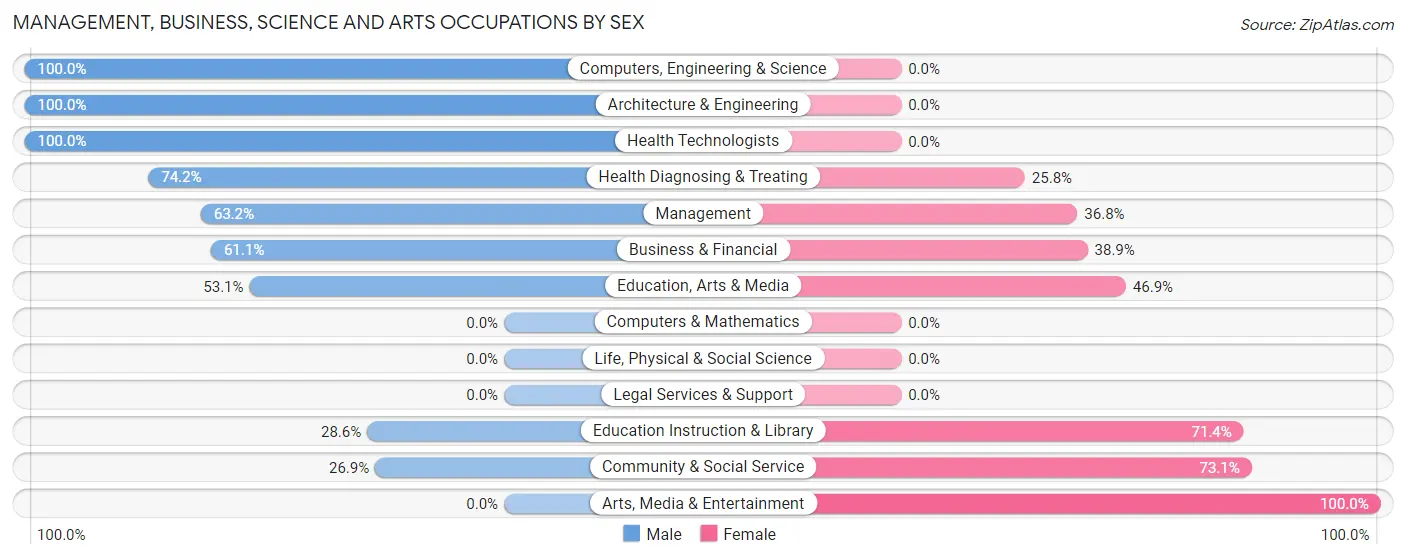
Management, Business, Science and Arts Occupations by Sex
Within the Management, Business, Science and Arts occupations in Indian River, the most male-oriented occupations are Computers, Engineering & Science (100.0%), Architecture & Engineering (100.0%), and Health Technologists (100.0%), while the most female-oriented occupations are Arts, Media & Entertainment (100.0%), Community & Social Service (73.1%), and Education Instruction & Library (71.4%).
| Occupation | Male | Female |
| Management | 43 (63.2%) | 25 (36.8%) |
| Business & Financial | 11 (61.1%) | 7 (38.9%) |
| Computers, Engineering & Science | 16 (100.0%) | 0 (0.0%) |
| Computers & Mathematics | 0 (0.0%) | 0 (0.0%) |
| Architecture & Engineering | 16 (100.0%) | 0 (0.0%) |
| Life, Physical & Social Science | 0 (0.0%) | 0 (0.0%) |
| Community & Social Service | 39 (26.9%) | 106 (73.1%) |
| Education, Arts & Media | 17 (53.1%) | 15 (46.9%) |
| Legal Services & Support | 0 (0.0%) | 0 (0.0%) |
| Education Instruction & Library | 22 (28.6%) | 55 (71.4%) |
| Arts, Media & Entertainment | 0 (0.0%) | 36 (100.0%) |
| Health Diagnosing & Treating | 46 (74.2%) | 16 (25.8%) |
| Health Technologists | 46 (100.0%) | 0 (0.0%) |
| Total (Category) | 155 (50.2%) | 154 (49.8%) |
| Total (Overall) | 495 (52.3%) | 452 (47.7%) |
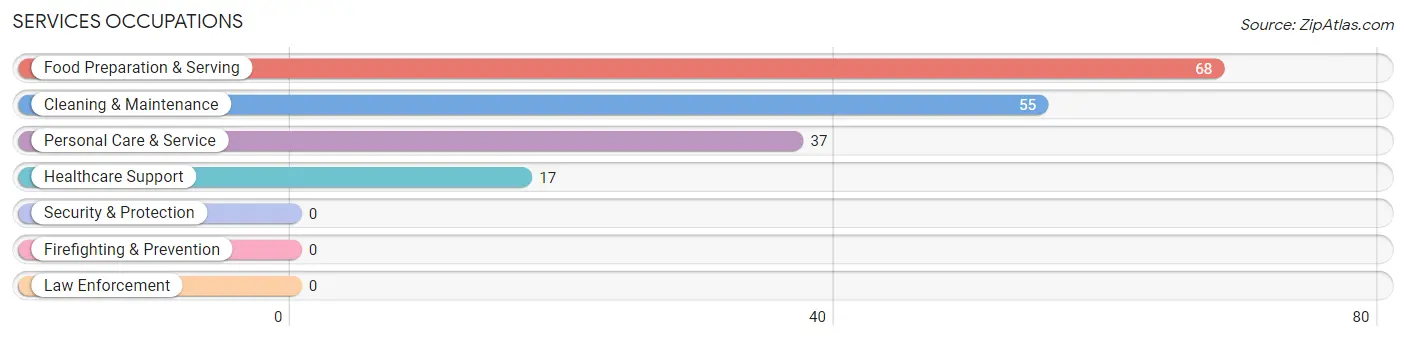
Services Occupations
The most common Services occupations in Indian River are Food Preparation & Serving (68 | 7.2%), Cleaning & Maintenance (55 | 5.8%), Personal Care & Service (37 | 3.9%), and Healthcare Support (17 | 1.8%).
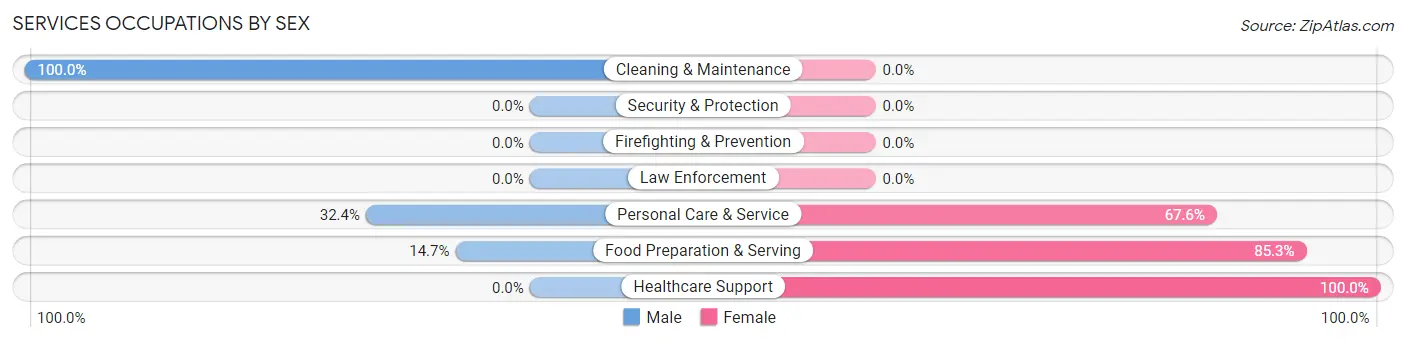
Services Occupations by Sex
Within the Services occupations in Indian River, the most male-oriented occupations are Cleaning & Maintenance (100.0%), Personal Care & Service (32.4%), and Food Preparation & Serving (14.7%), while the most female-oriented occupations are Healthcare Support (100.0%), Food Preparation & Serving (85.3%), and Personal Care & Service (67.6%).
| Occupation | Male | Female |
| Healthcare Support | 0 (0.0%) | 17 (100.0%) |
| Security & Protection | 0 (0.0%) | 0 (0.0%) |
| Firefighting & Prevention | 0 (0.0%) | 0 (0.0%) |
| Law Enforcement | 0 (0.0%) | 0 (0.0%) |
| Food Preparation & Serving | 10 (14.7%) | 58 (85.3%) |
| Cleaning & Maintenance | 55 (100.0%) | 0 (0.0%) |
| Personal Care & Service | 12 (32.4%) | 25 (67.6%) |
| Total (Category) | 77 (43.5%) | 100 (56.5%) |
| Total (Overall) | 495 (52.3%) | 452 (47.7%) |
Sales and Office Occupations
The most common Sales and Office occupations in Indian River are Office & Administration (134 | 14.1%), and Sales & Related (95 | 10.0%).
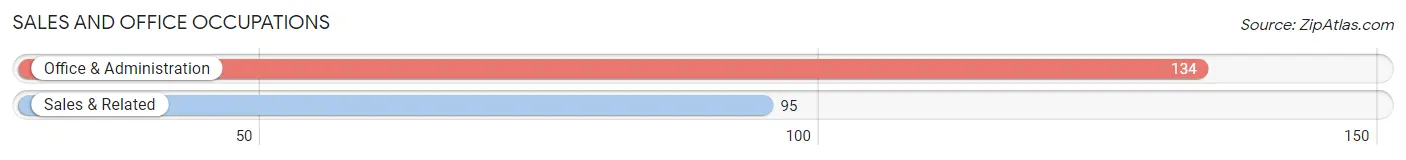
Sales and Office Occupations by Sex
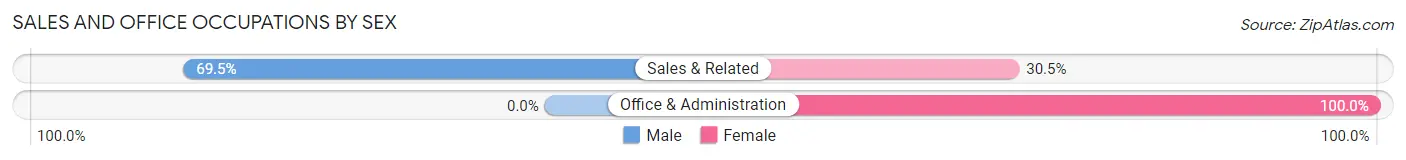
| Occupation | Male | Female |
| Sales & Related | 66 (69.5%) | 29 (30.5%) |
| Office & Administration | 0 (0.0%) | 134 (100.0%) |
| Total (Category) | 66 (28.8%) | 163 (71.2%) |
| Total (Overall) | 495 (52.3%) | 452 (47.7%) |
Natural Resources, Construction and Maintenance Occupations
The most common Natural Resources, Construction and Maintenance occupations in Indian River are , and Construction & Extraction (152 | 16.1%).
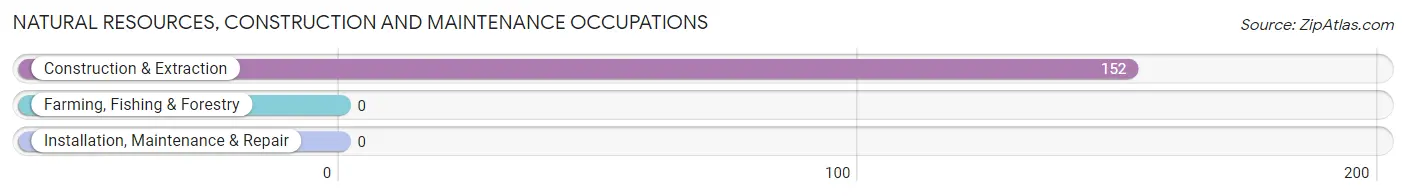
Natural Resources, Construction and Maintenance Occupations by Sex
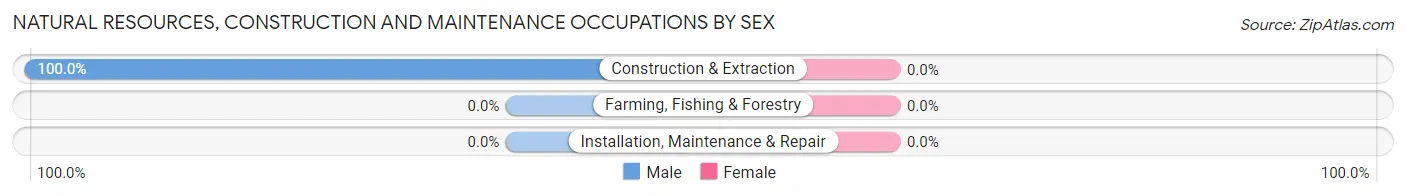
| Occupation | Male | Female |
| Farming, Fishing & Forestry | 0 (0.0%) | 0 (0.0%) |
| Construction & Extraction | 152 (100.0%) | 0 (0.0%) |
| Installation, Maintenance & Repair | 0 (0.0%) | 0 (0.0%) |
| Total (Category) | 152 (100.0%) | 0 (0.0%) |
| Total (Overall) | 495 (52.3%) | 452 (47.7%) |
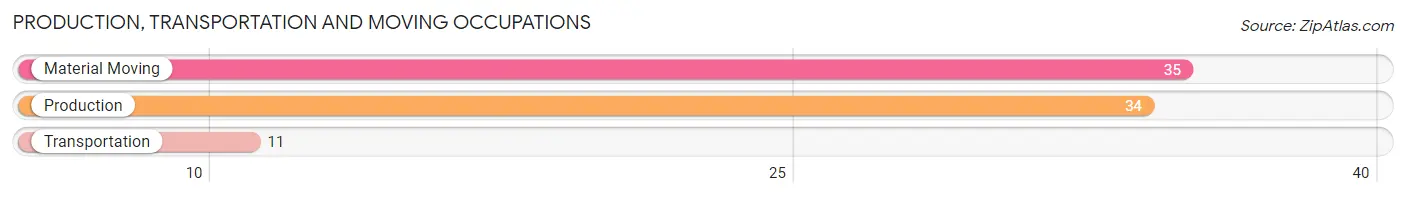
Production, Transportation and Moving Occupations
The most common Production, Transportation and Moving occupations in Indian River are Material Moving (35 | 3.7%), Production (34 | 3.6%), and Transportation (11 | 1.2%).
Production, Transportation and Moving Occupations by Sex
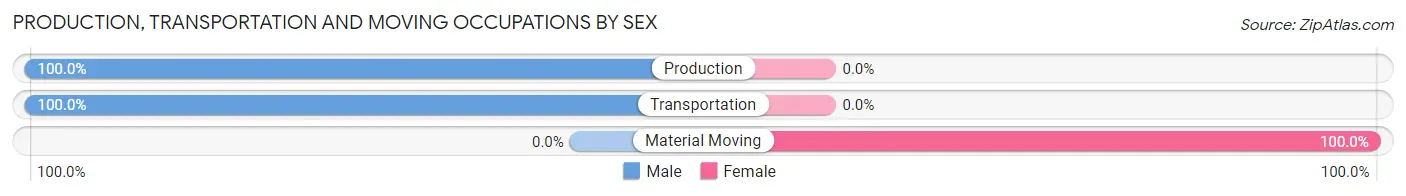
| Occupation | Male | Female |
| Production | 34 (100.0%) | 0 (0.0%) |
| Transportation | 11 (100.0%) | 0 (0.0%) |
| Material Moving | 0 (0.0%) | 35 (100.0%) |
| Total (Category) | 45 (56.2%) | 35 (43.8%) |
| Total (Overall) | 495 (52.3%) | 452 (47.7%) |
Employment Industries by Sex in Indian River
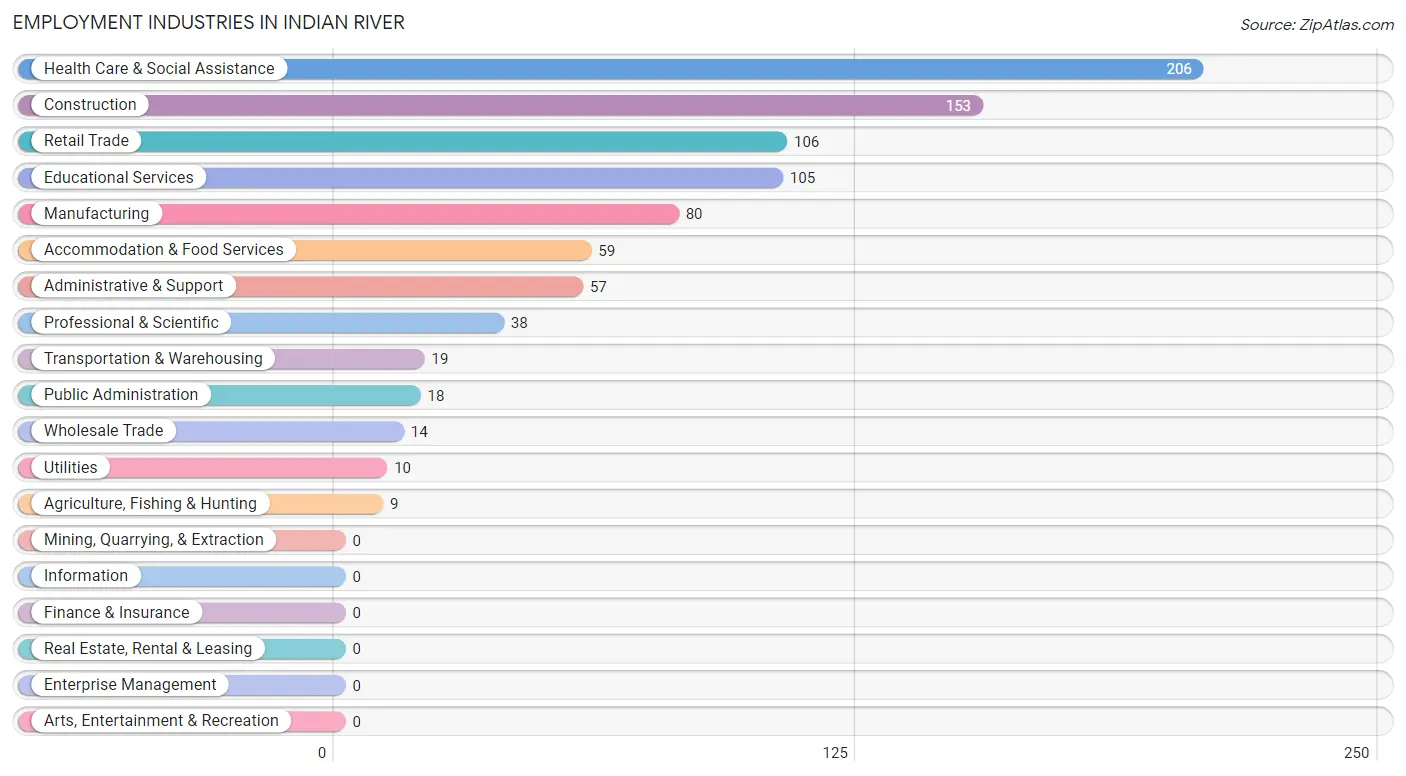
Employment Industries in Indian River
The major employment industries in Indian River include Health Care & Social Assistance (206 | 21.7%), Construction (153 | 16.2%), Retail Trade (106 | 11.2%), Educational Services (105 | 11.1%), and Manufacturing (80 | 8.5%).
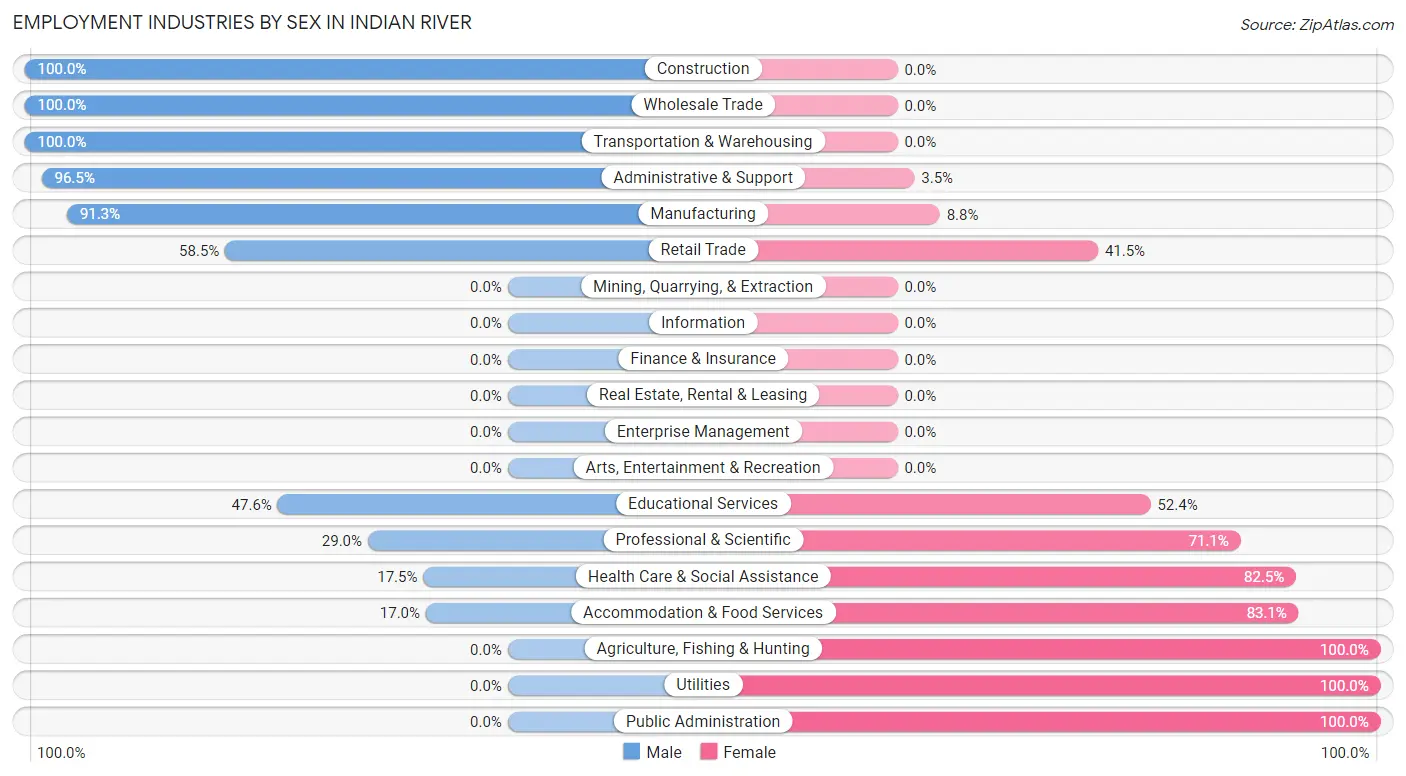
Employment Industries by Sex in Indian River
The Indian River industries that see more men than women are Construction (100.0%), Wholesale Trade (100.0%), and Transportation & Warehousing (100.0%), whereas the industries that tend to have a higher number of women are Agriculture, Fishing & Hunting (100.0%), Utilities (100.0%), and Public Administration (100.0%).
| Industry | Male | Female |
| Agriculture, Fishing & Hunting | 0 (0.0%) | 9 (100.0%) |
| Mining, Quarrying, & Extraction | 0 (0.0%) | 0 (0.0%) |
| Construction | 153 (100.0%) | 0 (0.0%) |
| Manufacturing | 73 (91.2%) | 7 (8.7%) |
| Wholesale Trade | 14 (100.0%) | 0 (0.0%) |
| Retail Trade | 62 (58.5%) | 44 (41.5%) |
| Transportation & Warehousing | 19 (100.0%) | 0 (0.0%) |
| Utilities | 0 (0.0%) | 10 (100.0%) |
| Information | 0 (0.0%) | 0 (0.0%) |
| Finance & Insurance | 0 (0.0%) | 0 (0.0%) |
| Real Estate, Rental & Leasing | 0 (0.0%) | 0 (0.0%) |
| Professional & Scientific | 11 (28.9%) | 27 (71.1%) |
| Enterprise Management | 0 (0.0%) | 0 (0.0%) |
| Administrative & Support | 55 (96.5%) | 2 (3.5%) |
| Educational Services | 50 (47.6%) | 55 (52.4%) |
| Health Care & Social Assistance | 36 (17.5%) | 170 (82.5%) |
| Arts, Entertainment & Recreation | 0 (0.0%) | 0 (0.0%) |
| Accommodation & Food Services | 10 (17.0%) | 49 (83.1%) |
| Public Administration | 0 (0.0%) | 18 (100.0%) |
| Total | 495 (52.3%) | 452 (47.7%) |
Education in Indian River
School Enrollment in Indian River
The most common levels of schooling among the 243 students in Indian River are high school (82 | 33.7%), middle school (69 | 28.4%), and graduate / professional (47 | 19.3%).
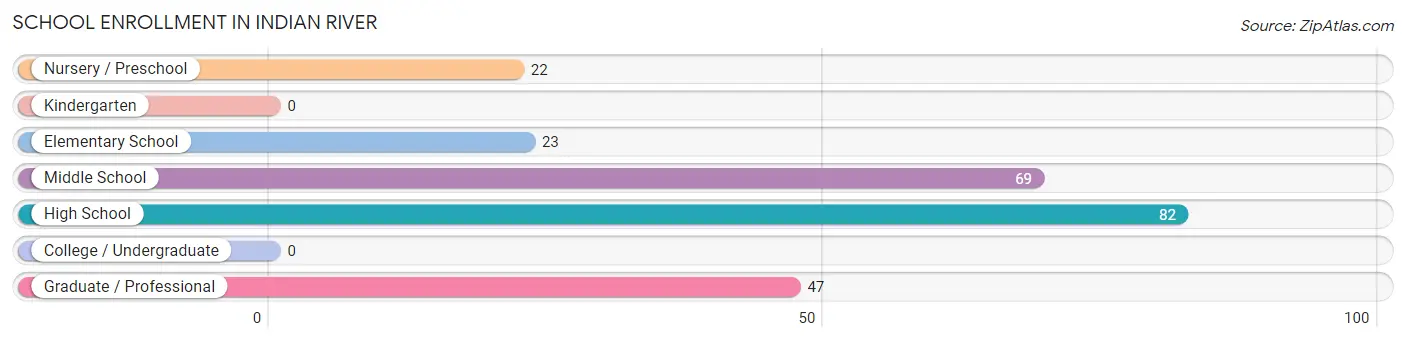
| School Level | # Students | % Students |
| Nursery / Preschool | 22 | 9.0% |
| Kindergarten | 0 | 0.0% |
| Elementary School | 23 | 9.5% |
| Middle School | 69 | 28.4% |
| High School | 82 | 33.7% |
| College / Undergraduate | 0 | 0.0% |
| Graduate / Professional | 47 | 19.3% |
| Total | 243 | 100.0% |
School Enrollment by Age by Funding Source in Indian River
Out of a total of 243 students who are enrolled in schools in Indian River, 74 (30.5%) attend a private institution, while the remaining 169 (69.5%) are enrolled in public schools. The age group of 25 to 34 year olds has the highest likelihood of being enrolled in private schools, with 47 (100.0% in the age bracket) enrolled. Conversely, the age group of 3 to 4 year olds has the lowest likelihood of being enrolled in a private school, with 22 (100.0% in the age bracket) attending a public institution.
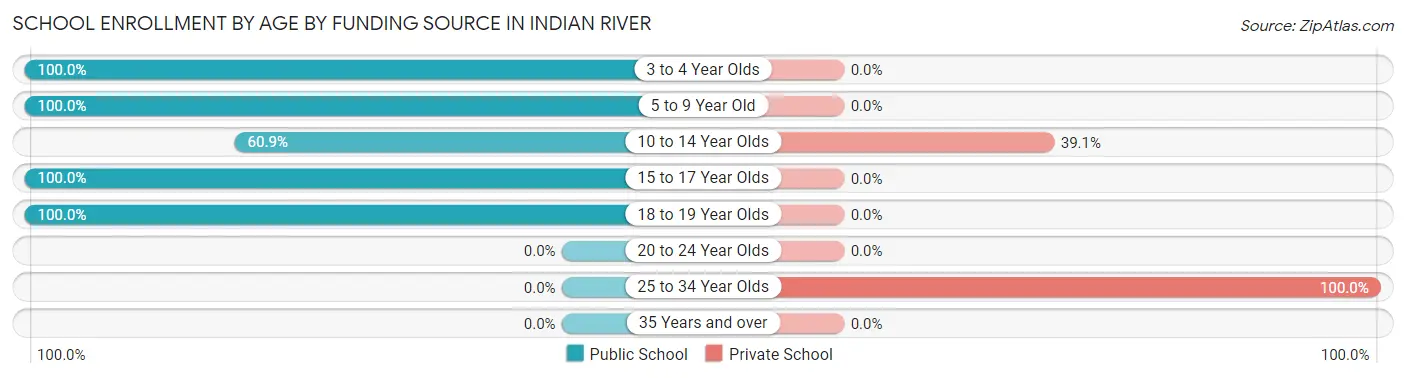
| Age Bracket | Public School | Private School |
| 3 to 4 Year Olds | 22 (100.0%) | 0 (0.0%) |
| 5 to 9 Year Old | 23 (100.0%) | 0 (0.0%) |
| 10 to 14 Year Olds | 42 (60.9%) | 27 (39.1%) |
| 15 to 17 Year Olds | 66 (100.0%) | 0 (0.0%) |
| 18 to 19 Year Olds | 16 (100.0%) | 0 (0.0%) |
| 20 to 24 Year Olds | 0 (0.0%) | 0 (0.0%) |
| 25 to 34 Year Olds | 0 (0.0%) | 47 (100.0%) |
| 35 Years and over | 0 (0.0%) | 0 (0.0%) |
| Total | 169 (69.5%) | 74 (30.5%) |
Educational Attainment by Field of Study in Indian River
Education (205 | 31.2%), business (92 | 14.0%), psychology (66 | 10.0%), social sciences (54 | 8.2%), and communications (47 | 7.1%) are the most common fields of study among 658 individuals in Indian River who have obtained a bachelor's degree or higher.
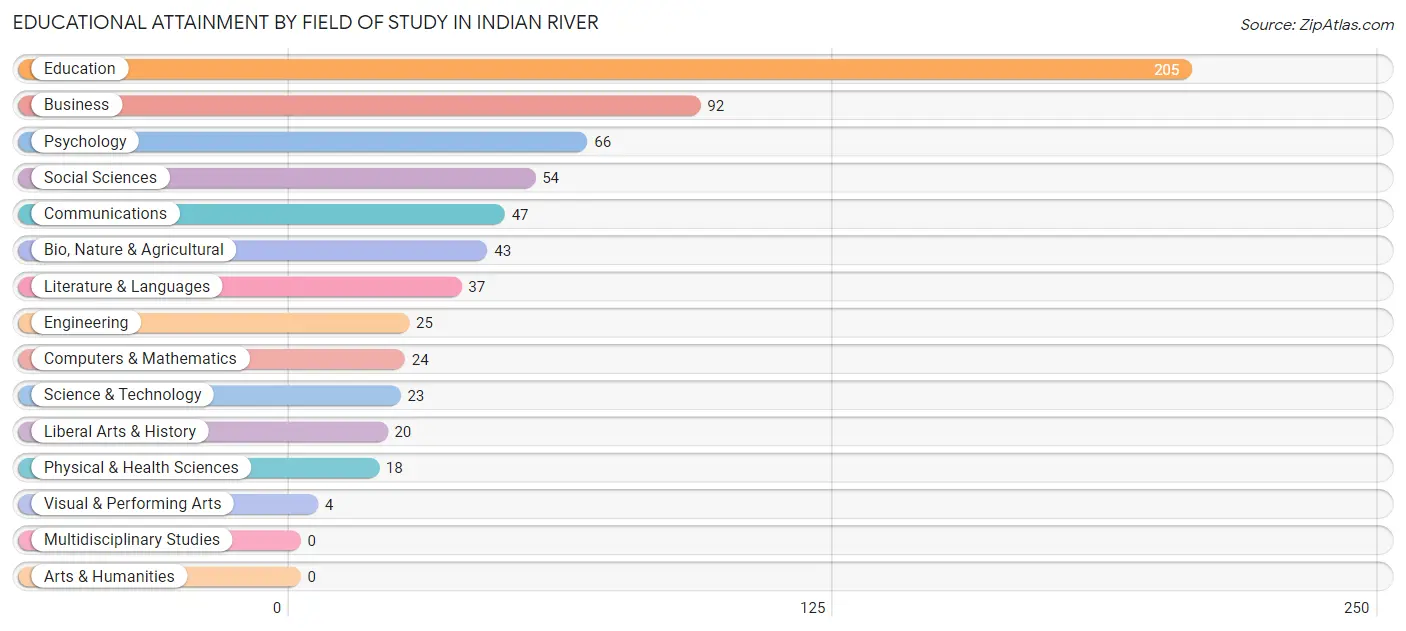
| Field of Study | # Graduates | % Graduates |
| Computers & Mathematics | 24 | 3.6% |
| Bio, Nature & Agricultural | 43 | 6.5% |
| Physical & Health Sciences | 18 | 2.7% |
| Psychology | 66 | 10.0% |
| Social Sciences | 54 | 8.2% |
| Engineering | 25 | 3.8% |
| Multidisciplinary Studies | 0 | 0.0% |
| Science & Technology | 23 | 3.5% |
| Business | 92 | 14.0% |
| Education | 205 | 31.2% |
| Literature & Languages | 37 | 5.6% |
| Liberal Arts & History | 20 | 3.0% |
| Visual & Performing Arts | 4 | 0.6% |
| Communications | 47 | 7.1% |
| Arts & Humanities | 0 | 0.0% |
| Total | 658 | 100.0% |
Transportation & Commute in Indian River
Vehicle Availability by Sex in Indian River
The most prevalent vehicle ownership categories in Indian River are males with 2 vehicles (151, accounting for 31.1%) and females with 2 vehicles (75, making up 33.4%).
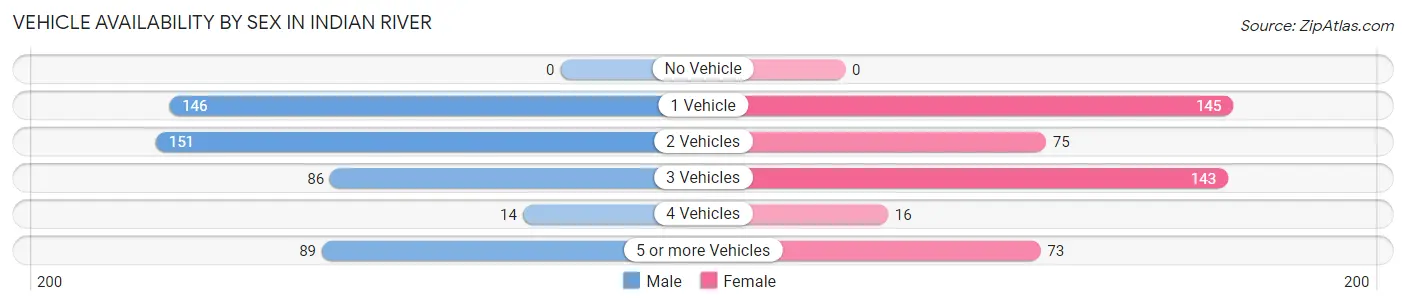
| Vehicles Available | Male | Female |
| No Vehicle | 0 (0.0%) | 0 (0.0%) |
| 1 Vehicle | 146 (30.0%) | 145 (32.1%) |
| 2 Vehicles | 151 (31.1%) | 75 (16.6%) |
| 3 Vehicles | 86 (17.7%) | 143 (31.6%) |
| 4 Vehicles | 14 (2.9%) | 16 (3.5%) |
| 5 or more Vehicles | 89 (18.3%) | 73 (16.2%) |
| Total | 486 (100.0%) | 452 (100.0%) |
Commute Time in Indian River
The most frequently occuring commute durations in Indian River are 25 to 29 minutes (209 commuters, 25.2%), 5 to 9 minutes (154 commuters, 18.5%), and 30 to 34 minutes (151 commuters, 18.2%).
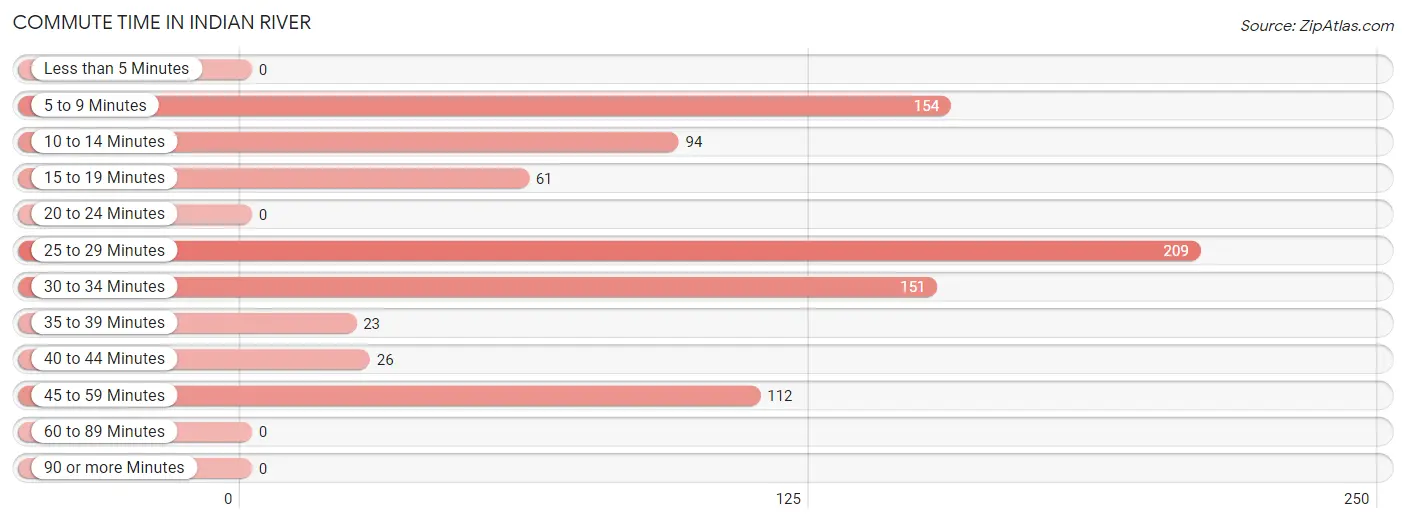
| Commute Time | # Commuters | % Commuters |
| Less than 5 Minutes | 0 | 0.0% |
| 5 to 9 Minutes | 154 | 18.5% |
| 10 to 14 Minutes | 94 | 11.3% |
| 15 to 19 Minutes | 61 | 7.3% |
| 20 to 24 Minutes | 0 | 0.0% |
| 25 to 29 Minutes | 209 | 25.2% |
| 30 to 34 Minutes | 151 | 18.2% |
| 35 to 39 Minutes | 23 | 2.8% |
| 40 to 44 Minutes | 26 | 3.1% |
| 45 to 59 Minutes | 112 | 13.5% |
| 60 to 89 Minutes | 0 | 0.0% |
| 90 or more Minutes | 0 | 0.0% |
Commute Time by Sex in Indian River
The most common commute times in Indian River are 25 to 29 minutes (115 commuters, 28.9%) for males and 30 to 34 minutes (108 commuters, 25.0%) for females.
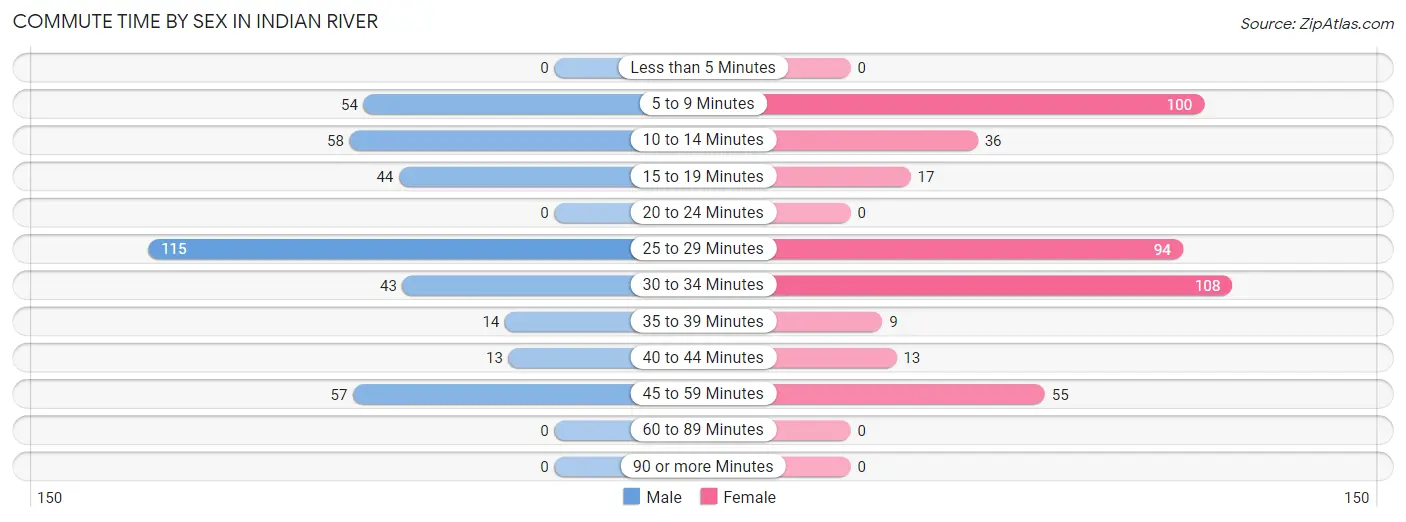
| Commute Time | Male | Female |
| Less than 5 Minutes | 0 (0.0%) | 0 (0.0%) |
| 5 to 9 Minutes | 54 (13.6%) | 100 (23.2%) |
| 10 to 14 Minutes | 58 (14.6%) | 36 (8.3%) |
| 15 to 19 Minutes | 44 (11.1%) | 17 (3.9%) |
| 20 to 24 Minutes | 0 (0.0%) | 0 (0.0%) |
| 25 to 29 Minutes | 115 (28.9%) | 94 (21.8%) |
| 30 to 34 Minutes | 43 (10.8%) | 108 (25.0%) |
| 35 to 39 Minutes | 14 (3.5%) | 9 (2.1%) |
| 40 to 44 Minutes | 13 (3.3%) | 13 (3.0%) |
| 45 to 59 Minutes | 57 (14.3%) | 55 (12.7%) |
| 60 to 89 Minutes | 0 (0.0%) | 0 (0.0%) |
| 90 or more Minutes | 0 (0.0%) | 0 (0.0%) |
Time of Departure to Work by Sex in Indian River
The most frequent times of departure to work in Indian River are 8:00 AM to 8:29 AM (99, 24.9%) for males and 7:30 AM to 7:59 AM (105, 24.3%) for females.
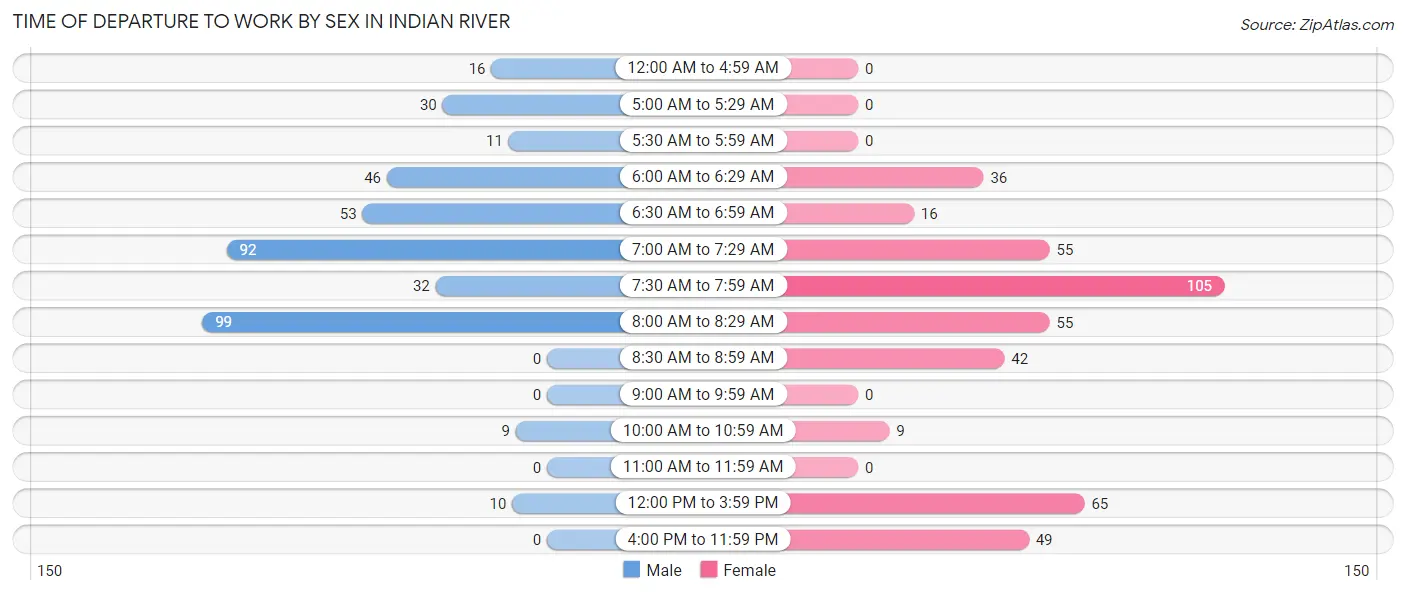
| Time of Departure | Male | Female |
| 12:00 AM to 4:59 AM | 16 (4.0%) | 0 (0.0%) |
| 5:00 AM to 5:29 AM | 30 (7.5%) | 0 (0.0%) |
| 5:30 AM to 5:59 AM | 11 (2.8%) | 0 (0.0%) |
| 6:00 AM to 6:29 AM | 46 (11.6%) | 36 (8.3%) |
| 6:30 AM to 6:59 AM | 53 (13.3%) | 16 (3.7%) |
| 7:00 AM to 7:29 AM | 92 (23.1%) | 55 (12.7%) |
| 7:30 AM to 7:59 AM | 32 (8.0%) | 105 (24.3%) |
| 8:00 AM to 8:29 AM | 99 (24.9%) | 55 (12.7%) |
| 8:30 AM to 8:59 AM | 0 (0.0%) | 42 (9.7%) |
| 9:00 AM to 9:59 AM | 0 (0.0%) | 0 (0.0%) |
| 10:00 AM to 10:59 AM | 9 (2.3%) | 9 (2.1%) |
| 11:00 AM to 11:59 AM | 0 (0.0%) | 0 (0.0%) |
| 12:00 PM to 3:59 PM | 10 (2.5%) | 65 (15.0%) |
| 4:00 PM to 11:59 PM | 0 (0.0%) | 49 (11.3%) |
| Total | 398 (100.0%) | 432 (100.0%) |
Housing Occupancy in Indian River
Occupancy by Ownership in Indian River
Of the total 1,013 dwellings in Indian River, owner-occupied units account for 812 (80.2%), while renter-occupied units make up 201 (19.8%).
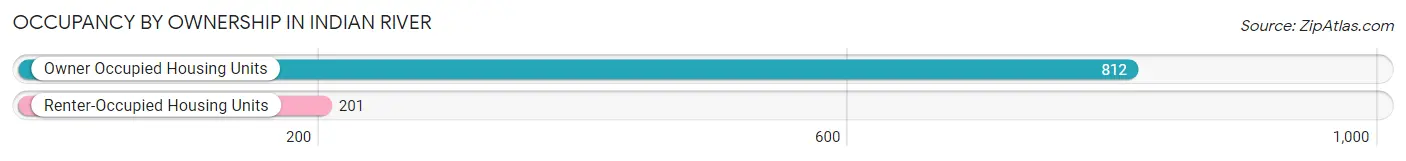
| Occupancy | # Housing Units | % Housing Units |
| Owner Occupied Housing Units | 812 | 80.2% |
| Renter-Occupied Housing Units | 201 | 19.8% |
| Total Occupied Housing Units | 1,013 | 100.0% |
Occupancy by Household Size in Indian River
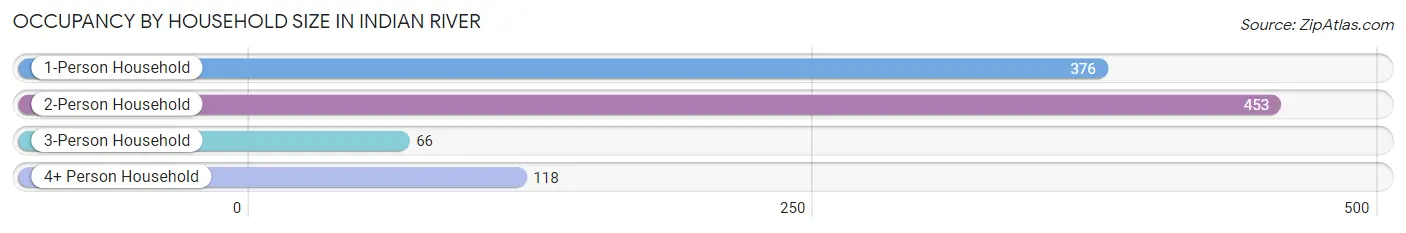
| Household Size | # Housing Units | % Housing Units |
| 1-Person Household | 376 | 37.1% |
| 2-Person Household | 453 | 44.7% |
| 3-Person Household | 66 | 6.5% |
| 4+ Person Household | 118 | 11.7% |
| Total Housing Units | 1,013 | 100.0% |
Occupancy by Ownership by Household Size in Indian River
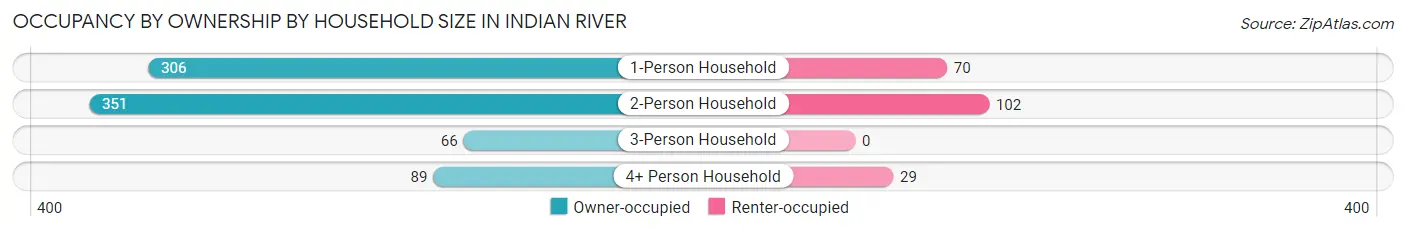
| Household Size | Owner-occupied | Renter-occupied |
| 1-Person Household | 306 (81.4%) | 70 (18.6%) |
| 2-Person Household | 351 (77.5%) | 102 (22.5%) |
| 3-Person Household | 66 (100.0%) | 0 (0.0%) |
| 4+ Person Household | 89 (75.4%) | 29 (24.6%) |
| Total Housing Units | 812 (80.2%) | 201 (19.8%) |
Occupancy by Educational Attainment in Indian River
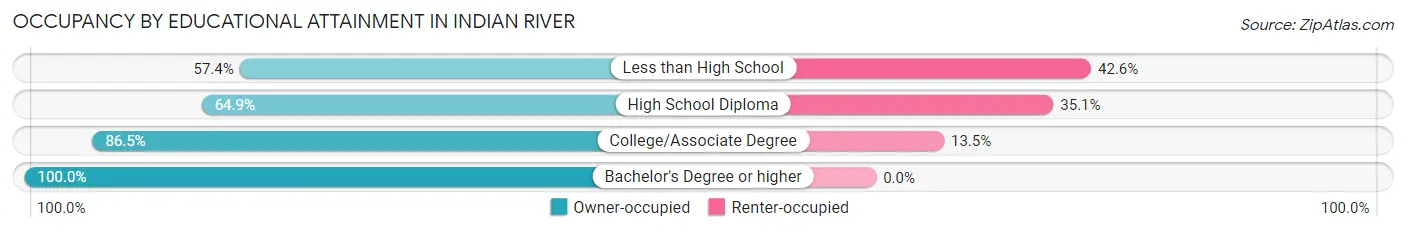
| Household Size | Owner-occupied | Renter-occupied |
| Less than High School | 66 (57.4%) | 49 (42.6%) |
| High School Diploma | 229 (64.9%) | 124 (35.1%) |
| College/Associate Degree | 180 (86.5%) | 28 (13.5%) |
| Bachelor's Degree or higher | 337 (100.0%) | 0 (0.0%) |
Occupancy by Age of Householder in Indian River
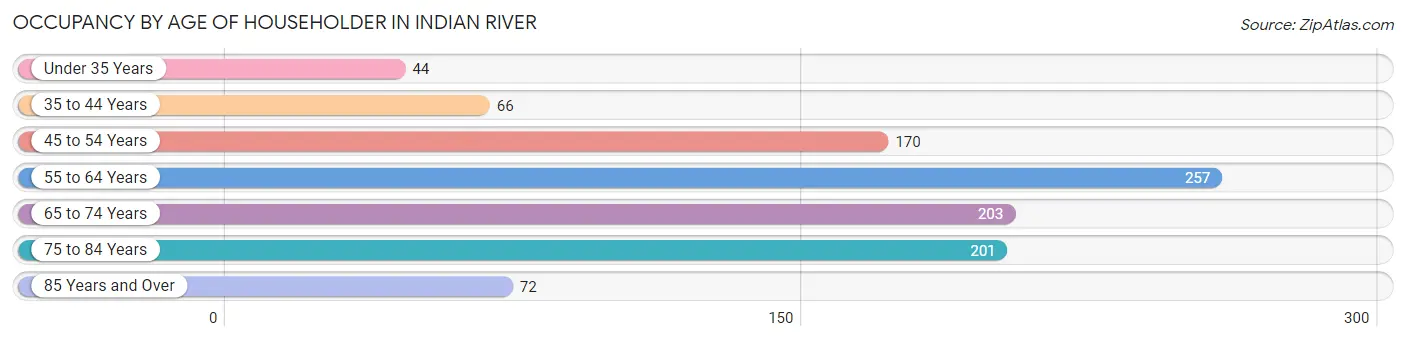
| Age Bracket | # Households | % Households |
| Under 35 Years | 44 | 4.3% |
| 35 to 44 Years | 66 | 6.5% |
| 45 to 54 Years | 170 | 16.8% |
| 55 to 64 Years | 257 | 25.4% |
| 65 to 74 Years | 203 | 20.0% |
| 75 to 84 Years | 201 | 19.8% |
| 85 Years and Over | 72 | 7.1% |
| Total | 1,013 | 100.0% |
Housing Finances in Indian River
Median Income by Occupancy in Indian River
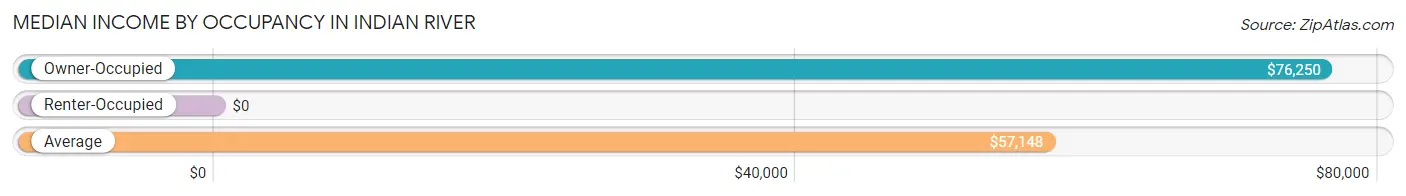
| Occupancy Type | # Households | Median Income |
| Owner-Occupied | 812 (80.2%) | $76,250 |
| Renter-Occupied | 201 (19.8%) | $0 |
| Average | 1,013 (100.0%) | $57,148 |
Occupancy by Householder Income Bracket in Indian River
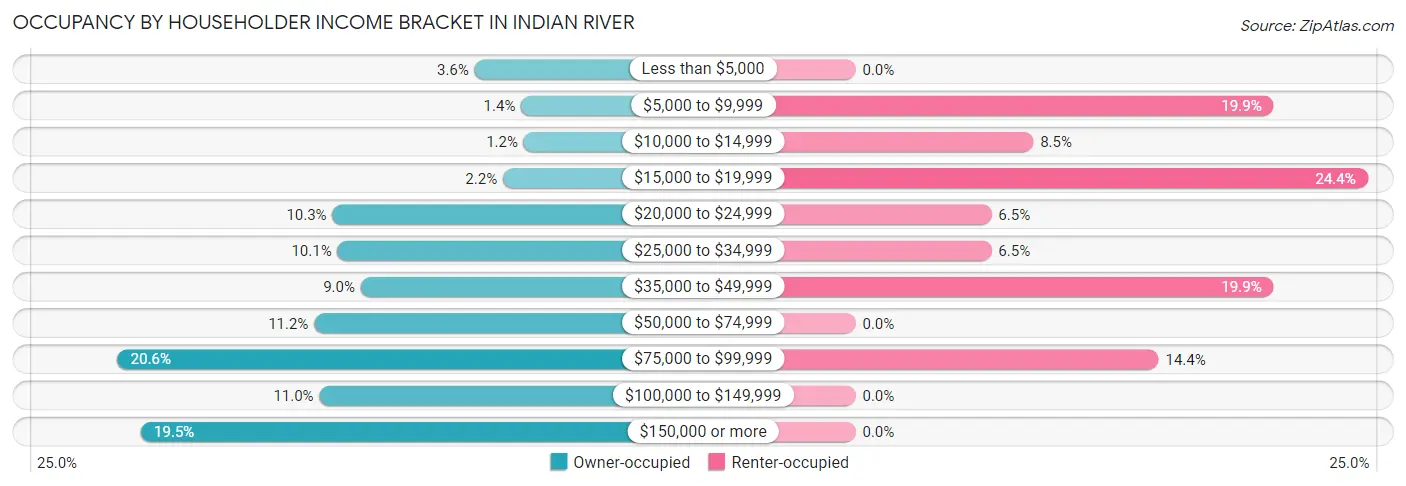
| Income Bracket | Owner-occupied | Renter-occupied |
| Less than $5,000 | 29 (3.6%) | 0 (0.0%) |
| $5,000 to $9,999 | 11 (1.3%) | 40 (19.9%) |
| $10,000 to $14,999 | 10 (1.2%) | 17 (8.5%) |
| $15,000 to $19,999 | 18 (2.2%) | 49 (24.4%) |
| $20,000 to $24,999 | 84 (10.3%) | 13 (6.5%) |
| $25,000 to $34,999 | 82 (10.1%) | 13 (6.5%) |
| $35,000 to $49,999 | 73 (9.0%) | 40 (19.9%) |
| $50,000 to $74,999 | 91 (11.2%) | 0 (0.0%) |
| $75,000 to $99,999 | 167 (20.6%) | 29 (14.4%) |
| $100,000 to $149,999 | 89 (11.0%) | 0 (0.0%) |
| $150,000 or more | 158 (19.5%) | 0 (0.0%) |
| Total | 812 (100.0%) | 201 (100.0%) |
Monthly Housing Cost Tiers in Indian River
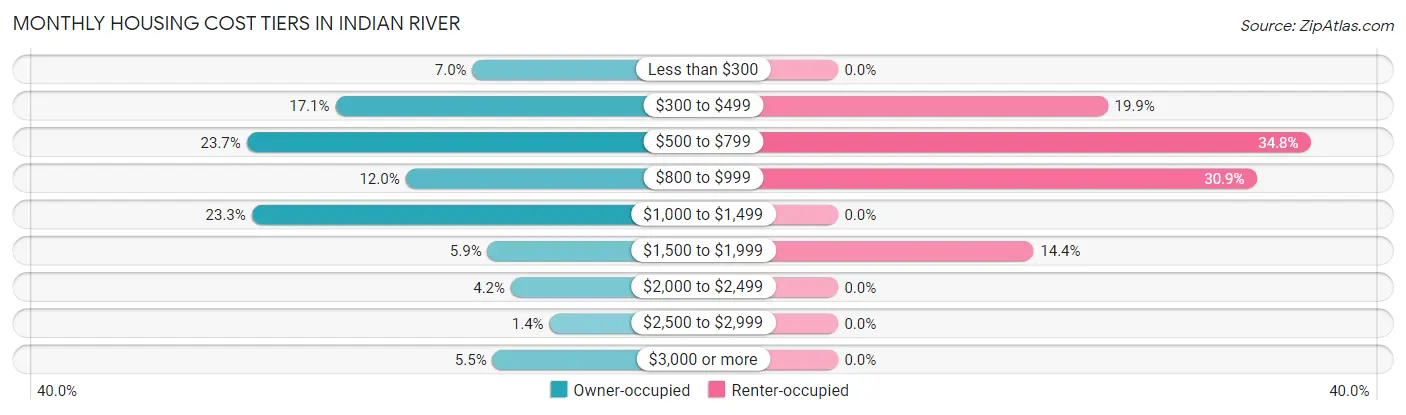
| Monthly Cost | Owner-occupied | Renter-occupied |
| Less than $300 | 57 (7.0%) | 0 (0.0%) |
| $300 to $499 | 139 (17.1%) | 40 (19.9%) |
| $500 to $799 | 192 (23.6%) | 70 (34.8%) |
| $800 to $999 | 97 (11.9%) | 62 (30.8%) |
| $1,000 to $1,499 | 189 (23.3%) | 0 (0.0%) |
| $1,500 to $1,999 | 48 (5.9%) | 29 (14.4%) |
| $2,000 to $2,499 | 34 (4.2%) | 0 (0.0%) |
| $2,500 to $2,999 | 11 (1.3%) | 0 (0.0%) |
| $3,000 or more | 45 (5.5%) | 0 (0.0%) |
| Total | 812 (100.0%) | 201 (100.0%) |
Physical Housing Characteristics in Indian River
Housing Structures in Indian River
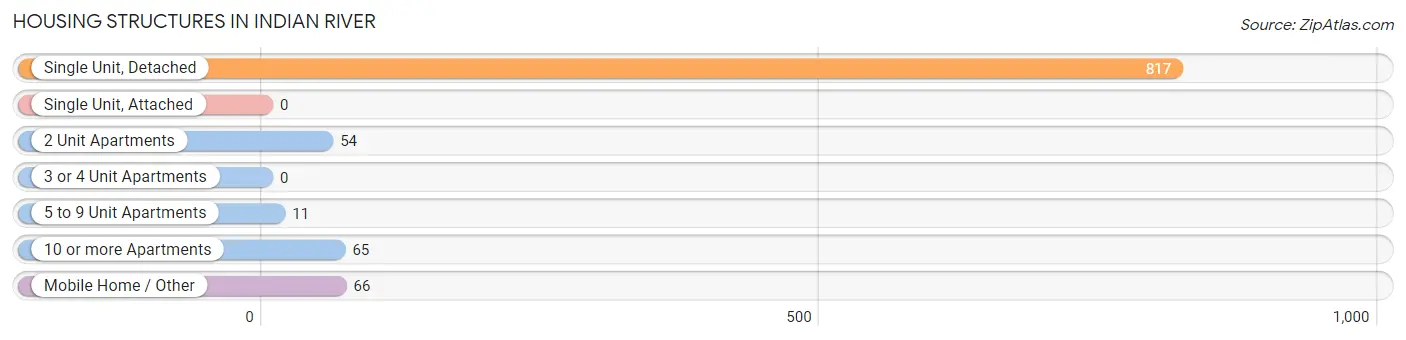
| Structure Type | # Housing Units | % Housing Units |
| Single Unit, Detached | 817 | 80.6% |
| Single Unit, Attached | 0 | 0.0% |
| 2 Unit Apartments | 54 | 5.3% |
| 3 or 4 Unit Apartments | 0 | 0.0% |
| 5 to 9 Unit Apartments | 11 | 1.1% |
| 10 or more Apartments | 65 | 6.4% |
| Mobile Home / Other | 66 | 6.5% |
| Total | 1,013 | 100.0% |
Housing Structures by Occupancy in Indian River
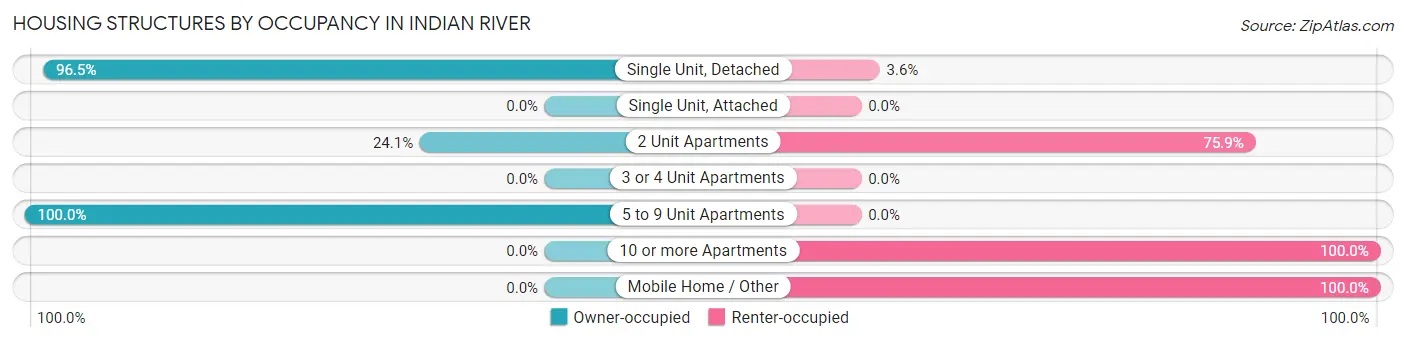
| Structure Type | Owner-occupied | Renter-occupied |
| Single Unit, Detached | 788 (96.5%) | 29 (3.5%) |
| Single Unit, Attached | 0 (0.0%) | 0 (0.0%) |
| 2 Unit Apartments | 13 (24.1%) | 41 (75.9%) |
| 3 or 4 Unit Apartments | 0 (0.0%) | 0 (0.0%) |
| 5 to 9 Unit Apartments | 11 (100.0%) | 0 (0.0%) |
| 10 or more Apartments | 0 (0.0%) | 65 (100.0%) |
| Mobile Home / Other | 0 (0.0%) | 66 (100.0%) |
| Total | 812 (80.2%) | 201 (19.8%) |
Housing Structures by Number of Rooms in Indian River
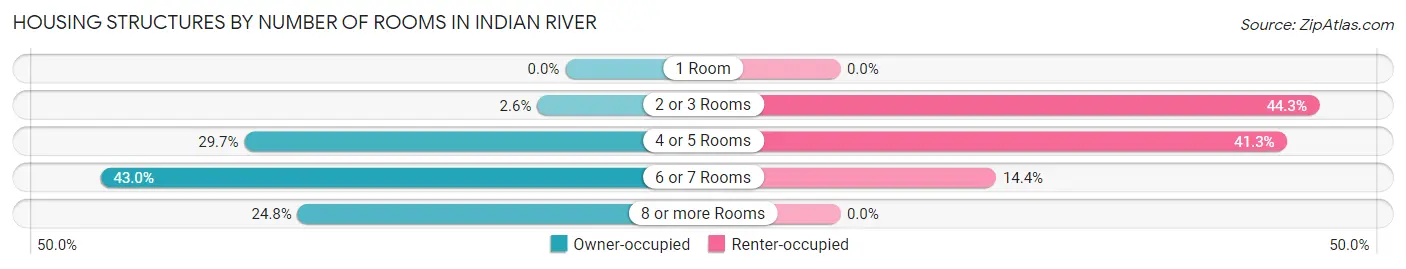
| Number of Rooms | Owner-occupied | Renter-occupied |
| 1 Room | 0 (0.0%) | 0 (0.0%) |
| 2 or 3 Rooms | 21 (2.6%) | 89 (44.3%) |
| 4 or 5 Rooms | 241 (29.7%) | 83 (41.3%) |
| 6 or 7 Rooms | 349 (43.0%) | 29 (14.4%) |
| 8 or more Rooms | 201 (24.7%) | 0 (0.0%) |
| Total | 812 (100.0%) | 201 (100.0%) |
Housing Structure by Heating Type in Indian River
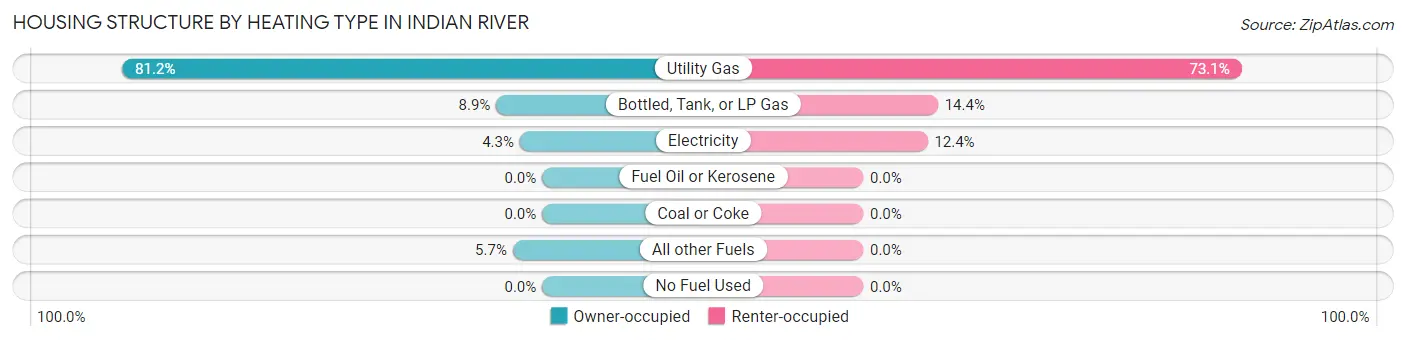
| Heating Type | Owner-occupied | Renter-occupied |
| Utility Gas | 659 (81.2%) | 147 (73.1%) |
| Bottled, Tank, or LP Gas | 72 (8.9%) | 29 (14.4%) |
| Electricity | 35 (4.3%) | 25 (12.4%) |
| Fuel Oil or Kerosene | 0 (0.0%) | 0 (0.0%) |
| Coal or Coke | 0 (0.0%) | 0 (0.0%) |
| All other Fuels | 46 (5.7%) | 0 (0.0%) |
| No Fuel Used | 0 (0.0%) | 0 (0.0%) |
| Total | 812 (100.0%) | 201 (100.0%) |
Household Vehicle Usage in Indian River
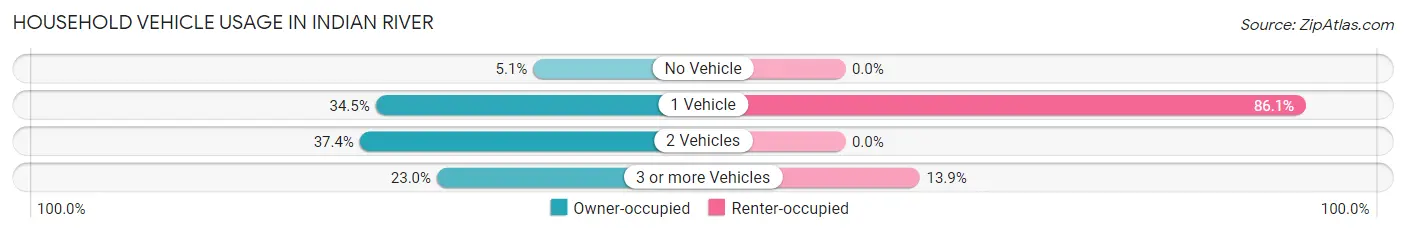
| Vehicles per Household | Owner-occupied | Renter-occupied |
| No Vehicle | 41 (5.1%) | 0 (0.0%) |
| 1 Vehicle | 280 (34.5%) | 173 (86.1%) |
| 2 Vehicles | 304 (37.4%) | 0 (0.0%) |
| 3 or more Vehicles | 187 (23.0%) | 28 (13.9%) |
| Total | 812 (100.0%) | 201 (100.0%) |
Real Estate & Mortgages in Indian River
Real Estate and Mortgage Overview in Indian River
| Characteristic | Without Mortgage | With Mortgage |
| Housing Units | 388 | 424 |
| Median Property Value | $171,200 | $295,500 |
| Median Household Income | - | - |
| Monthly Housing Costs | $498 | $12 |
| Real Estate Taxes | $1,777 | $0 |
Property Value by Mortgage Status in Indian River
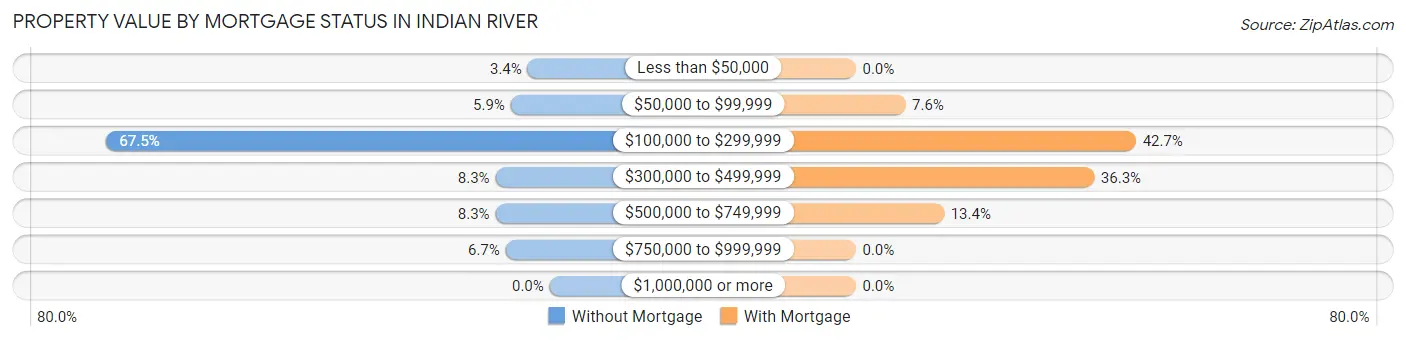
| Property Value | Without Mortgage | With Mortgage |
| Less than $50,000 | 13 (3.4%) | 0 (0.0%) |
| $50,000 to $99,999 | 23 (5.9%) | 32 (7.5%) |
| $100,000 to $299,999 | 262 (67.5%) | 181 (42.7%) |
| $300,000 to $499,999 | 32 (8.3%) | 154 (36.3%) |
| $500,000 to $749,999 | 32 (8.3%) | 57 (13.4%) |
| $750,000 to $999,999 | 26 (6.7%) | 0 (0.0%) |
| $1,000,000 or more | 0 (0.0%) | 0 (0.0%) |
| Total | 388 (100.0%) | 424 (100.0%) |
Household Income by Mortgage Status in Indian River
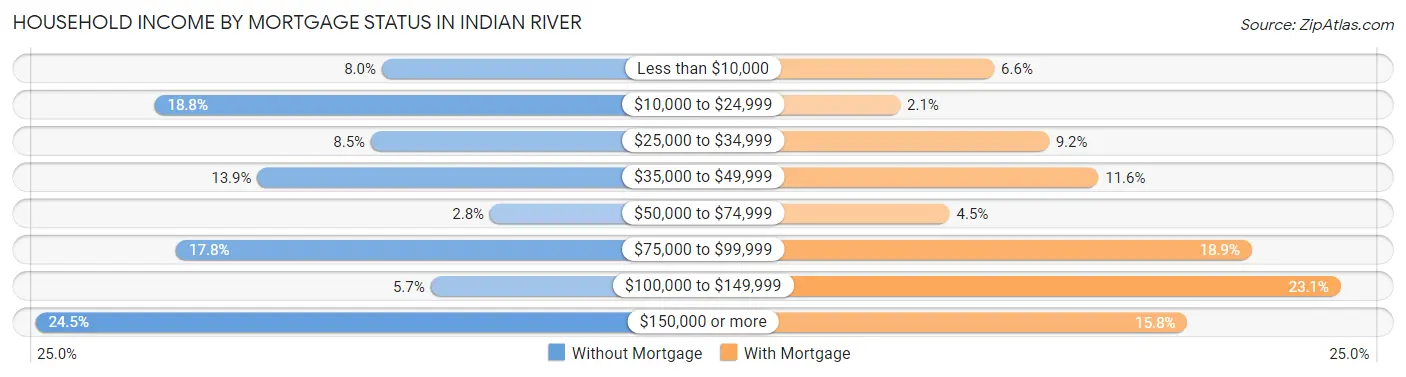
| Household Income | Without Mortgage | With Mortgage |
| Less than $10,000 | 31 (8.0%) | 28 (6.6%) |
| $10,000 to $24,999 | 73 (18.8%) | 9 (2.1%) |
| $25,000 to $34,999 | 33 (8.5%) | 39 (9.2%) |
| $35,000 to $49,999 | 54 (13.9%) | 49 (11.6%) |
| $50,000 to $74,999 | 11 (2.8%) | 19 (4.5%) |
| $75,000 to $99,999 | 69 (17.8%) | 80 (18.9%) |
| $100,000 to $149,999 | 22 (5.7%) | 98 (23.1%) |
| $150,000 or more | 95 (24.5%) | 67 (15.8%) |
| Total | 388 (100.0%) | 424 (100.0%) |
Property Value to Household Income Ratio in Indian River
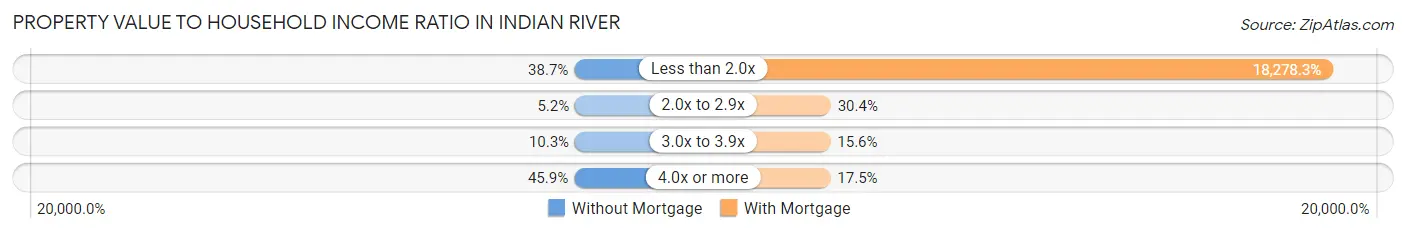
| Value-to-Income Ratio | Without Mortgage | With Mortgage |
| Less than 2.0x | 150 (38.7%) | 77,500 (18,278.3%) |
| 2.0x to 2.9x | 20 (5.1%) | 129 (30.4%) |
| 3.0x to 3.9x | 40 (10.3%) | 66 (15.6%) |
| 4.0x or more | 178 (45.9%) | 74 (17.4%) |
| Total | 388 (100.0%) | 424 (100.0%) |
Real Estate Taxes by Mortgage Status in Indian River
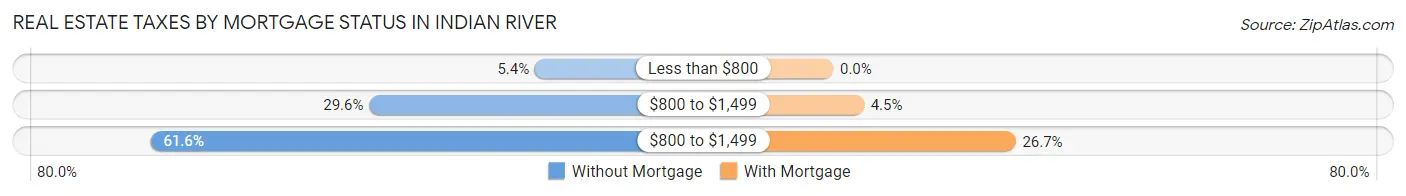
| Property Taxes | Without Mortgage | With Mortgage |
| Less than $800 | 21 (5.4%) | 0 (0.0%) |
| $800 to $1,499 | 115 (29.6%) | 19 (4.5%) |
| $800 to $1,499 | 239 (61.6%) | 113 (26.7%) |
| Total | 388 (100.0%) | 424 (100.0%) |
Health & Disability in Indian River
Health Insurance Coverage by Age in Indian River
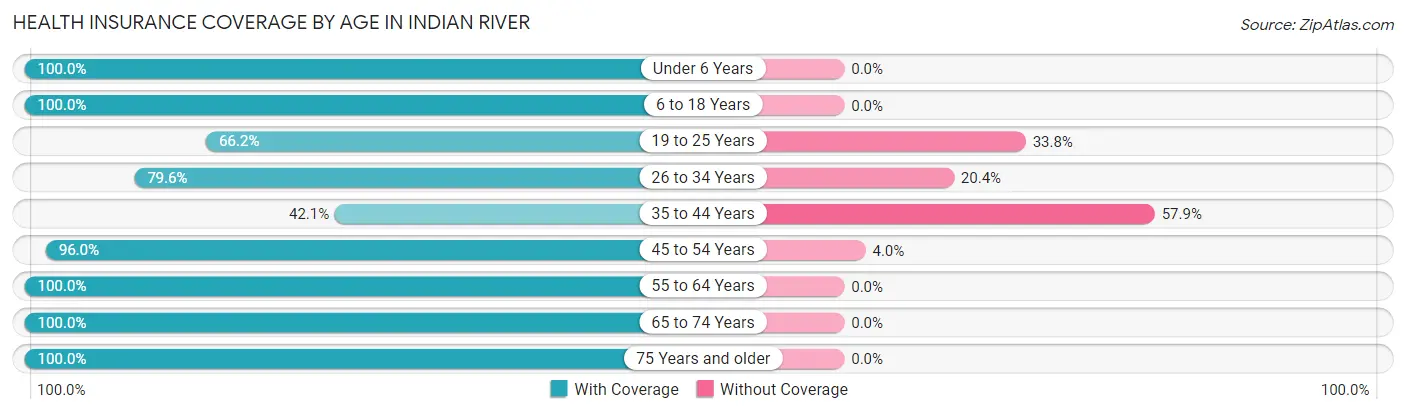
| Age Bracket | With Coverage | Without Coverage |
| Under 6 Years | 22 (100.0%) | 0 (0.0%) |
| 6 to 18 Years | 174 (100.0%) | 0 (0.0%) |
| 19 to 25 Years | 88 (66.2%) | 45 (33.8%) |
| 26 to 34 Years | 109 (79.6%) | 28 (20.4%) |
| 35 to 44 Years | 48 (42.1%) | 66 (57.9%) |
| 45 to 54 Years | 315 (96.0%) | 13 (4.0%) |
| 55 to 64 Years | 429 (100.0%) | 0 (0.0%) |
| 65 to 74 Years | 319 (100.0%) | 0 (0.0%) |
| 75 Years and older | 420 (100.0%) | 0 (0.0%) |
| Total | 1,924 (92.7%) | 152 (7.3%) |
Health Insurance Coverage by Citizenship Status in Indian River
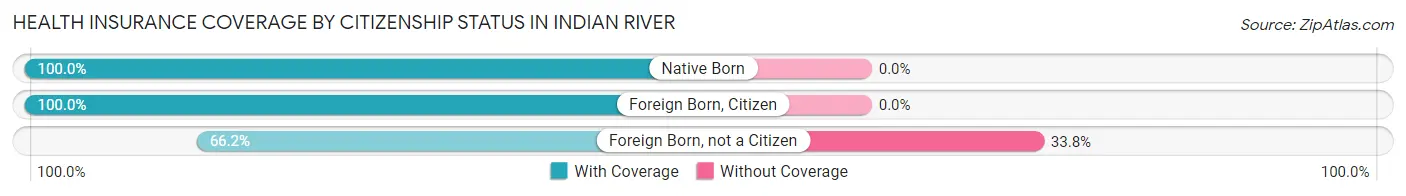
| Citizenship Status | With Coverage | Without Coverage |
| Native Born | 22 (100.0%) | 0 (0.0%) |
| Foreign Born, Citizen | 174 (100.0%) | 0 (0.0%) |
| Foreign Born, not a Citizen | 88 (66.2%) | 45 (33.8%) |
Health Insurance Coverage by Household Income in Indian River
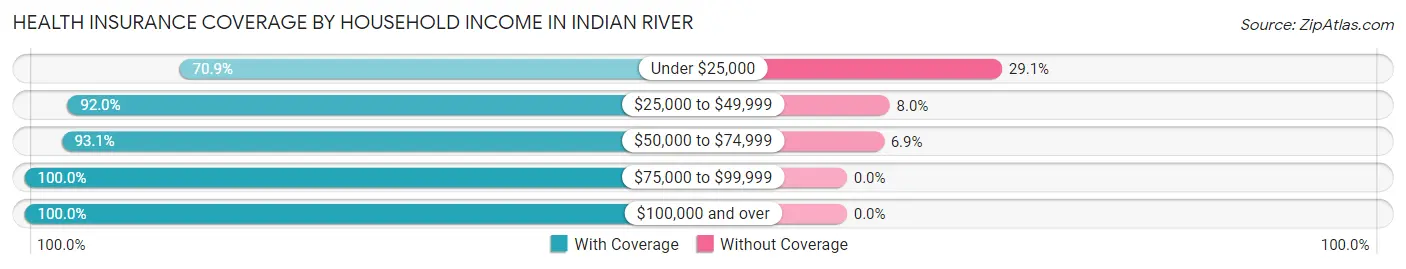
| Household Income | With Coverage | Without Coverage |
| Under $25,000 | 271 (70.9%) | 111 (29.1%) |
| $25,000 to $49,999 | 321 (92.0%) | 28 (8.0%) |
| $50,000 to $74,999 | 175 (93.1%) | 13 (6.9%) |
| $75,000 to $99,999 | 483 (100.0%) | 0 (0.0%) |
| $100,000 and over | 674 (100.0%) | 0 (0.0%) |
Public vs Private Health Insurance Coverage by Age in Indian River
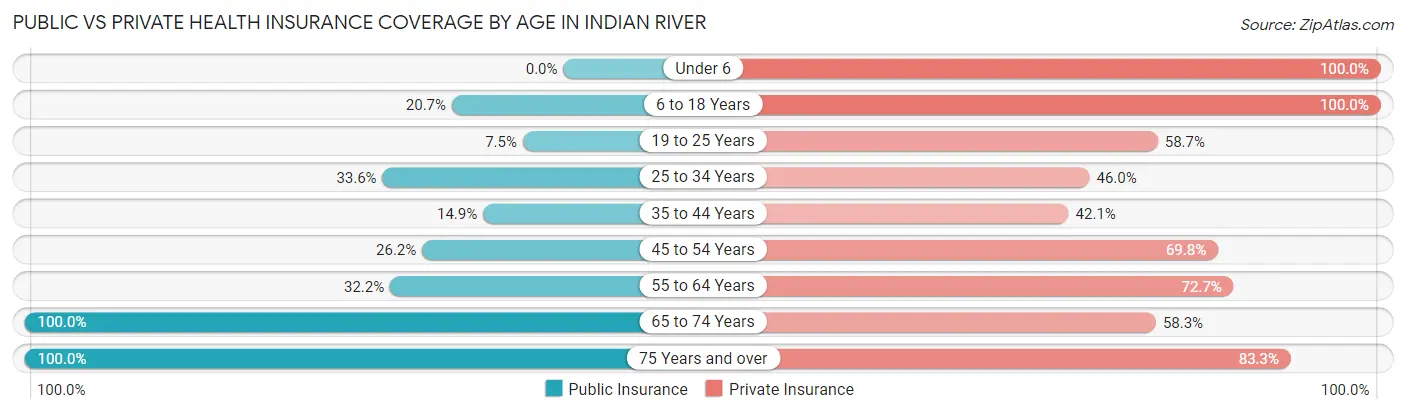
| Age Bracket | Public Insurance | Private Insurance |
| Under 6 | 0 (0.0%) | 22 (100.0%) |
| 6 to 18 Years | 36 (20.7%) | 174 (100.0%) |
| 19 to 25 Years | 10 (7.5%) | 78 (58.7%) |
| 25 to 34 Years | 46 (33.6%) | 63 (46.0%) |
| 35 to 44 Years | 17 (14.9%) | 48 (42.1%) |
| 45 to 54 Years | 86 (26.2%) | 229 (69.8%) |
| 55 to 64 Years | 138 (32.2%) | 312 (72.7%) |
| 65 to 74 Years | 319 (100.0%) | 186 (58.3%) |
| 75 Years and over | 420 (100.0%) | 350 (83.3%) |
| Total | 1,072 (51.6%) | 1,462 (70.4%) |
Disability Status by Sex by Age in Indian River
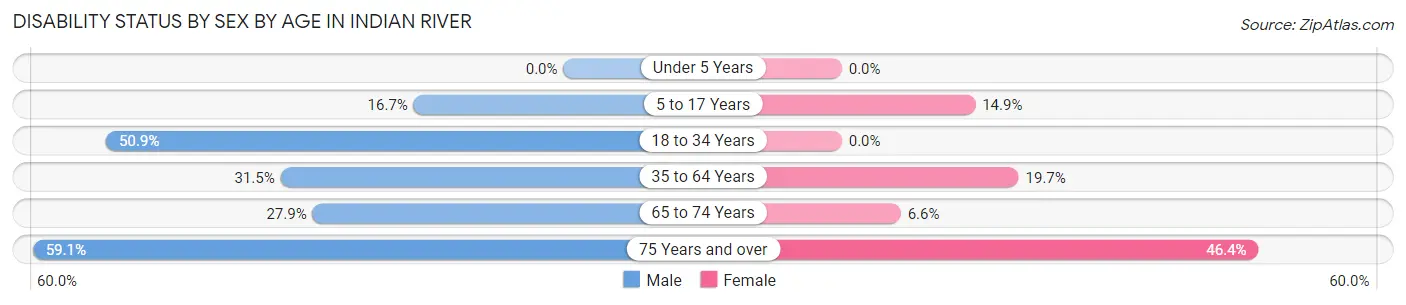
| Age Bracket | Male | Female |
| Under 5 Years | 0 (0.0%) | 0 (0.0%) |
| 5 to 17 Years | 14 (16.7%) | 11 (14.9%) |
| 18 to 34 Years | 109 (50.9%) | 0 (0.0%) |
| 35 to 64 Years | 132 (31.5%) | 89 (19.7%) |
| 65 to 74 Years | 38 (27.9%) | 12 (6.6%) |
| 75 Years and over | 117 (59.1%) | 103 (46.4%) |
Disability Class by Sex by Age in Indian River
Disability Class: Hearing Difficulty
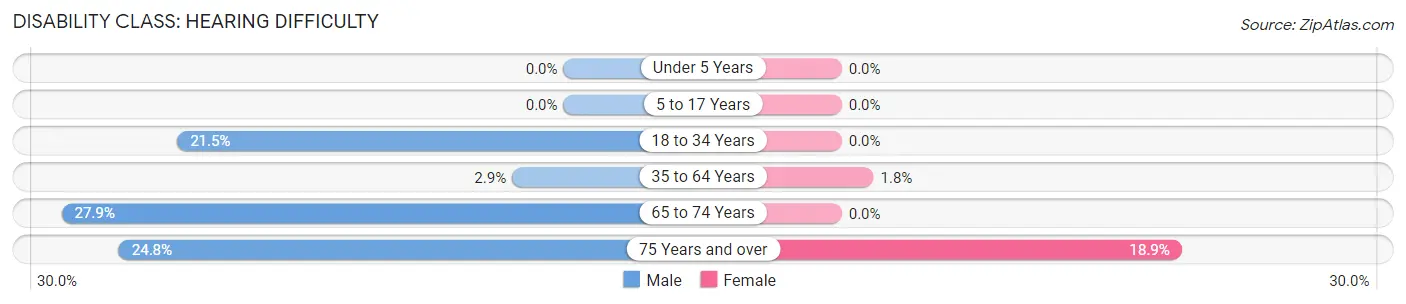
| Age Bracket | Male | Female |
| Under 5 Years | 0 (0.0%) | 0 (0.0%) |
| 5 to 17 Years | 0 (0.0%) | 0 (0.0%) |
| 18 to 34 Years | 46 (21.5%) | 0 (0.0%) |
| 35 to 64 Years | 12 (2.9%) | 8 (1.8%) |
| 65 to 74 Years | 38 (27.9%) | 0 (0.0%) |
| 75 Years and over | 49 (24.7%) | 42 (18.9%) |
Disability Class: Vision Difficulty
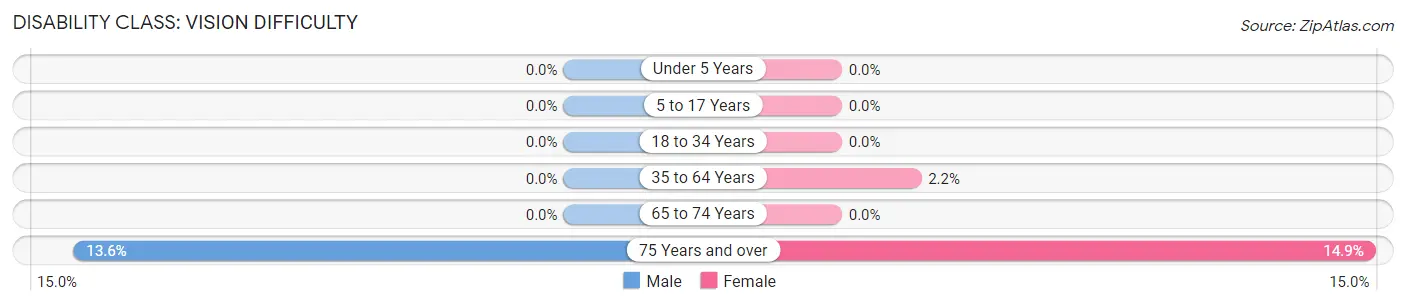
| Age Bracket | Male | Female |
| Under 5 Years | 0 (0.0%) | 0 (0.0%) |
| 5 to 17 Years | 0 (0.0%) | 0 (0.0%) |
| 18 to 34 Years | 0 (0.0%) | 0 (0.0%) |
| 35 to 64 Years | 0 (0.0%) | 10 (2.2%) |
| 65 to 74 Years | 0 (0.0%) | 0 (0.0%) |
| 75 Years and over | 27 (13.6%) | 33 (14.9%) |
Disability Class: Cognitive Difficulty
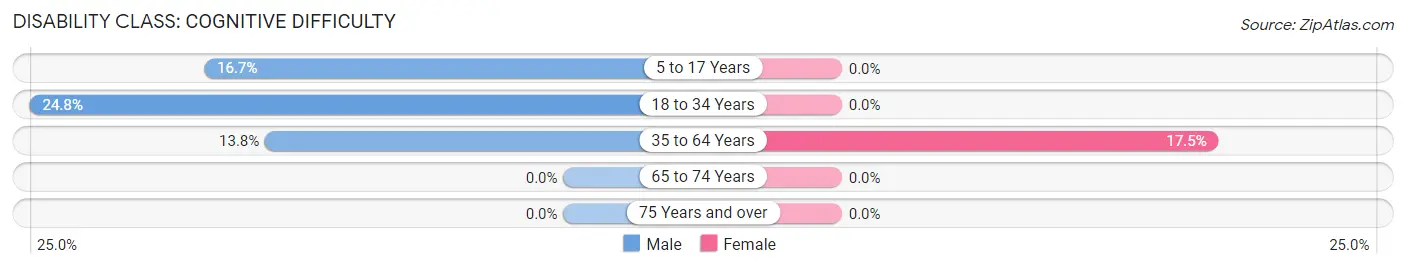
| Age Bracket | Male | Female |
| 5 to 17 Years | 14 (16.7%) | 0 (0.0%) |
| 18 to 34 Years | 53 (24.8%) | 0 (0.0%) |
| 35 to 64 Years | 58 (13.8%) | 79 (17.5%) |
| 65 to 74 Years | 0 (0.0%) | 0 (0.0%) |
| 75 Years and over | 0 (0.0%) | 0 (0.0%) |
Disability Class: Ambulatory Difficulty
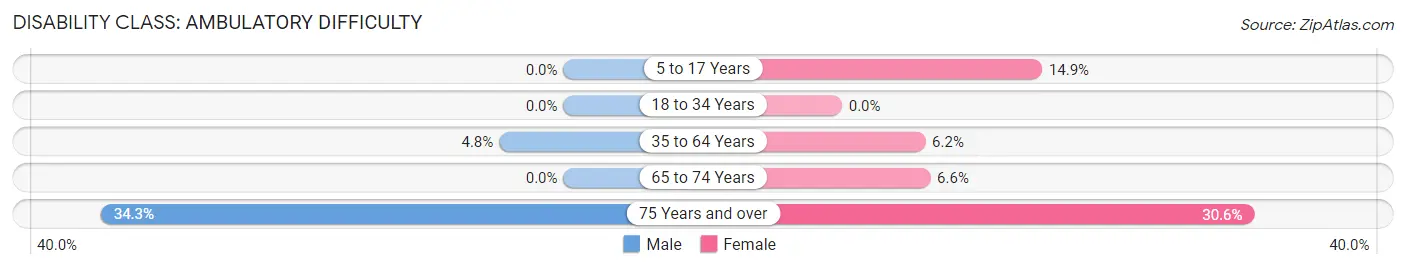
| Age Bracket | Male | Female |
| 5 to 17 Years | 0 (0.0%) | 11 (14.9%) |
| 18 to 34 Years | 0 (0.0%) | 0 (0.0%) |
| 35 to 64 Years | 20 (4.8%) | 28 (6.2%) |
| 65 to 74 Years | 0 (0.0%) | 12 (6.6%) |
| 75 Years and over | 68 (34.3%) | 68 (30.6%) |
Disability Class: Self-Care Difficulty
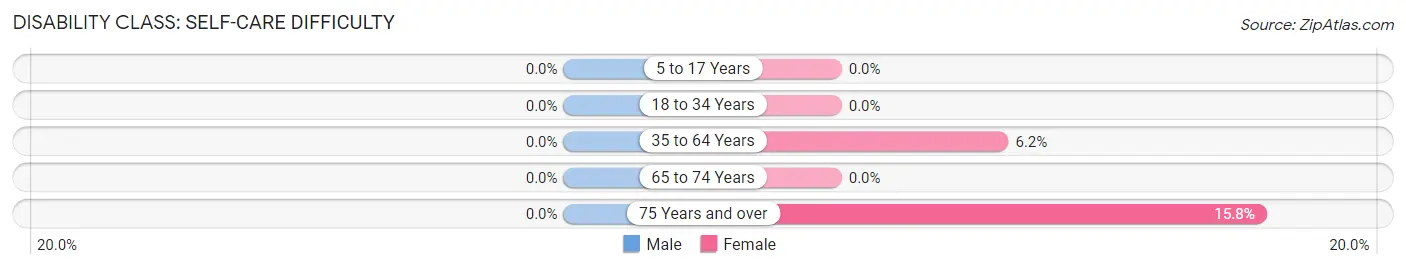
| Age Bracket | Male | Female |
| 5 to 17 Years | 0 (0.0%) | 0 (0.0%) |
| 18 to 34 Years | 0 (0.0%) | 0 (0.0%) |
| 35 to 64 Years | 0 (0.0%) | 28 (6.2%) |
| 65 to 74 Years | 0 (0.0%) | 0 (0.0%) |
| 75 Years and over | 0 (0.0%) | 35 (15.8%) |
Technology Access in Indian River
Computing Device Access in Indian River
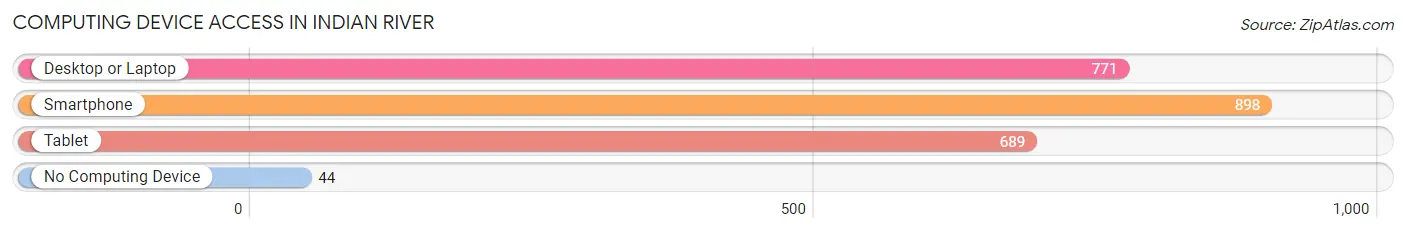
| Device Type | # Households | % Households |
| Desktop or Laptop | 771 | 76.1% |
| Smartphone | 898 | 88.6% |
| Tablet | 689 | 68.0% |
| No Computing Device | 44 | 4.3% |
| Total | 1,013 | 100.0% |
Internet Access in Indian River
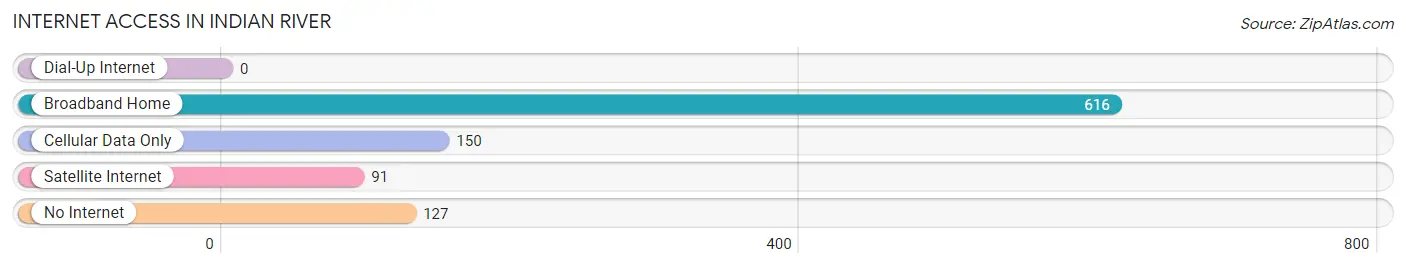
| Internet Type | # Households | % Households |
| Dial-Up Internet | 0 | 0.0% |
| Broadband Home | 616 | 60.8% |
| Cellular Data Only | 150 | 14.8% |
| Satellite Internet | 91 | 9.0% |
| No Internet | 127 | 12.5% |
| Total | 1,013 | 100.0% |
Indian River Summary
Introduction
The small town of Indian River, Michigan is located in the northern part of the state, in Cheboygan County. It is situated on the banks of the Indian River, which is a tributary of the Sturgeon River. The town is known for its natural beauty, with its lush forests, rolling hills, and crystal clear waters. It is also home to a variety of wildlife, including deer, bear, and bald eagles. The town has a population of just over 1,000 people, and is a popular tourist destination for those looking to escape the hustle and bustle of city life.
History
The area that is now Indian River was first settled in the late 1800s by a group of lumberjacks. The town was originally called “Indian River Station”, and was a stop on the Detroit and Mackinac Railway. The town was officially incorporated in 1891, and the name was changed to Indian River.
The town grew rapidly in the early 1900s, as the lumber industry flourished. The town was home to several sawmills, and the population grew to over 1,000 people. The town was also home to a variety of businesses, including a hotel, a general store, and a post office.
In the 1950s, the lumber industry began to decline, and the town’s population began to decline as well. The town was eventually bypassed by the interstate, and the population continued to decline. In the late 1990s, the town began to experience a resurgence, as tourism began to increase.
Geography
Indian River is located in the northern part of Michigan, in Cheboygan County. It is situated on the banks of the Indian River, which is a tributary of the Sturgeon River. The town is surrounded by lush forests, rolling hills, and crystal clear waters. The town is also home to a variety of wildlife, including deer, bear, and bald eagles.
Economy
The economy of Indian River is largely based on tourism. The town is home to a variety of attractions, including the Indian River Canoe Museum, the Indian River Nature Center, and the Indian River Marina. The town is also home to a variety of restaurants, shops, and lodging.
The town is also home to a variety of businesses, including a grocery store, a hardware store, and a gas station. The town is also home to a variety of manufacturing businesses, including a furniture factory and a boat manufacturing plant.
Demographics
As of the 2010 census, the population of Indian River was 1,037. The racial makeup of the town was 97.2% White, 0.7% African American, 0.3% Native American, 0.2% Asian, 0.1% Pacific Islander, 0.2% from other races, and 1.3% from two or more races. Hispanic or Latino of any race were 1.3% of the population.
Conclusion
Indian River, Michigan is a small town located in the northern part of the state. It is known for its natural beauty, with its lush forests, rolling hills, and crystal clear waters. The town has a population of just over 1,000 people, and is a popular tourist destination for those looking to escape the hustle and bustle of city life. The town’s economy is largely based on tourism, and it is home to a variety of businesses, including a grocery store, a hardware store, and a gas station. The town is also home to a variety of manufacturing businesses, including a furniture factory and a boat manufacturing plant. The racial makeup of the town is 97.2% White, 0.7% African American, 0.3% Native American, 0.2% Asian, 0.1% Pacific Islander, 0.2% from other races, and 1.3% from two or more races.
Common Questions
What is Per Capita Income in Indian River?
Per Capita income in Indian River is $42,276.
What is the Median Family Income in Indian River?
Median Family Income in Indian River is $85,375.
What is the Median Household income in Indian River?
Median Household Income in Indian River is $57,148.
What is Inequality or Gini Index in Indian River?
Inequality or Gini Index in Indian River is 0.50.
What is the Total Population of Indian River?
Total Population of Indian River is 2,076.
What is the Total Male Population of Indian River?
Total Male Population of Indian River is 1,051.
What is the Total Female Population of Indian River?
Total Female Population of Indian River is 1,025.
What is the Ratio of Males per 100 Females in Indian River?
There are 102.54 Males per 100 Females in Indian River.
What is the Ratio of Females per 100 Males in Indian River?
There are 97.53 Females per 100 Males in Indian River.
What is the Median Population Age in Indian River?
Median Population Age in Indian River is 59.1 Years.
What is the Average Family Size in Indian River
Average Family Size in Indian River is 2.7 People.
What is the Average Household Size in Indian River
Average Household Size in Indian River is 2.0 People.
How Large is the Labor Force in Indian River?
There are 989 People in the Labor Forcein in Indian River.
What is the Percentage of People in the Labor Force in Indian River?
51.2% of People are in the Labor Force in Indian River.
What is the Unemployment Rate in Indian River?
Unemployment Rate in Indian River is 4.1%.