Zip Codes with the Highest Percentage of Households with Income Above $200,000 in Battle Creek, MI
RELATED REPORTS & OPTIONS
Household Income | $200k+
Battle Creek
Compare Zip Codes
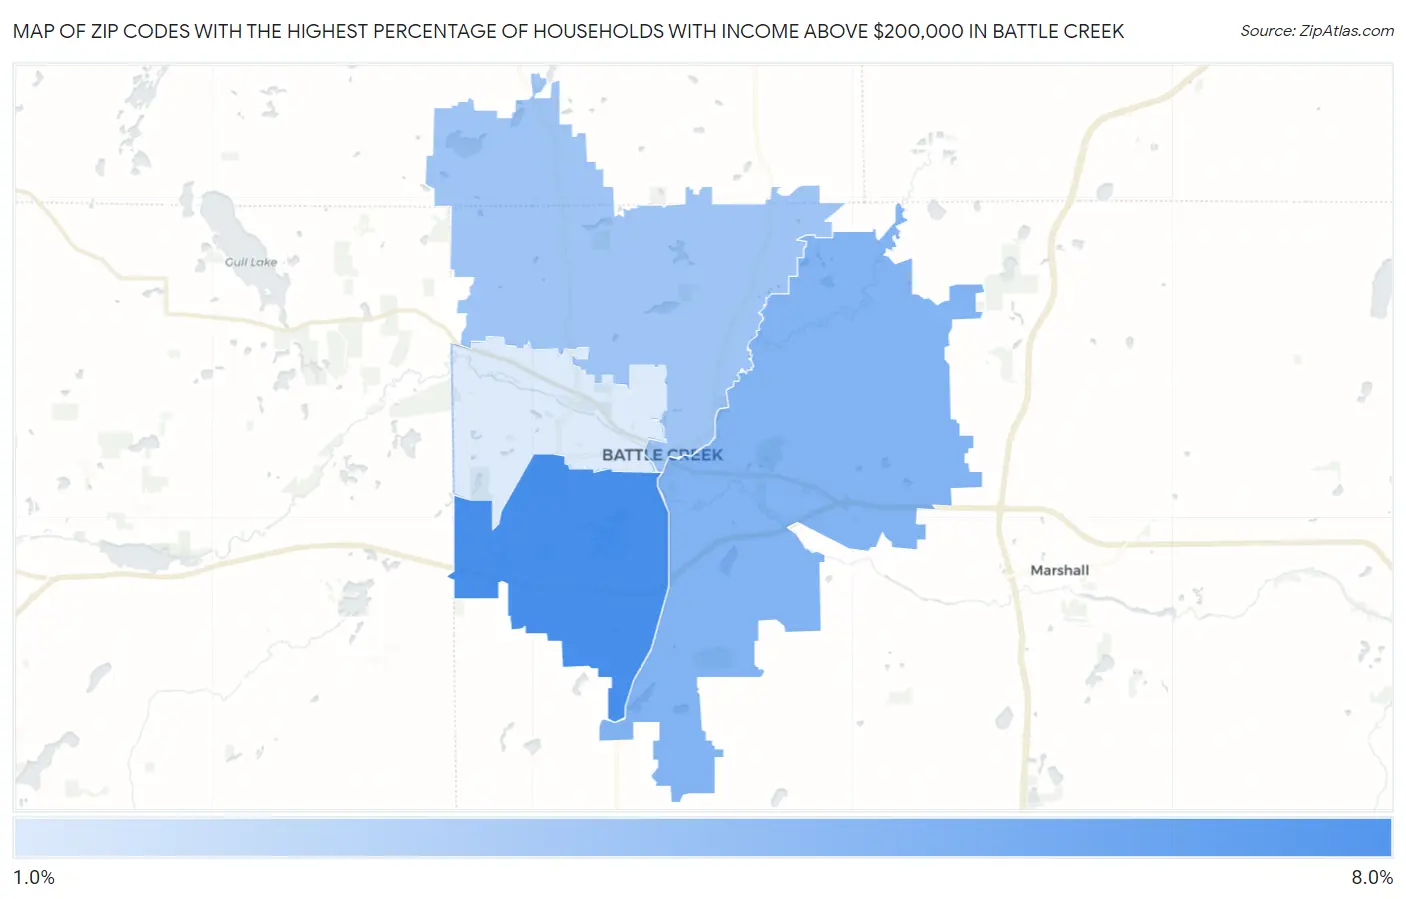
Map of Zip Codes with the Highest Percentage of Households with Income Above $200,000 in Battle Creek
1.8%
6.9%
Zip Codes with the Highest Percentage of Households with Income Above $200,000 in Battle Creek, MI
| Zip Code | Households with Income > $200k | vs State | vs National | |
| 1. | 49015 | 6.9% | 8.2%(-1.30)#282 | 11.4%(-4.50)#11,911 |
| 2. | 49014 | 4.9% | 8.2%(-3.30)#407 | 11.4%(-6.50)#15,845 |
| 3. | 49017 | 3.9% | 8.2%(-4.30)#511 | 11.4%(-7.50)#18,367 |
| 4. | 49037 | 1.8% | 8.2%(-6.40)#784 | 11.4%(-9.60)#24,311 |
1
Common Questions
What are the Top 3 Zip Codes with the Highest Percentage of Households with Income Above $200,000 in Battle Creek, MI?
Top 3 Zip Codes with the Highest Percentage of Households with Income Above $200,000 in Battle Creek, MI are:
What zip code has the Highest Percentage of Households with Income Above $200,000 in Battle Creek, MI?
49015 has the Highest Percentage of Households with Income Above $200,000 in Battle Creek, MI with 6.9%.
What is the Percentage of Households with Income Above $200,000 in Battle Creek, MI?
Percentage of Households with Income Above $200,000 in Battle Creek is 4.3%.
What is the Percentage of Households with Income Above $200,000 in Michigan?
Percentage of Households with Income Above $200,000 in Michigan is 8.2%.
What is the Percentage of Households with Income Above $200,000 in the United States?
Percentage of Households with Income Above $200,000 in the United States is 11.4%.