Cities with the Highest Percentage of Households with Income Above $200,000 in Vermont
RELATED REPORTS & OPTIONS
Household Income | $200k+
Vermont
Compare Cities
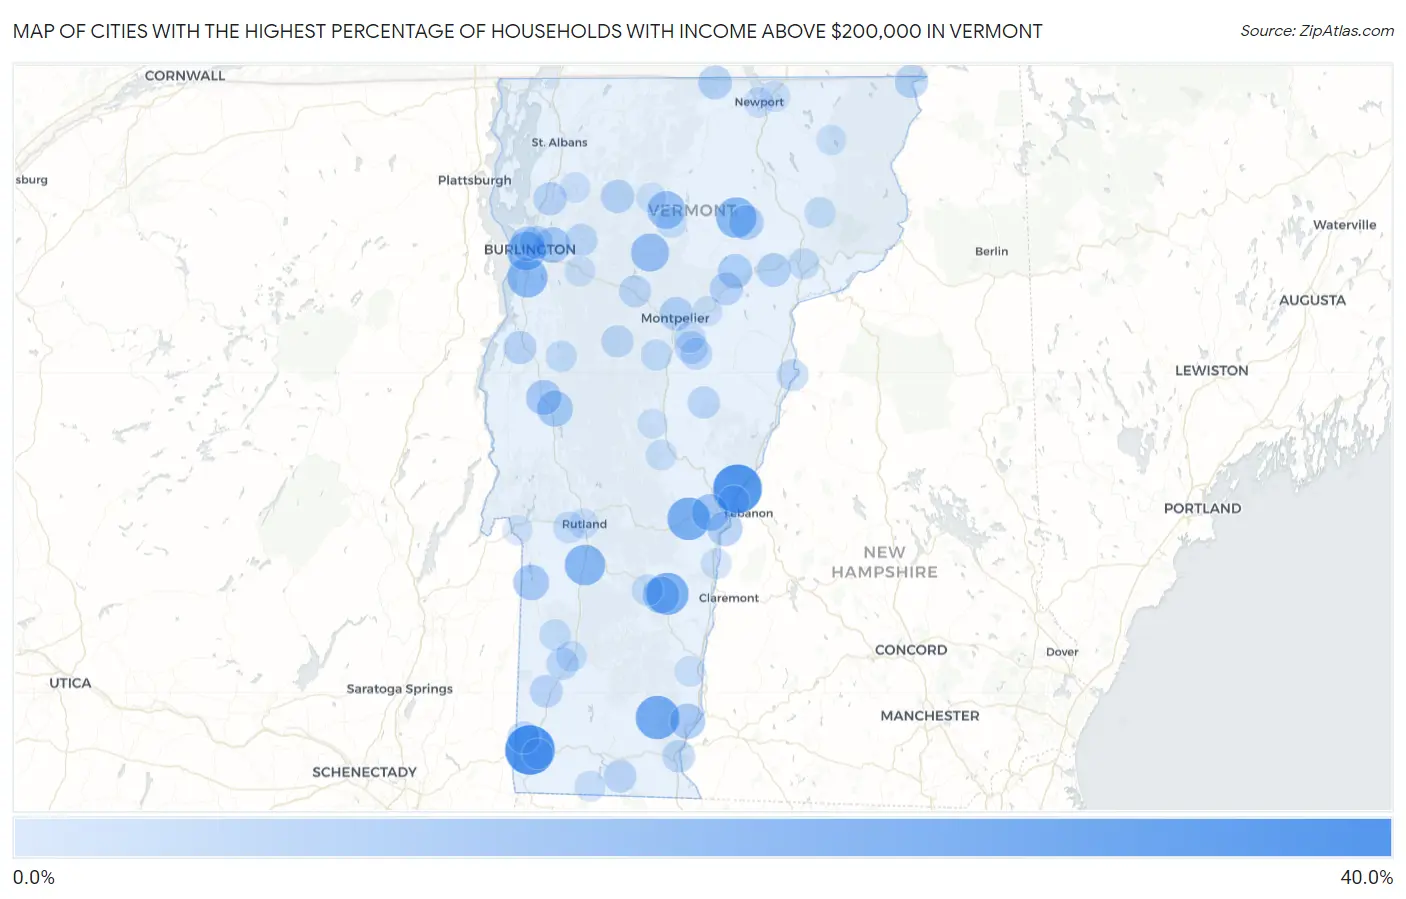
Map of Cities with the Highest Percentage of Households with Income Above $200,000 in Vermont
0.0%
40.0%
Cities with the Highest Percentage of Households with Income Above $200,000 in Vermont
| City | Households with Income > $200k | vs State | vs National | |
| 1. | Old Bennington | 36.1% | 8.9%(+27.2)#1 | 11.4%(+24.7)#1,075 |
| 2. | Norwich | 34.6% | 8.9%(+25.7)#2 | 11.4%(+23.2)#1,203 |
| 3. | Stratton Mountain | 34.5% | 8.9%(+25.6)#3 | 11.4%(+23.1)#1,216 |
| 4. | Waterbury Center | 31.9% | 8.9%(+23.0)#4 | 11.4%(+20.5)#1,442 |
| 5. | Grafton | 31.4% | 8.9%(+22.5)#5 | 11.4%(+20.0)#1,487 |
| 6. | Jamaica | 27.5% | 8.9%(+18.6)#6 | 11.4%(+16.1)#1,873 |
| 7. | Newfane | 25.5% | 8.9%(+16.6)#7 | 11.4%(+14.1)#2,121 |
| 8. | Woodstock | 24.0% | 8.9%(+15.1)#8 | 11.4%(+12.6)#2,315 |
| 9. | Cavendish | 23.1% | 8.9%(+14.2)#9 | 11.4%(+11.7)#2,474 |
| 10. | Wallingford | 20.1% | 8.9%(+11.2)#10 | 11.4%(+8.70)#3,024 |
| 11. | Greensboro | 19.6% | 8.9%(+10.7)#11 | 11.4%(+8.20)#3,146 |
| 12. | Algiers | 19.5% | 8.9%(+10.6)#12 | 11.4%(+8.10)#3,166 |
| 13. | Shelburne | 19.2% | 8.9%(+10.3)#13 | 11.4%(+7.80)#3,215 |
| 14. | South Hero | 18.5% | 8.9%(+9.60)#14 | 11.4%(+7.10)#3,401 |
| 15. | South Burlington | 16.9% | 8.9%(+8.00)#15 | 11.4%(+5.50)#3,740 |
| 16. | Stowe | 15.8% | 8.9%(+6.90)#16 | 11.4%(+4.40)#4,043 |
| 17. | South Londonderry | 15.7% | 8.9%(+6.80)#17 | 11.4%(+4.30)#4,078 |
| 18. | Hyde Park | 15.5% | 8.9%(+6.60)#18 | 11.4%(+4.10)#4,140 |
| 19. | Bolton | 15.4% | 8.9%(+6.50)#19 | 11.4%(+4.00)#4,178 |
| 20. | West Woodstock | 14.9% | 8.9%(+6.00)#20 | 11.4%(+3.50)#4,342 |
| 21. | Peacham | 14.1% | 8.9%(+5.20)#21 | 11.4%(+2.70)#4,629 |
| 22. | Proctorsville | 13.8% | 8.9%(+4.90)#22 | 11.4%(+2.40)#4,749 |
| 23. | Quechee | 13.6% | 8.9%(+4.70)#23 | 11.4%(+2.20)#4,840 |
| 24. | Weston | 12.5% | 8.9%(+3.60)#24 | 11.4%(+1.10)#5,317 |
| 25. | Stamford | 12.3% | 8.9%(+3.40)#25 | 11.4%(+0.900)#5,405 |
| 26. | East Middlebury | 12.2% | 8.9%(+3.30)#26 | 11.4%(+0.800)#5,450 |
| 27. | Townshend | 11.9% | 8.9%(+3.00)#27 | 11.4%(+0.500)#5,601 |
| 28. | East Charlotte | 11.9% | 8.9%(+3.00)#28 | 11.4%(+0.500)#5,602 |
| 29. | Essex Junction | 11.8% | 8.9%(+2.90)#29 | 11.4%(+0.400)#5,617 |
| 30. | Wells | 11.7% | 8.9%(+2.80)#30 | 11.4%(+0.300)#5,689 |
| 31. | Middlebury | 11.2% | 8.9%(+2.30)#31 | 11.4%(-0.200)#5,873 |
| 32. | Putney | 11.2% | 8.9%(+2.30)#32 | 11.4%(-0.200)#5,894 |
| 33. | North Hartland | 10.4% | 8.9%(+1.50)#33 | 11.4%(-1.000)#6,302 |
| 34. | Greensboro Bend | 10.2% | 8.9%(+1.30)#34 | 11.4%(-1.20)#6,427 |
| 35. | Westford | 9.9% | 8.9%(+1.000)#35 | 11.4%(-1.50)#6,609 |
| 36. | Burlington | 9.8% | 8.9%(+0.900)#36 | 11.4%(-1.60)#6,619 |
| 37. | Cabot | 9.6% | 8.9%(+0.700)#37 | 11.4%(-1.80)#6,810 |
| 38. | Huntington | 9.4% | 8.9%(+0.500)#38 | 11.4%(-2.00)#6,948 |
| 39. | Bakersfield | 8.8% | 8.9%(-0.100)#39 | 11.4%(-2.60)#7,334 |
| 40. | North Troy | 8.6% | 8.9%(-0.300)#40 | 11.4%(-2.80)#7,480 |
| 41. | Killington | 8.5% | 8.9%(-0.400)#41 | 11.4%(-2.90)#7,559 |
| 42. | Danville | 8.5% | 8.9%(-0.400)#42 | 11.4%(-2.90)#7,560 |
| 43. | Montpelier | 8.4% | 8.9%(-0.500)#43 | 11.4%(-3.00)#7,585 |
| 44. | Huntington Center | 8.1% | 8.9%(-0.800)#44 | 11.4%(-3.30)#7,899 |
| 45. | Winooski | 8.0% | 8.9%(-0.900)#45 | 11.4%(-3.40)#7,919 |
| 46. | Jeffersonville | 8.0% | 8.9%(-0.900)#46 | 11.4%(-3.40)#7,956 |
| 47. | Canaan | 8.0% | 8.9%(-0.900)#47 | 11.4%(-3.40)#7,973 |
| 48. | Milton | 7.7% | 8.9%(-1.20)#48 | 11.4%(-3.70)#8,180 |
| 49. | Vergennes | 7.5% | 8.9%(-1.40)#49 | 11.4%(-3.90)#8,357 |
| 50. | Harmonyville | 7.5% | 8.9%(-1.40)#50 | 11.4%(-3.90)#8,397 |
| 51. | Chittenden | 7.5% | 8.9%(-1.40)#51 | 11.4%(-3.90)#8,399 |
| 52. | Marshfield | 7.3% | 8.9%(-1.60)#52 | 11.4%(-4.10)#8,574 |
| 53. | Arlington | 7.0% | 8.9%(-1.90)#53 | 11.4%(-4.40)#8,812 |
| 54. | Pownal Center | 7.0% | 8.9%(-1.90)#54 | 11.4%(-4.40)#8,842 |
| 55. | Jacksonville | 7.0% | 8.9%(-1.90)#55 | 11.4%(-4.40)#8,855 |
| 56. | South Barre | 6.8% | 8.9%(-2.10)#56 | 11.4%(-4.60)#9,050 |
| 57. | Brattleboro | 6.6% | 8.9%(-2.30)#57 | 11.4%(-4.80)#9,238 |
| 58. | East Poultney | 6.6% | 8.9%(-2.30)#58 | 11.4%(-4.80)#9,307 |
| 59. | Jericho | 6.4% | 8.9%(-2.50)#59 | 11.4%(-5.00)#9,494 |
| 60. | North Bennington | 6.3% | 8.9%(-2.60)#60 | 11.4%(-5.10)#9,593 |
| 61. | Manchester | 6.2% | 8.9%(-2.70)#61 | 11.4%(-5.20)#9,748 |
| 62. | Chelsea | 6.1% | 8.9%(-2.80)#62 | 11.4%(-5.30)#9,882 |
| 63. | Waitsfield | 6.0% | 8.9%(-2.90)#63 | 11.4%(-5.40)#10,025 |
| 64. | Waterbury | 5.9% | 8.9%(-3.00)#64 | 11.4%(-5.50)#10,101 |
| 65. | Pawlet | 5.9% | 8.9%(-3.00)#65 | 11.4%(-5.50)#10,146 |
| 66. | Hanksville | 5.6% | 8.9%(-3.30)#66 | 11.4%(-5.80)#10,599 |
| 67. | Graniteville | 5.4% | 8.9%(-3.50)#67 | 11.4%(-6.00)#10,850 |
| 68. | Newbury | 5.4% | 8.9%(-3.50)#68 | 11.4%(-6.00)#10,854 |
| 69. | Wilder | 5.3% | 8.9%(-3.60)#69 | 11.4%(-6.10)#10,932 |
| 70. | West Rutland | 4.9% | 8.9%(-4.00)#70 | 11.4%(-6.50)#11,564 |
| 71. | Dorset | 4.7% | 8.9%(-4.20)#71 | 11.4%(-6.70)#11,953 |
| 72. | St Johnsbury | 4.6% | 8.9%(-4.30)#72 | 11.4%(-6.80)#12,035 |
| 73. | West Pawlet | 4.6% | 8.9%(-4.30)#73 | 11.4%(-6.80)#12,123 |
| 74. | Northfield | 4.5% | 8.9%(-4.40)#74 | 11.4%(-6.90)#12,194 |
| 75. | Bristol | 4.5% | 8.9%(-4.40)#75 | 11.4%(-6.90)#12,235 |
| 76. | Ludlow | 4.5% | 8.9%(-4.40)#76 | 11.4%(-6.90)#12,272 |
| 77. | East Burke | 4.3% | 8.9%(-4.60)#77 | 11.4%(-7.10)#12,706 |
| 78. | Barre | 4.1% | 8.9%(-4.80)#78 | 11.4%(-7.30)#12,914 |
| 79. | Morrisville | 4.0% | 8.9%(-4.90)#79 | 11.4%(-7.40)#13,151 |
| 80. | St. George | 4.0% | 8.9%(-4.90)#80 | 11.4%(-7.40)#13,228 |
| 81. | Manchester Center | 3.9% | 8.9%(-5.00)#81 | 11.4%(-7.50)#13,361 |
| 82. | South Lincoln | 3.9% | 8.9%(-5.00)#82 | 11.4%(-7.50)#13,442 |
| 83. | Derby Center | 3.8% | 8.9%(-5.10)#83 | 11.4%(-7.60)#13,592 |
| 84. | Readsboro | 3.7% | 8.9%(-5.20)#84 | 11.4%(-7.70)#13,856 |
| 85. | Saxtons River | 3.6% | 8.9%(-5.30)#85 | 11.4%(-7.80)#14,018 |
| 86. | Windsor | 3.5% | 8.9%(-5.40)#86 | 11.4%(-7.90)#14,165 |
| 87. | Bethel | 3.4% | 8.9%(-5.50)#87 | 11.4%(-8.00)#14,422 |
| 88. | Richmond | 3.3% | 8.9%(-5.60)#88 | 11.4%(-8.10)#14,657 |
| 89. | Fairfax | 3.2% | 8.9%(-5.70)#89 | 11.4%(-8.20)#14,887 |
| 90. | Rutland | 3.1% | 8.9%(-5.80)#90 | 11.4%(-8.30)#14,990 |
| 91. | Newport | 3.1% | 8.9%(-5.80)#91 | 11.4%(-8.30)#15,035 |
| 92. | Bennington | 3.0% | 8.9%(-5.90)#92 | 11.4%(-8.40)#15,273 |
| 93. | Lincoln | 3.0% | 8.9%(-5.90)#93 | 11.4%(-8.40)#15,453 |
| 94. | Island Pond | 2.9% | 8.9%(-6.00)#94 | 11.4%(-8.50)#15,675 |
| 95. | Plainfield | 2.8% | 8.9%(-6.10)#95 | 11.4%(-8.60)#15,953 |
| 96. | Proctor | 2.7% | 8.9%(-6.20)#96 | 11.4%(-8.70)#16,115 |
| 97. | Fair Haven | 2.6% | 8.9%(-6.30)#97 | 11.4%(-8.80)#16,353 |
| 98. | Johnson | 2.6% | 8.9%(-6.30)#98 | 11.4%(-8.80)#16,402 |
| 99. | Castleton Four Corners | 2.6% | 8.9%(-6.30)#99 | 11.4%(-8.80)#16,449 |
| 100. | Randolph | 2.5% | 8.9%(-6.40)#100 | 11.4%(-8.90)#16,627 |
1
2Common Questions
What are the Top 10 Cities with the Highest Percentage of Households with Income Above $200,000 in Vermont?
Top 10 Cities with the Highest Percentage of Households with Income Above $200,000 in Vermont are:
#1
36.1%
#2
34.6%
#3
25.5%
#4
24.0%
#5
23.1%
#6
20.1%
#7
19.6%
#8
19.2%
#9
16.9%
#10
15.8%
What city has the Highest Percentage of Households with Income Above $200,000 in Vermont?
Old Bennington has the Highest Percentage of Households with Income Above $200,000 in Vermont with 36.1%.
What is the Percentage of Households with Income Above $200,000 in the State of Vermont?
Percentage of Households with Income Above $200,000 in Vermont is 8.9%.
What is the Percentage of Households with Income Above $200,000 in the United States?
Percentage of Households with Income Above $200,000 in the United States is 11.4%.