Cities with the Most Immigrants from Dominican Republic in Michigan
RELATED REPORTS & OPTIONS
Dominican Republic
Michigan
Compare Cities
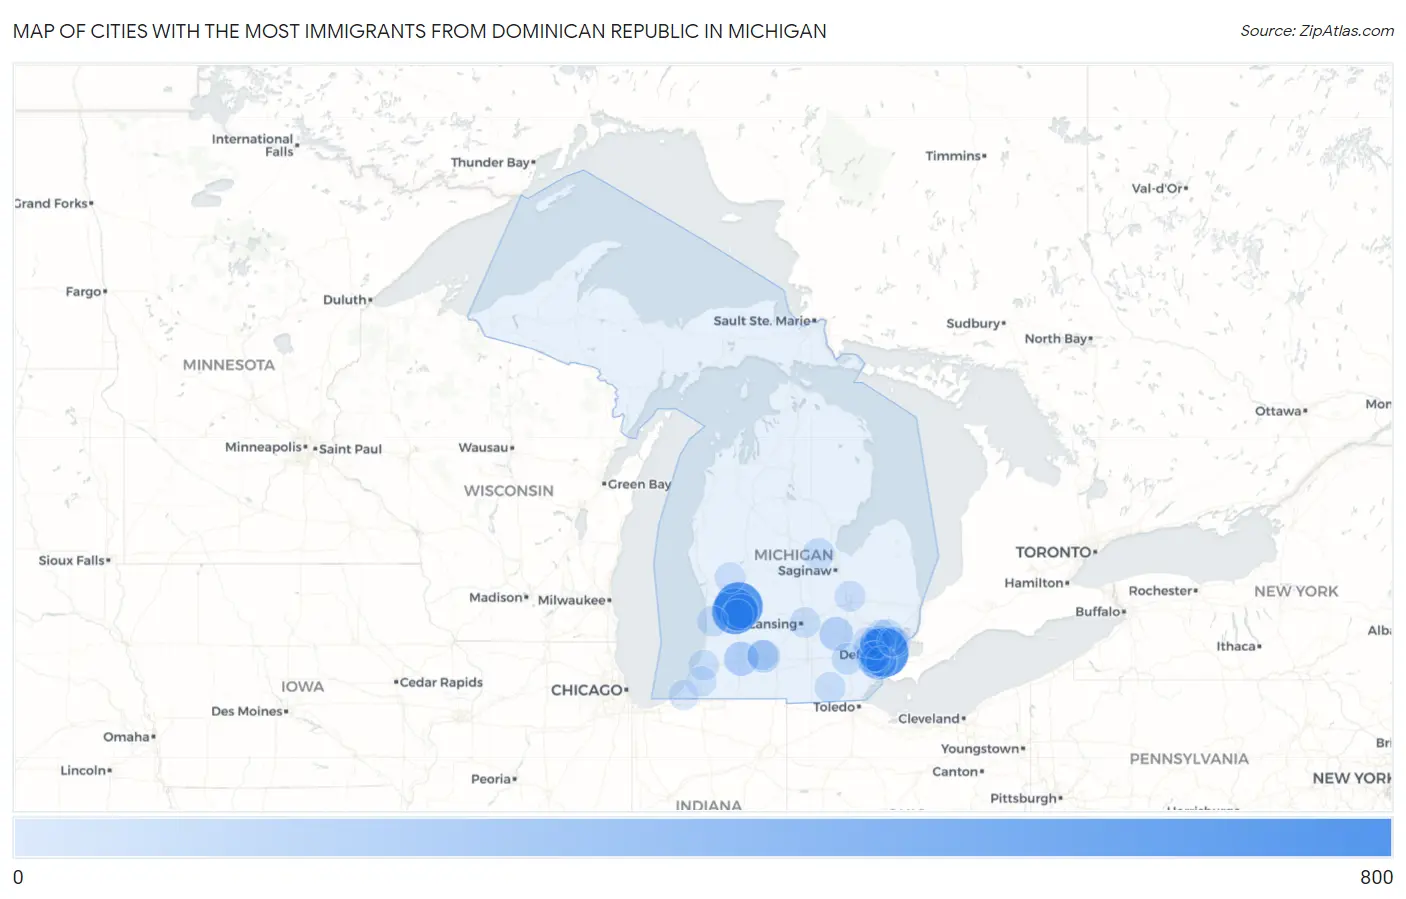
Map of Cities with the Most Immigrants from Dominican Republic in Michigan
0
800
Cities with the Most Immigrants from Dominican Republic in Michigan
| City | Dominican Republic | vs State | vs National | |
| 1. | Detroit | 669 | 3,489(19.17%)#1 | 1,223,316(0.05%)#162 |
| 2. | Grand Rapids | 611 | 3,489(17.51%)#2 | 1,223,316(0.05%)#175 |
| 3. | Wyoming | 538 | 3,489(15.42%)#3 | 1,223,316(0.04%)#204 |
| 4. | Lincoln Park | 225 | 3,489(6.45%)#4 | 1,223,316(0.02%)#411 |
| 5. | Kentwood | 136 | 3,489(3.90%)#5 | 1,223,316(0.01%)#605 |
| 6. | Kalamazoo | 133 | 3,489(3.81%)#6 | 1,223,316(0.01%)#619 |
| 7. | Howell | 117 | 3,489(3.35%)#7 | 1,223,316(0.01%)#675 |
| 8. | Battle Creek | 86 | 3,489(2.46%)#8 | 1,223,316(0.01%)#824 |
| 9. | Lathrup Village | 79 | 3,489(2.26%)#9 | 1,223,316(0.01%)#876 |
| 10. | Dearborn | 50 | 3,489(1.43%)#10 | 1,223,316(0.00%)#1,147 |
| 11. | Ann Arbor | 47 | 3,489(1.35%)#11 | 1,223,316(0.00%)#1,182 |
| 12. | Sterling Heights | 40 | 3,489(1.15%)#12 | 1,223,316(0.00%)#1,281 |
| 13. | Cutlerville | 40 | 3,489(1.15%)#13 | 1,223,316(0.00%)#1,285 |
| 14. | Midland | 38 | 3,489(1.09%)#14 | 1,223,316(0.00%)#1,319 |
| 15. | Royal Oak | 27 | 3,489(0.77%)#15 | 1,223,316(0.00%)#1,565 |
| 16. | Livonia | 26 | 3,489(0.75%)#16 | 1,223,316(0.00%)#1,594 |
| 17. | Oak Park | 23 | 3,489(0.66%)#17 | 1,223,316(0.00%)#1,683 |
| 18. | Inkster | 22 | 3,489(0.63%)#18 | 1,223,316(0.00%)#1,707 |
| 19. | Troy | 21 | 3,489(0.60%)#19 | 1,223,316(0.00%)#1,744 |
| 20. | Adrian | 19 | 3,489(0.54%)#20 | 1,223,316(0.00%)#1,822 |
| 21. | Holland | 18 | 3,489(0.52%)#21 | 1,223,316(0.00%)#1,855 |
| 22. | East Lansing | 17 | 3,489(0.49%)#22 | 1,223,316(0.00%)#1,888 |
| 23. | Taylor | 15 | 3,489(0.43%)#23 | 1,223,316(0.00%)#1,983 |
| 24. | Beecher | 15 | 3,489(0.43%)#24 | 1,223,316(0.00%)#1,998 |
| 25. | Farmington Hills | 12 | 3,489(0.34%)#25 | 1,223,316(0.00%)#2,109 |
| 26. | Grant | 12 | 3,489(0.34%)#26 | 1,223,316(0.00%)#2,152 |
| 27. | Southfield | 9 | 3,489(0.26%)#27 | 1,223,316(0.00%)#2,260 |
| 28. | St Clair Shores | 9 | 3,489(0.26%)#28 | 1,223,316(0.00%)#2,263 |
| 29. | Springfield | 7 | 3,489(0.20%)#29 | 1,223,316(0.00%)#2,410 |
| 30. | Watervliet | 7 | 3,489(0.20%)#30 | 1,223,316(0.00%)#2,428 |
| 31. | Ecorse | 5 | 3,489(0.14%)#31 | 1,223,316(0.00%)#2,521 |
| 32. | Eau Claire | 5 | 3,489(0.14%)#32 | 1,223,316(0.00%)#2,554 |
| 33. | Dearborn Heights | 4 | 3,489(0.11%)#33 | 1,223,316(0.00%)#2,564 |
| 34. | Roseville | 3 | 3,489(0.09%)#34 | 1,223,316(0.00%)#2,615 |
| 35. | Three Oaks | 3 | 3,489(0.09%)#35 | 1,223,316(0.00%)#2,643 |
Common Questions
What are the Top 10 Cities with the Most Immigrants from Dominican Republic in Michigan?
Top 10 Cities with the Most Immigrants from Dominican Republic in Michigan are:
#1
669
#2
611
#3
538
#4
225
#5
136
#6
133
#7
117
#8
86
#9
79
#10
50
What city has the Most Immigrants from Dominican Republic in Michigan?
Detroit has the Most Immigrants from Dominican Republic in Michigan with 669.
What is the Total Immigrants from Dominican Republic in the State of Michigan?
Total Immigrants from Dominican Republic in Michigan is 3,489.
What is the Total Immigrants from Dominican Republic in the United States?
Total Immigrants from Dominican Republic in the United States is 1,223,316.