Zip Codes with the Highest Percentage of Households with Income Above $200,000 in Detroit, MI
RELATED REPORTS & OPTIONS
Household Income | $200k+
Detroit
Compare Zip Codes
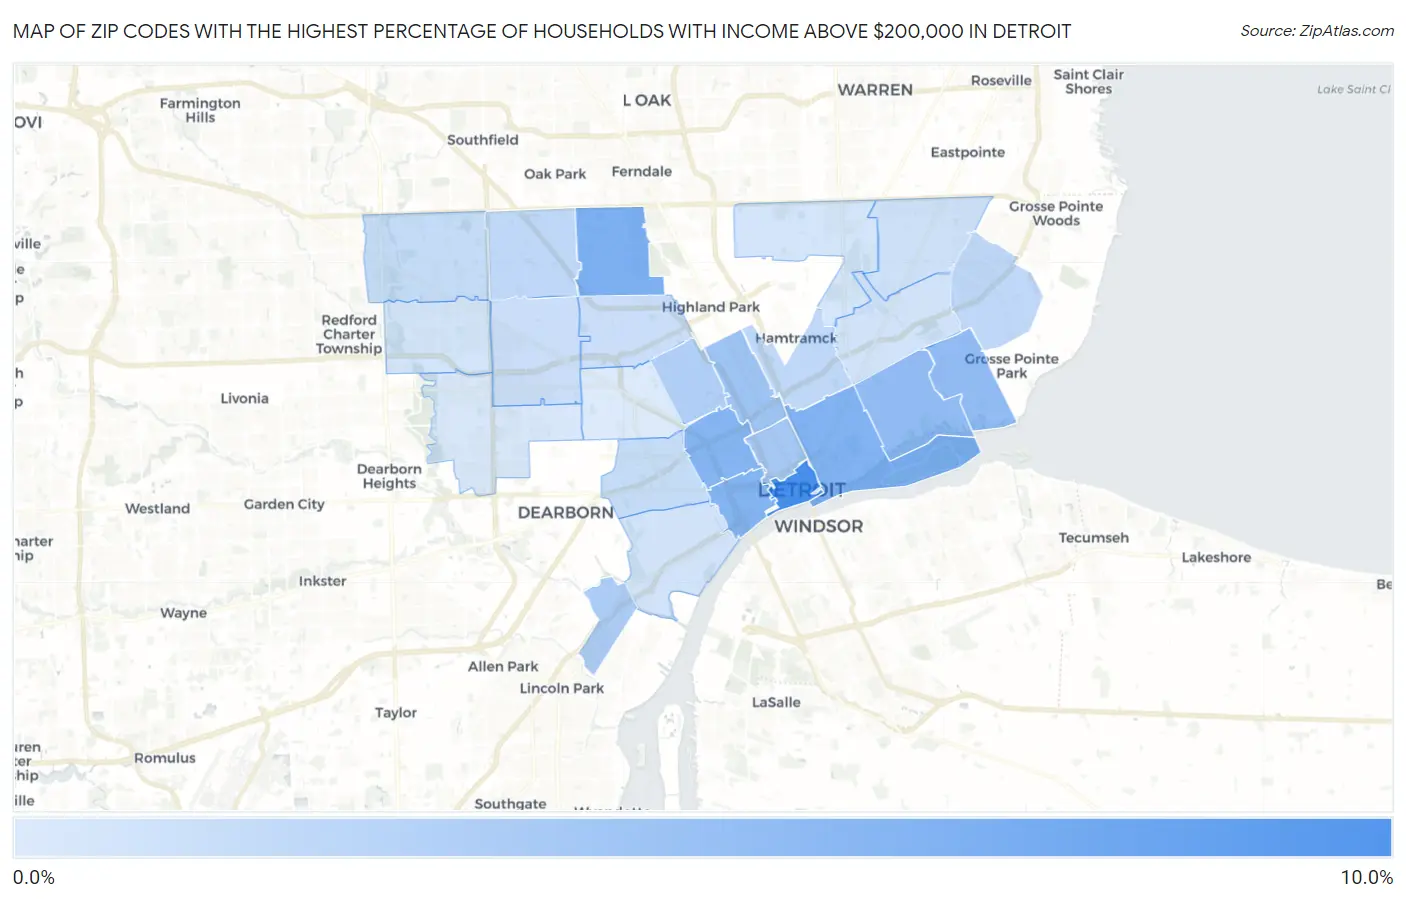
Map of Zip Codes with the Highest Percentage of Households with Income Above $200,000 in Detroit
0.60%
8.2%
Zip Codes with the Highest Percentage of Households with Income Above $200,000 in Detroit, MI
| Zip Code | Households with Income > $200k | vs State | vs National | |
| 1. | 48226 | 8.2% | 8.2%(=0.000)#230 | 11.4%(-3.20)#10,133 |
| 2. | 48221 | 5.5% | 8.2%(-2.70)#353 | 11.4%(-5.90)#14,477 |
| 3. | 48207 | 5.2% | 8.2%(-3.00)#381 | 11.4%(-6.20)#15,117 |
| 4. | 48216 | 5.1% | 8.2%(-3.10)#392 | 11.4%(-6.30)#15,394 |
| 5. | 48208 | 5.0% | 8.2%(-3.20)#399 | 11.4%(-6.40)#15,648 |
| 6. | 48214 | 4.4% | 8.2%(-3.80)#456 | 11.4%(-7.00)#17,044 |
| 7. | 48215 | 4.4% | 8.2%(-3.80)#458 | 11.4%(-7.00)#17,074 |
| 8. | 48202 | 3.7% | 8.2%(-4.50)#527 | 11.4%(-7.70)#18,910 |
| 9. | 48201 | 3.3% | 8.2%(-4.90)#572 | 11.4%(-8.10)#20,049 |
| 10. | 48217 | 3.0% | 8.2%(-5.20)#608 | 11.4%(-8.40)#20,956 |
| 11. | 48206 | 2.8% | 8.2%(-5.40)#635 | 11.4%(-8.60)#21,463 |
| 12. | 48235 | 2.1% | 8.2%(-6.10)#731 | 11.4%(-9.30)#23,445 |
| 13. | 48224 | 2.1% | 8.2%(-6.10)#732 | 11.4%(-9.30)#23,450 |
| 14. | 48211 | 2.1% | 8.2%(-6.10)#739 | 11.4%(-9.30)#23,529 |
| 15. | 48219 | 1.7% | 8.2%(-6.50)#797 | 11.4%(-9.70)#24,540 |
| 16. | 48210 | 1.7% | 8.2%(-6.50)#800 | 11.4%(-9.70)#24,553 |
| 17. | 48227 | 1.5% | 8.2%(-6.70)#820 | 11.4%(-9.90)#25,046 |
| 18. | 48238 | 1.5% | 8.2%(-6.70)#821 | 11.4%(-9.90)#25,056 |
| 19. | 48205 | 1.3% | 8.2%(-6.90)#850 | 11.4%(-10.1)#25,522 |
| 20. | 48209 | 1.2% | 8.2%(-7.00)#859 | 11.4%(-10.2)#25,746 |
| 21. | 48213 | 1.2% | 8.2%(-7.00)#860 | 11.4%(-10.2)#25,754 |
| 22. | 48234 | 1.0% | 8.2%(-7.20)#873 | 11.4%(-10.4)#26,172 |
| 23. | 48223 | 1.0% | 8.2%(-7.20)#875 | 11.4%(-10.4)#26,177 |
| 24. | 48228 | 0.80% | 8.2%(-7.40)#890 | 11.4%(-10.6)#26,536 |
| 25. | 48204 | 0.60% | 8.2%(-7.60)#897 | 11.4%(-10.8)#26,930 |
1
Common Questions
What are the Top 10 Zip Codes with the Highest Percentage of Households with Income Above $200,000 in Detroit, MI?
Top 10 Zip Codes with the Highest Percentage of Households with Income Above $200,000 in Detroit, MI are:
What zip code has the Highest Percentage of Households with Income Above $200,000 in Detroit, MI?
48226 has the Highest Percentage of Households with Income Above $200,000 in Detroit, MI with 8.2%.
What is the Percentage of Households with Income Above $200,000 in Detroit, MI?
Percentage of Households with Income Above $200,000 in Detroit is 2.4%.
What is the Percentage of Households with Income Above $200,000 in Michigan?
Percentage of Households with Income Above $200,000 in Michigan is 8.2%.
What is the Percentage of Households with Income Above $200,000 in the United States?
Percentage of Households with Income Above $200,000 in the United States is 11.4%.