Cities with the Highest Percentage of Households with Income Above $200,000 in Kentucky
RELATED REPORTS & OPTIONS
Household Income | $200k+
Kentucky
Compare Cities
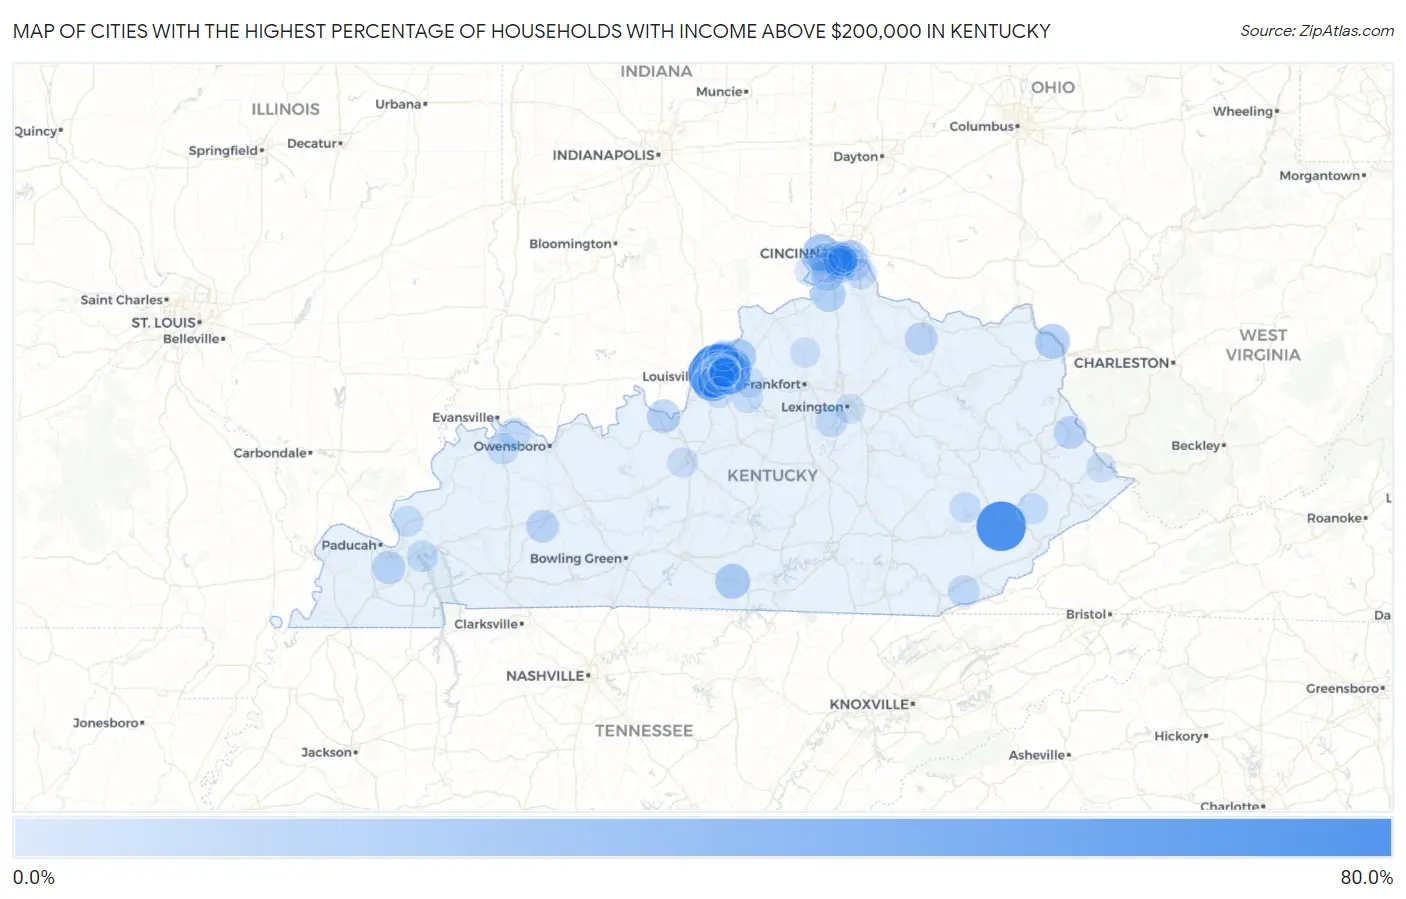
Map of Cities with the Highest Percentage of Households with Income Above $200,000 in Kentucky
0.0%
80.0%
Cities with the Highest Percentage of Households with Income Above $200,000 in Kentucky
| City | Households with Income > $200k | vs State | vs National | |
| 1. | Jeff | 74.7% | 6.0%(+68.7)#1 | 11.4%(+63.3)#51 |
| 2. | Mockingbird Valley | 71.6% | 6.0%(+65.6)#2 | 11.4%(+60.2)#64 |
| 3. | Glenview | 71.5% | 6.0%(+65.5)#3 | 11.4%(+60.1)#65 |
| 4. | Riverwood | 59.4% | 6.0%(+53.4)#4 | 11.4%(+48.0)#205 |
| 5. | Rolling Fields | 57.8% | 6.0%(+51.8)#5 | 11.4%(+46.4)#232 |
| 6. | Maryhill Estates | 55.1% | 6.0%(+49.1)#6 | 11.4%(+43.7)#291 |
| 7. | Anchorage | 50.4% | 6.0%(+44.4)#7 | 11.4%(+39.0)#433 |
| 8. | Glenview Manor | 46.9% | 6.0%(+40.9)#8 | 11.4%(+35.5)#540 |
| 9. | Indian Hills | 46.5% | 6.0%(+40.5)#9 | 11.4%(+35.1)#563 |
| 10. | Manor Creek | 42.9% | 6.0%(+36.9)#10 | 11.4%(+31.5)#700 |
| 11. | Strathmoor Manor | 42.1% | 6.0%(+36.1)#11 | 11.4%(+30.7)#734 |
| 12. | Prospect | 39.6% | 6.0%(+33.6)#12 | 11.4%(+28.2)#860 |
| 13. | Ten Broeck | 39.4% | 6.0%(+33.4)#13 | 11.4%(+28.0)#878 |
| 14. | Norbourne Estates | 38.9% | 6.0%(+32.9)#14 | 11.4%(+27.5)#906 |
| 15. | Glenview Hills | 37.1% | 6.0%(+31.1)#15 | 11.4%(+25.7)#1,014 |
| 16. | Bellewood | 35.4% | 6.0%(+29.4)#16 | 11.4%(+24.0)#1,142 |
| 17. | Francisville | 30.8% | 6.0%(+24.8)#17 | 11.4%(+19.4)#1,531 |
| 18. | Seneca Gardens | 30.7% | 6.0%(+24.7)#18 | 11.4%(+19.3)#1,551 |
| 19. | Druid Hills | 28.7% | 6.0%(+22.7)#19 | 11.4%(+17.3)#1,753 |
| 20. | Lakeside Park | 27.0% | 6.0%(+21.0)#20 | 11.4%(+15.6)#1,938 |
| 21. | River Bluff | 26.9% | 6.0%(+20.9)#21 | 11.4%(+15.5)#1,951 |
| 22. | Green Spring | 26.0% | 6.0%(+20.0)#22 | 11.4%(+14.6)#2,061 |
| 23. | Old Brownsboro Place | 25.9% | 6.0%(+19.9)#23 | 11.4%(+14.5)#2,070 |
| 24. | Thornhill | 25.8% | 6.0%(+19.8)#24 | 11.4%(+14.4)#2,088 |
| 25. | Villa Hills | 25.0% | 6.0%(+19.0)#25 | 11.4%(+13.6)#2,161 |
| 26. | Marrowbone | 25.0% | 6.0%(+19.0)#26 | 11.4%(+13.6)#2,170 |
| 27. | Bellefonte | 24.7% | 6.0%(+18.7)#27 | 11.4%(+13.3)#2,206 |
| 28. | Buckner | 24.3% | 6.0%(+18.3)#28 | 11.4%(+12.9)#2,260 |
| 29. | Spring Valley | 24.3% | 6.0%(+18.3)#29 | 11.4%(+12.9)#2,272 |
| 30. | Pewee Valley | 23.4% | 6.0%(+17.4)#30 | 11.4%(+12.0)#2,416 |
| 31. | Beechwood Village | 23.3% | 6.0%(+17.3)#31 | 11.4%(+11.9)#2,430 |
| 32. | Brownsboro Farm | 22.7% | 6.0%(+16.7)#32 | 11.4%(+11.3)#2,534 |
| 33. | Strathmoor Village | 21.8% | 6.0%(+15.8)#33 | 11.4%(+10.4)#2,702 |
| 34. | Verona | 20.9% | 6.0%(+14.9)#34 | 11.4%(+9.50)#2,875 |
| 35. | Doe Valley | 20.7% | 6.0%(+14.7)#35 | 11.4%(+9.30)#2,905 |
| 36. | Norwood | 20.7% | 6.0%(+14.7)#36 | 11.4%(+9.30)#2,909 |
| 37. | Windy Hills | 20.6% | 6.0%(+14.6)#37 | 11.4%(+9.20)#2,922 |
| 38. | Edgewood | 20.5% | 6.0%(+14.5)#38 | 11.4%(+9.10)#2,934 |
| 39. | Hurstbourne | 20.3% | 6.0%(+14.3)#39 | 11.4%(+8.90)#2,980 |
| 40. | Crestwood | 20.0% | 6.0%(+14.0)#40 | 11.4%(+8.60)#3,038 |
| 41. | Brownsboro Village | 19.8% | 6.0%(+13.8)#41 | 11.4%(+8.40)#3,111 |
| 42. | Rolling Hills | 19.5% | 6.0%(+13.5)#42 | 11.4%(+8.10)#3,165 |
| 43. | Symsonia | 19.3% | 6.0%(+13.3)#43 | 11.4%(+7.90)#3,202 |
| 44. | Hills And Dales | 18.6% | 6.0%(+12.6)#44 | 11.4%(+7.20)#3,380 |
| 45. | Fort Mitchell | 18.5% | 6.0%(+12.5)#45 | 11.4%(+7.10)#3,389 |
| 46. | Mays Lick | 18.2% | 6.0%(+12.2)#46 | 11.4%(+6.80)#3,465 |
| 47. | Inez | 17.9% | 6.0%(+11.9)#47 | 11.4%(+6.50)#3,531 |
| 48. | Langdon Place | 17.8% | 6.0%(+11.8)#48 | 11.4%(+6.40)#3,561 |
| 49. | Greenville | 17.7% | 6.0%(+11.7)#49 | 11.4%(+6.30)#3,573 |
| 50. | Richlawn | 16.7% | 6.0%(+10.7)#50 | 11.4%(+5.30)#3,795 |
| 51. | Union | 16.4% | 6.0%(+10.4)#51 | 11.4%(+5.00)#3,884 |
| 52. | Broeck Pointe | 16.0% | 6.0%(+10.00)#52 | 11.4%(+4.60)#3,986 |
| 53. | Kingsley | 15.9% | 6.0%(+9.90)#53 | 11.4%(+4.50)#4,016 |
| 54. | Bancroft | 15.6% | 6.0%(+9.60)#54 | 11.4%(+4.20)#4,110 |
| 55. | Crossgate | 15.4% | 6.0%(+9.40)#55 | 11.4%(+4.00)#4,173 |
| 56. | Goose Creek | 15.3% | 6.0%(+9.30)#56 | 11.4%(+3.90)#4,222 |
| 57. | Pathfork | 15.1% | 6.0%(+9.10)#57 | 11.4%(+3.70)#4,280 |
| 58. | Northfield | 14.7% | 6.0%(+8.70)#58 | 11.4%(+3.30)#4,398 |
| 59. | Keene | 14.6% | 6.0%(+8.60)#59 | 11.4%(+3.20)#4,446 |
| 60. | Audubon Park | 14.5% | 6.0%(+8.50)#60 | 11.4%(+3.10)#4,464 |
| 61. | Hickory Hill | 14.3% | 6.0%(+8.30)#61 | 11.4%(+2.90)#4,563 |
| 62. | Grand Rivers | 14.1% | 6.0%(+8.10)#62 | 11.4%(+2.70)#4,622 |
| 63. | Spottsville | 14.1% | 6.0%(+8.10)#63 | 11.4%(+2.70)#4,632 |
| 64. | Anthoston | 13.8% | 6.0%(+7.80)#64 | 11.4%(+2.40)#4,754 |
| 65. | Cold Spring | 13.7% | 6.0%(+7.70)#65 | 11.4%(+2.30)#4,775 |
| 66. | Fort Thomas | 13.4% | 6.0%(+7.40)#66 | 11.4%(+2.00)#4,894 |
| 67. | Barbourmeade | 13.4% | 6.0%(+7.40)#67 | 11.4%(+2.00)#4,912 |
| 68. | Middletown | 13.3% | 6.0%(+7.30)#68 | 11.4%(+1.90)#4,929 |
| 69. | Crestview Hills | 13.3% | 6.0%(+7.30)#69 | 11.4%(+1.90)#4,939 |
| 70. | Bellemeade | 13.3% | 6.0%(+7.30)#70 | 11.4%(+1.90)#4,946 |
| 71. | Pippa Passes | 13.0% | 6.0%(+7.00)#71 | 11.4%(+1.60)#5,083 |
| 72. | Hebron | 12.9% | 6.0%(+6.90)#72 | 11.4%(+1.50)#5,103 |
| 73. | St Matthews | 12.7% | 6.0%(+6.70)#73 | 11.4%(+1.30)#5,190 |
| 74. | Crescent Springs | 12.7% | 6.0%(+6.70)#74 | 11.4%(+1.30)#5,201 |
| 75. | Wellington | 12.7% | 6.0%(+6.70)#75 | 11.4%(+1.30)#5,213 |
| 76. | Burna | 12.5% | 6.0%(+6.50)#76 | 11.4%(+1.10)#5,308 |
| 77. | Buckhorn | 12.5% | 6.0%(+6.50)#77 | 11.4%(+1.10)#5,311 |
| 78. | Elk Creek | 12.4% | 6.0%(+6.40)#78 | 11.4%(+1.000)#5,347 |
| 79. | Murray Hill | 12.4% | 6.0%(+6.40)#79 | 11.4%(+1.000)#5,361 |
| 80. | Alexandria | 12.3% | 6.0%(+6.30)#80 | 11.4%(+0.900)#5,379 |
| 81. | Creekside | 12.2% | 6.0%(+6.20)#81 | 11.4%(+0.800)#5,452 |
| 82. | Oakbrook | 12.0% | 6.0%(+6.00)#82 | 11.4%(+0.600)#5,523 |
| 83. | Philpot | 12.0% | 6.0%(+6.00)#83 | 11.4%(+0.600)#5,539 |
| 84. | Westwood | 11.9% | 6.0%(+5.90)#84 | 11.4%(+0.500)#5,591 |
| 85. | Douglass Hills | 11.6% | 6.0%(+5.60)#85 | 11.4%(+0.200)#5,714 |
| 86. | Orchard Grass Hills | 11.5% | 6.0%(+5.50)#86 | 11.4%(+0.100)#5,764 |
| 87. | Belleview | 11.4% | 6.0%(+5.40)#87 | 11.4%(=0.000)#5,821 |
| 88. | St Regis Park | 11.2% | 6.0%(+5.20)#88 | 11.4%(-0.200)#5,885 |
| 89. | Newport | 11.0% | 6.0%(+5.00)#89 | 11.4%(-0.400)#5,958 |
| 90. | Moorland | 11.0% | 6.0%(+5.00)#90 | 11.4%(-0.400)#5,995 |
| 91. | Spring Mill | 11.0% | 6.0%(+5.00)#91 | 11.4%(-0.400)#5,998 |
| 92. | Fort Wright | 10.9% | 6.0%(+4.90)#92 | 11.4%(-0.500)#6,023 |
| 93. | Cecilia | 10.8% | 6.0%(+4.80)#93 | 11.4%(-0.600)#6,100 |
| 94. | Park Hills | 10.6% | 6.0%(+4.60)#94 | 11.4%(-0.800)#6,188 |
| 95. | Goshen | 10.6% | 6.0%(+4.60)#95 | 11.4%(-0.800)#6,198 |
| 96. | Simpsonville | 9.6% | 6.0%(+3.60)#96 | 11.4%(-1.80)#6,773 |
| 97. | Belfry | 9.6% | 6.0%(+3.60)#97 | 11.4%(-1.80)#6,814 |
| 98. | Monterey | 9.6% | 6.0%(+3.60)#98 | 11.4%(-1.80)#6,817 |
| 99. | Meadowbrook Farm | 9.5% | 6.0%(+3.50)#99 | 11.4%(-1.90)#6,885 |
| 100. | Lexington | 9.4% | 6.0%(+3.40)#100 | 11.4%(-2.00)#6,886 |
Common Questions
What are the Top 10 Cities with the Highest Percentage of Households with Income Above $200,000 in Kentucky?
Top 10 Cities with the Highest Percentage of Households with Income Above $200,000 in Kentucky are:
#1
74.7%
#2
71.6%
#3
71.5%
#4
59.4%
#5
57.8%
#6
55.1%
#7
50.4%
#8
46.9%
#9
46.5%
#10
42.9%
What city has the Highest Percentage of Households with Income Above $200,000 in Kentucky?
Jeff has the Highest Percentage of Households with Income Above $200,000 in Kentucky with 74.7%.
What is the Percentage of Households with Income Above $200,000 in the State of Kentucky?
Percentage of Households with Income Above $200,000 in Kentucky is 6.0%.
What is the Percentage of Households with Income Above $200,000 in the United States?
Percentage of Households with Income Above $200,000 in the United States is 11.4%.