Spring Lake, MI Map & Demographics
Spring Lake Map
Spring Lake Overview
$54,562
PER CAPITA INCOME
$97,625
AVG FAMILY INCOME
$71,813
AVG HOUSEHOLD INCOME
8.0%
WAGE / INCOME GAP [ % ]
92.0¢/ $1
WAGE / INCOME GAP [ $ ]
0.51
INEQUALITY / GINI INDEX
2,530
TOTAL POPULATION
1,147
MALE POPULATION
1,383
FEMALE POPULATION
82.94
MALES / 100 FEMALES
120.58
FEMALES / 100 MALES
54.7
MEDIAN AGE
2.6
AVG FAMILY SIZE
2.0
AVG HOUSEHOLD SIZE
1,406
LABOR FORCE [ PEOPLE ]
64.8%
PERCENT IN LABOR FORCE
4.4%
UNEMPLOYMENT RATE
Spring Lake Zip Codes
Spring Lake Area Codes
Income in Spring Lake
Income Overview in Spring Lake
Per Capita Income in Spring Lake is $54,562, while median incomes of families and households are $97,625 and $71,813 respectively.
| Characteristic | Number | Measure |
| Per Capita Income | 2,530 | $54,562 |
| Median Family Income | 764 | $97,625 |
| Mean Family Income | 764 | $146,512 |
| Median Household Income | 1,271 | $71,813 |
| Mean Household Income | 1,271 | $110,805 |
| Income Deficit | 764 | $0 |
| Wage / Income Gap (%) | 2,530 | 7.99% |
| Wage / Income Gap ($) | 2,530 | 92.01¢ per $1 |
| Gini / Inequality Index | 2,530 | 0.51 |
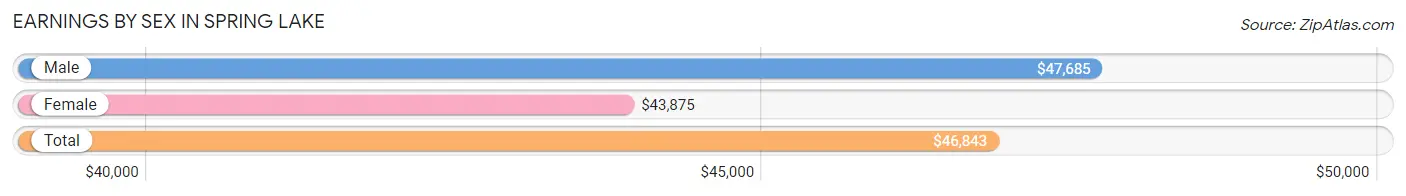
Earnings by Sex in Spring Lake
Average Earnings in Spring Lake are $46,843, $47,685 for men and $43,875 for women, a difference of 8.0%.
| Sex | Number | Average Earnings |
| Male | 776 (53.7%) | $47,685 |
| Female | 669 (46.3%) | $43,875 |
| Total | 1,445 (100.0%) | $46,843 |
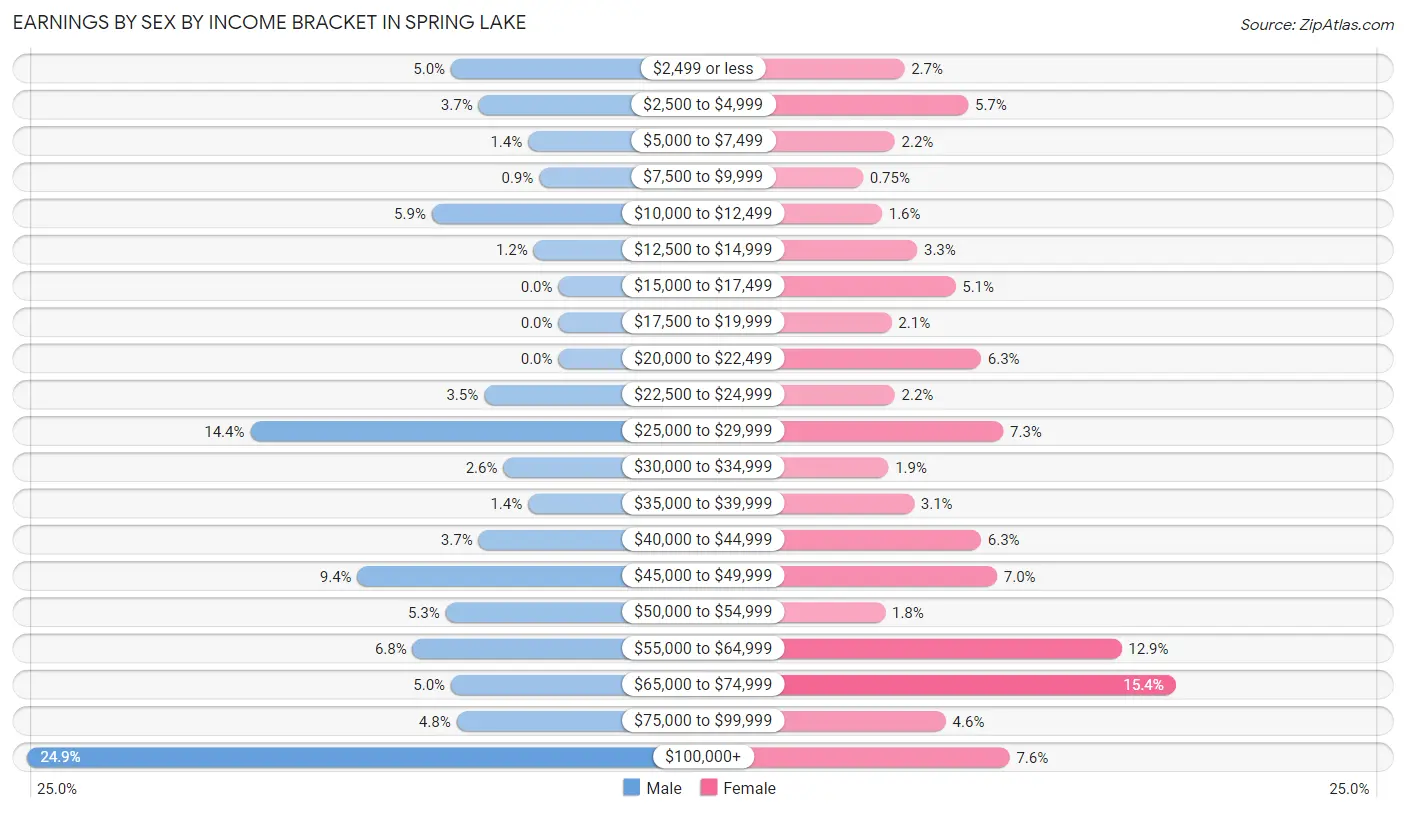
Earnings by Sex by Income Bracket in Spring Lake
The most common earnings brackets in Spring Lake are $100,000+ for men (193 | 24.9%) and $65,000 to $74,999 for women (103 | 15.4%).
| Income | Male | Female |
| $2,499 or less | 39 (5.0%) | 18 (2.7%) |
| $2,500 to $4,999 | 29 (3.7%) | 38 (5.7%) |
| $5,000 to $7,499 | 11 (1.4%) | 15 (2.2%) |
| $7,500 to $9,999 | 7 (0.9%) | 5 (0.7%) |
| $10,000 to $12,499 | 46 (5.9%) | 11 (1.6%) |
| $12,500 to $14,999 | 9 (1.2%) | 22 (3.3%) |
| $15,000 to $17,499 | 0 (0.0%) | 34 (5.1%) |
| $17,500 to $19,999 | 0 (0.0%) | 14 (2.1%) |
| $20,000 to $22,499 | 0 (0.0%) | 42 (6.3%) |
| $22,500 to $24,999 | 27 (3.5%) | 15 (2.2%) |
| $25,000 to $29,999 | 112 (14.4%) | 49 (7.3%) |
| $30,000 to $34,999 | 20 (2.6%) | 13 (1.9%) |
| $35,000 to $39,999 | 11 (1.4%) | 21 (3.1%) |
| $40,000 to $44,999 | 29 (3.7%) | 42 (6.3%) |
| $45,000 to $49,999 | 73 (9.4%) | 47 (7.0%) |
| $50,000 to $54,999 | 41 (5.3%) | 12 (1.8%) |
| $55,000 to $64,999 | 53 (6.8%) | 86 (12.9%) |
| $65,000 to $74,999 | 39 (5.0%) | 103 (15.4%) |
| $75,000 to $99,999 | 37 (4.8%) | 31 (4.6%) |
| $100,000+ | 193 (24.9%) | 51 (7.6%) |
| Total | 776 (100.0%) | 669 (100.0%) |
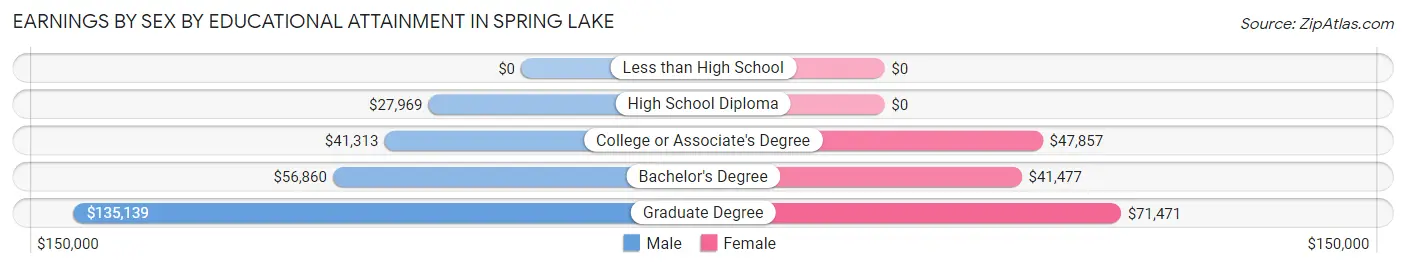
Earnings by Sex by Educational Attainment in Spring Lake
Average earnings in Spring Lake are $51,563 for men and $47,308 for women, a difference of 8.3%. Men with an educational attainment of graduate degree enjoy the highest average annual earnings of $135,139, while those with high school diploma education earn the least with $27,969. Women with an educational attainment of graduate degree earn the most with the average annual earnings of $71,471, while those with bachelor's degree education have the smallest earnings of $41,477.
| Educational Attainment | Male Income | Female Income |
| Less than High School | - | - |
| High School Diploma | $27,969 | $0 |
| College or Associate's Degree | $41,313 | $47,857 |
| Bachelor's Degree | $56,860 | $41,477 |
| Graduate Degree | $135,139 | $71,471 |
| Total | $51,563 | $47,308 |
Family Income in Spring Lake
Family Income Brackets in Spring Lake
According to the Spring Lake family income data, there are 192 families falling into the $100,000 to $149,999 income range, which is the most common income bracket and makes up 25.1% of all families. Conversely, the $10,000 to $14,999 income bracket is the least frequent group with only 4 families (0.5%) belonging to this category.
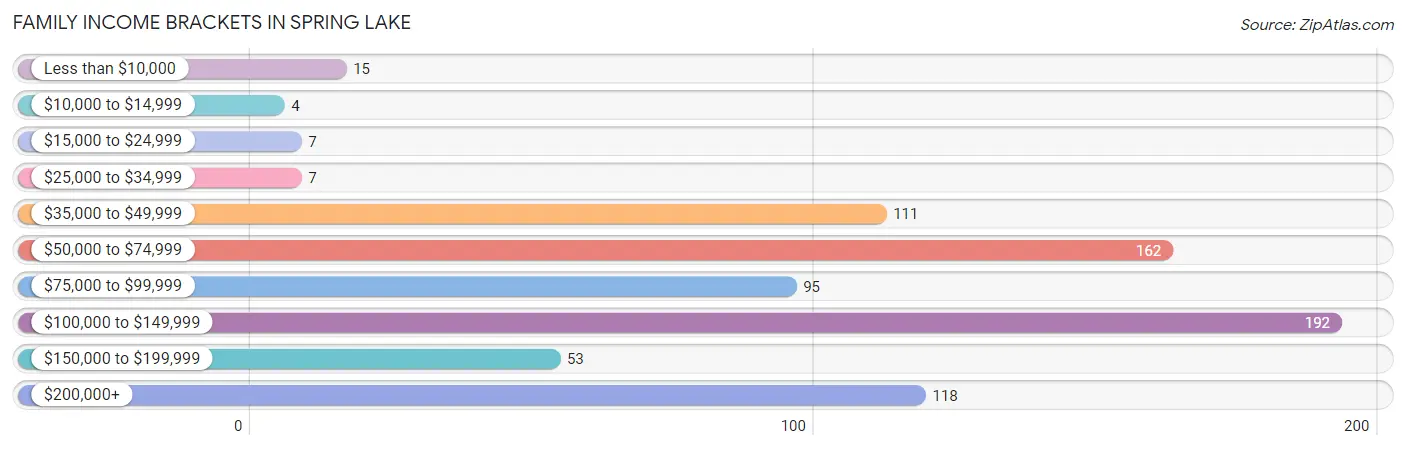
| Income Bracket | # Families | % Families |
| Less than $10,000 | 15 | 2.0% |
| $10,000 to $14,999 | 4 | 0.5% |
| $15,000 to $24,999 | 7 | 0.9% |
| $25,000 to $34,999 | 7 | 0.9% |
| $35,000 to $49,999 | 111 | 14.5% |
| $50,000 to $74,999 | 162 | 21.2% |
| $75,000 to $99,999 | 95 | 12.4% |
| $100,000 to $149,999 | 192 | 25.1% |
| $150,000 to $199,999 | 53 | 6.9% |
| $200,000+ | 118 | 15.4% |
Family Income by Famaliy Size in Spring Lake
4-person families (82 | 10.7%) account for the highest median family income in Spring Lake with $155,313 per family, while 2-person families (543 | 71.1%) have the highest median income of $47,375 per family member.
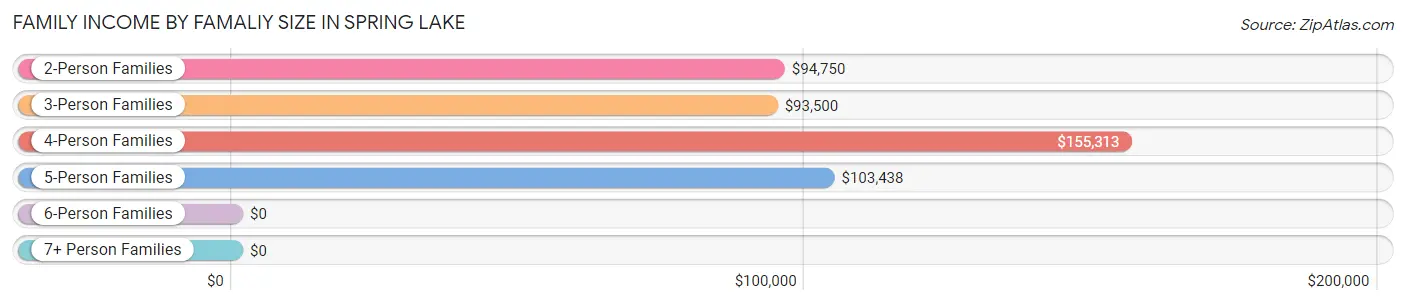
| Income Bracket | # Families | Median Income |
| 2-Person Families | 543 (71.1%) | $94,750 |
| 3-Person Families | 86 (11.3%) | $93,500 |
| 4-Person Families | 82 (10.7%) | $155,313 |
| 5-Person Families | 46 (6.0%) | $103,438 |
| 6-Person Families | 7 (0.9%) | $0 |
| 7+ Person Families | 0 (0.0%) | $0 |
| Total | 764 (100.0%) | $97,625 |
Family Income by Number of Earners in Spring Lake
The median family income in Spring Lake is $97,625, with families comprising 3+ earners (35) having the highest median family income of $116,023, while families with no earners (133) have the lowest median family income of $61,696, accounting for 4.6% and 17.4% of families, respectively.
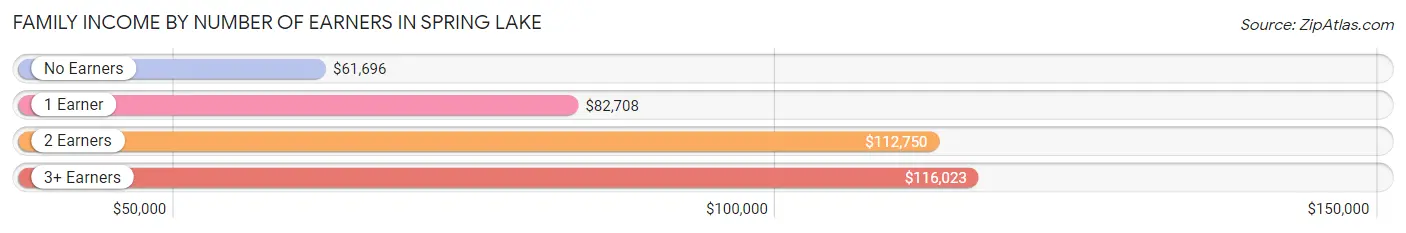
| Number of Earners | # Families | Median Income |
| No Earners | 133 (17.4%) | $61,696 |
| 1 Earner | 223 (29.2%) | $82,708 |
| 2 Earners | 373 (48.8%) | $112,750 |
| 3+ Earners | 35 (4.6%) | $116,023 |
| Total | 764 (100.0%) | $97,625 |
Household Income in Spring Lake
Household Income Brackets in Spring Lake
With 250 households falling in the category, the $50,000 to $74,999 income range is the most frequent in Spring Lake, accounting for 19.7% of all households. In contrast, only 39 households (3.1%) fall into the $10,000 to $14,999 income bracket, making it the least populous group.
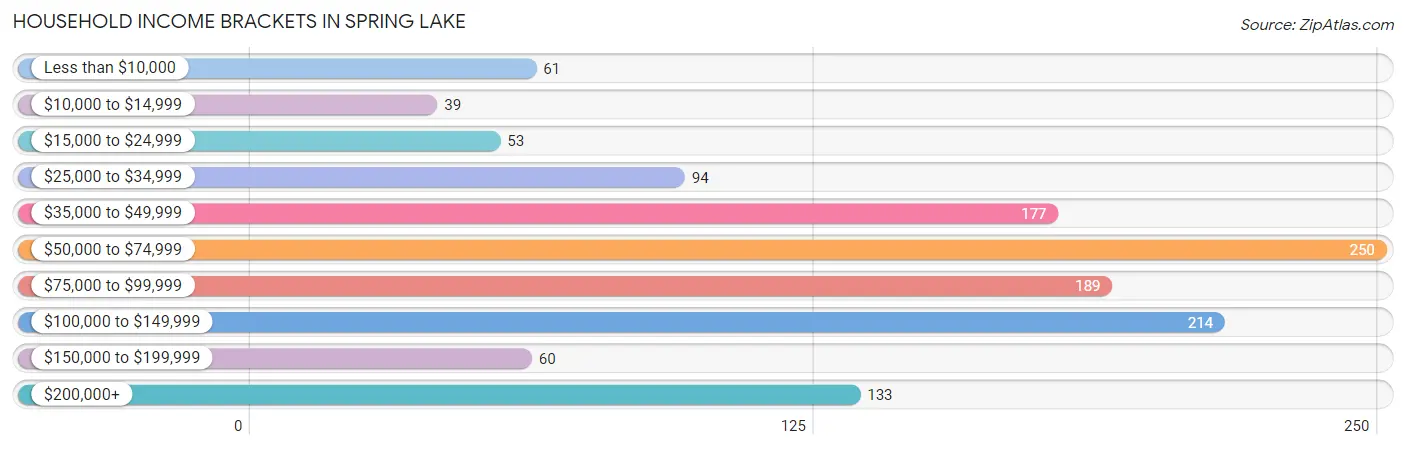
| Income Bracket | # Households | % Households |
| Less than $10,000 | 61 | 4.8% |
| $10,000 to $14,999 | 39 | 3.1% |
| $15,000 to $24,999 | 53 | 4.2% |
| $25,000 to $34,999 | 94 | 7.4% |
| $35,000 to $49,999 | 177 | 13.9% |
| $50,000 to $74,999 | 250 | 19.7% |
| $75,000 to $99,999 | 189 | 14.9% |
| $100,000 to $149,999 | 214 | 16.8% |
| $150,000 to $199,999 | 60 | 4.7% |
| $200,000+ | 133 | 10.5% |
Household Income by Householder Age in Spring Lake
The median household income in Spring Lake is $71,813, with the highest median household income of $73,462 found in the 45 to 64 years age bracket for the primary householder. A total of 332 households (26.1%) fall into this category. Meanwhile, the 15 to 24 years age bracket for the primary householder has the lowest median household income of $0, with 11 households (0.9%) in this group.
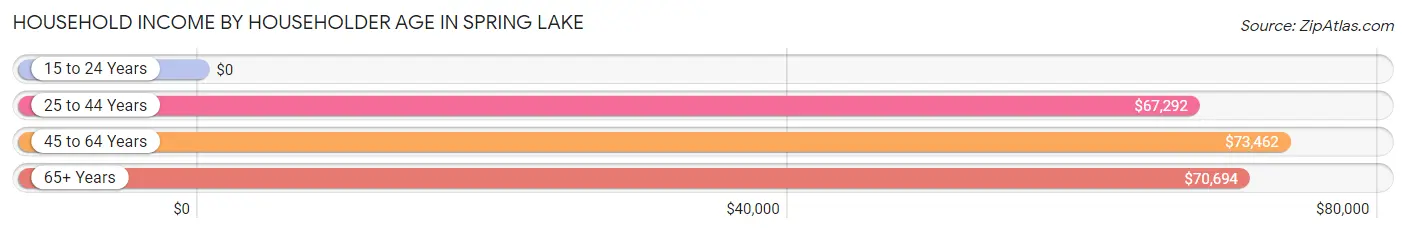
| Income Bracket | # Households | Median Income |
| 15 to 24 Years | 11 (0.9%) | $0 |
| 25 to 44 Years | 339 (26.7%) | $67,292 |
| 45 to 64 Years | 332 (26.1%) | $73,462 |
| 65+ Years | 589 (46.3%) | $70,694 |
| Total | 1,271 (100.0%) | $71,813 |
Poverty in Spring Lake
Income Below Poverty by Sex and Age in Spring Lake
With 4.6% poverty level for males and 7.7% for females among the residents of Spring Lake, 15 year old males and 75 year old and over females are the most vulnerable to poverty, with 2 males (100.0%) and 64 females (26.9%) in their respective age groups living below the poverty level.
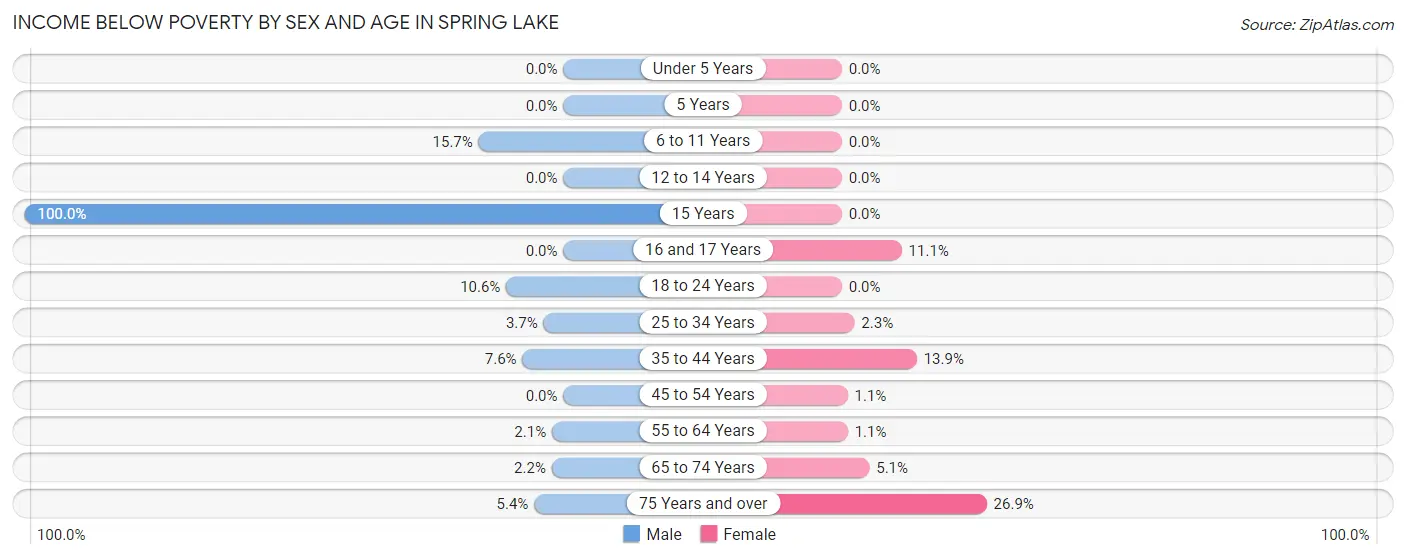
| Age Bracket | Male | Female |
| Under 5 Years | 0 (0.0%) | 0 (0.0%) |
| 5 Years | 0 (0.0%) | 0 (0.0%) |
| 6 to 11 Years | 14 (15.7%) | 0 (0.0%) |
| 12 to 14 Years | 0 (0.0%) | 0 (0.0%) |
| 15 Years | 2 (100.0%) | 0 (0.0%) |
| 16 and 17 Years | 0 (0.0%) | 2 (11.1%) |
| 18 to 24 Years | 7 (10.6%) | 0 (0.0%) |
| 25 to 34 Years | 5 (3.7%) | 3 (2.3%) |
| 35 to 44 Years | 12 (7.6%) | 21 (13.9%) |
| 45 to 54 Years | 0 (0.0%) | 1 (1.1%) |
| 55 to 64 Years | 4 (2.1%) | 3 (1.1%) |
| 65 to 74 Years | 5 (2.2%) | 13 (5.1%) |
| 75 Years and over | 4 (5.4%) | 64 (26.9%) |
| Total | 53 (4.6%) | 107 (7.7%) |
Income Above Poverty by Sex and Age in Spring Lake
According to the poverty statistics in Spring Lake, males aged under 5 years and females aged under 5 years are the age groups that are most secure financially, with 100.0% of males and 100.0% of females in these age groups living above the poverty line.
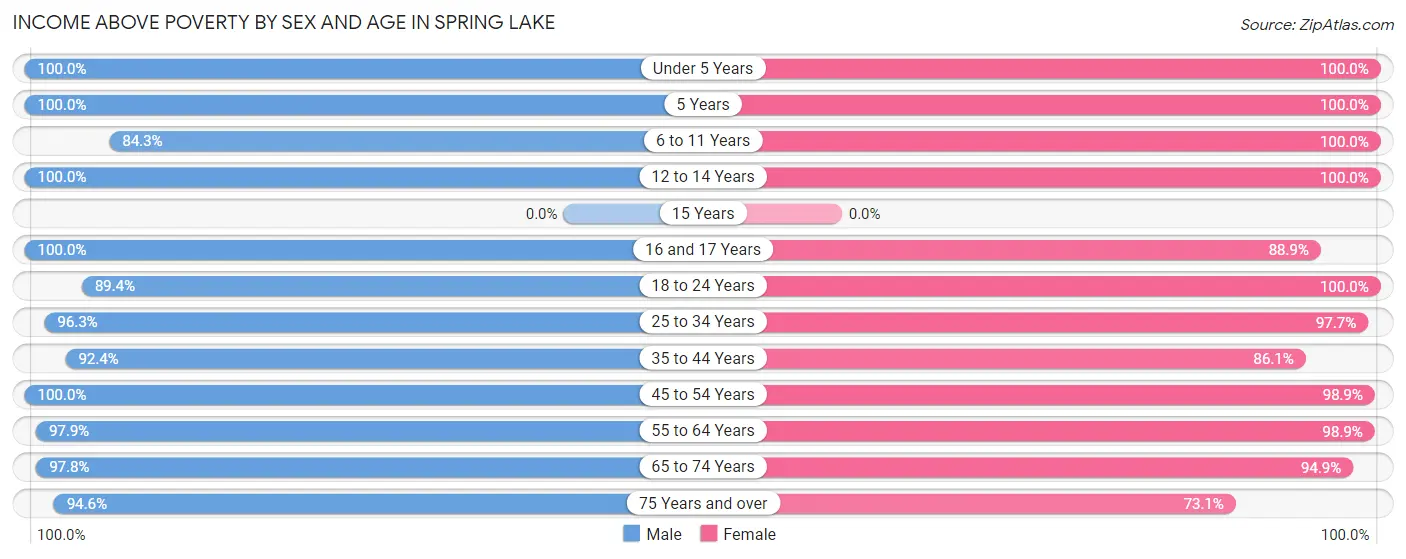
| Age Bracket | Male | Female |
| Under 5 Years | 57 (100.0%) | 37 (100.0%) |
| 5 Years | 20 (100.0%) | 13 (100.0%) |
| 6 to 11 Years | 75 (84.3%) | 110 (100.0%) |
| 12 to 14 Years | 19 (100.0%) | 10 (100.0%) |
| 15 Years | 0 (0.0%) | 0 (0.0%) |
| 16 and 17 Years | 20 (100.0%) | 16 (88.9%) |
| 18 to 24 Years | 59 (89.4%) | 55 (100.0%) |
| 25 to 34 Years | 131 (96.3%) | 125 (97.7%) |
| 35 to 44 Years | 146 (92.4%) | 130 (86.1%) |
| 45 to 54 Years | 84 (100.0%) | 92 (98.9%) |
| 55 to 64 Years | 186 (97.9%) | 269 (98.9%) |
| 65 to 74 Years | 227 (97.8%) | 242 (94.9%) |
| 75 Years and over | 70 (94.6%) | 174 (73.1%) |
| Total | 1,094 (95.4%) | 1,273 (92.2%) |
Income Below Poverty Among Married-Couple Families in Spring Lake
The poverty statistics for married-couple families in Spring Lake show that 1.1% or 7 of the total 633 families live below the poverty line. Families with no children have the highest poverty rate of 1.4%, comprising of 7 families. On the other hand, families with 1 or 2 children have the lowest poverty rate of 0.0%, which includes 0 families.
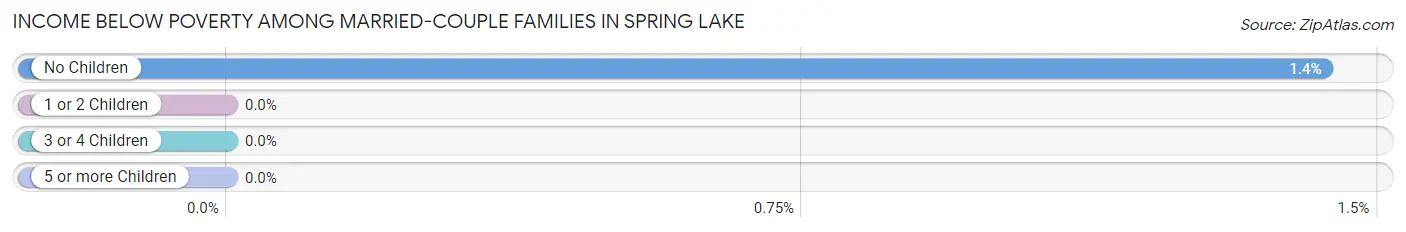
| Children | Above Poverty | Below Poverty |
| No Children | 482 (98.6%) | 7 (1.4%) |
| 1 or 2 Children | 91 (100.0%) | 0 (0.0%) |
| 3 or 4 Children | 53 (100.0%) | 0 (0.0%) |
| 5 or more Children | 0 (0.0%) | 0 (0.0%) |
| Total | 626 (98.9%) | 7 (1.1%) |
Income Below Poverty Among Single-Parent Households in Spring Lake
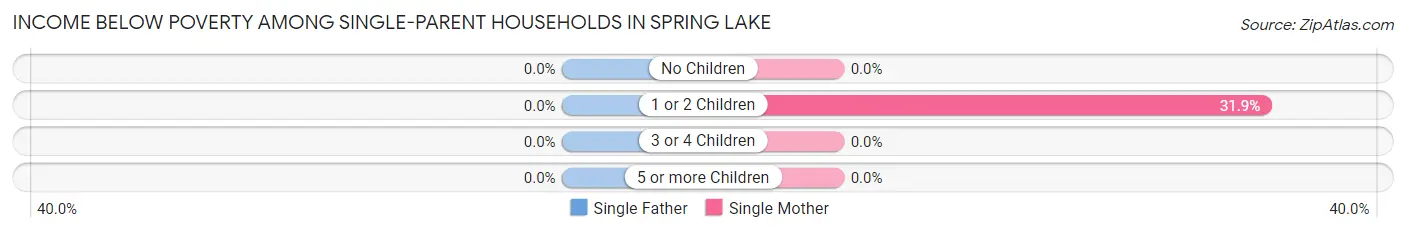
| Children | Single Father | Single Mother |
| No Children | 0 (0.0%) | 0 (0.0%) |
| 1 or 2 Children | 0 (0.0%) | 15 (31.9%) |
| 3 or 4 Children | 0 (0.0%) | 0 (0.0%) |
| 5 or more Children | 0 (0.0%) | 0 (0.0%) |
| Total | 0 (0.0%) | 15 (17.4%) |
Income Below Poverty Among Married-Couple vs Single-Parent Households in Spring Lake
The poverty data for Spring Lake shows that 7 of the married-couple family households (1.1%) and 15 of the single-parent households (11.5%) are living below the poverty level. Within the married-couple family households, those with no children have the highest poverty rate, with 7 households (1.4%) falling below the poverty line. Among the single-parent households, those with 1 or 2 children have the highest poverty rate, with 15 household (26.3%) living below poverty.
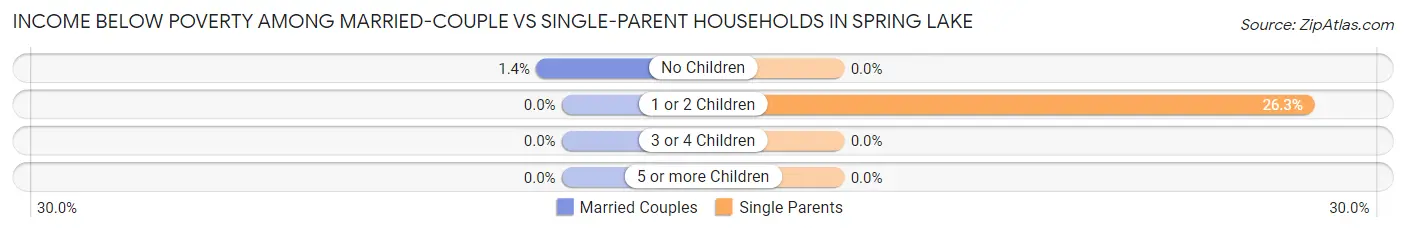
| Children | Married-Couple Families | Single-Parent Households |
| No Children | 7 (1.4%) | 0 (0.0%) |
| 1 or 2 Children | 0 (0.0%) | 15 (26.3%) |
| 3 or 4 Children | 0 (0.0%) | 0 (0.0%) |
| 5 or more Children | 0 (0.0%) | 0 (0.0%) |
| Total | 7 (1.1%) | 15 (11.5%) |
Race in Spring Lake
The most populous races in Spring Lake are White / Caucasian (2,364 | 93.4%), Two or more Races (122 | 4.8%), and Asian (29 | 1.1%).
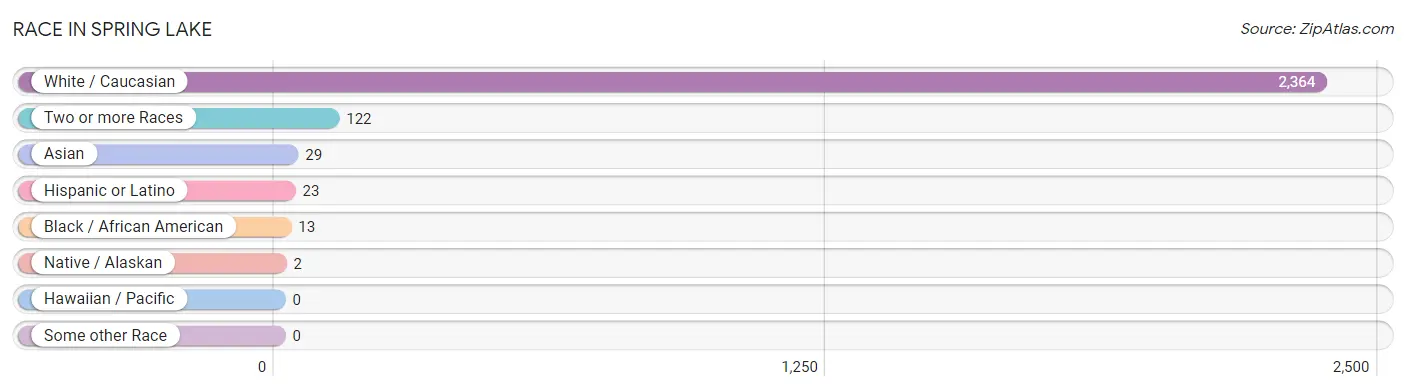
| Race | # Population | % Population |
| Asian | 29 | 1.1% |
| Black / African American | 13 | 0.5% |
| Hawaiian / Pacific | 0 | 0.0% |
| Hispanic or Latino | 23 | 0.9% |
| Native / Alaskan | 2 | 0.1% |
| White / Caucasian | 2,364 | 93.4% |
| Two or more Races | 122 | 4.8% |
| Some other Race | 0 | 0.0% |
| Total | 2,530 | 100.0% |
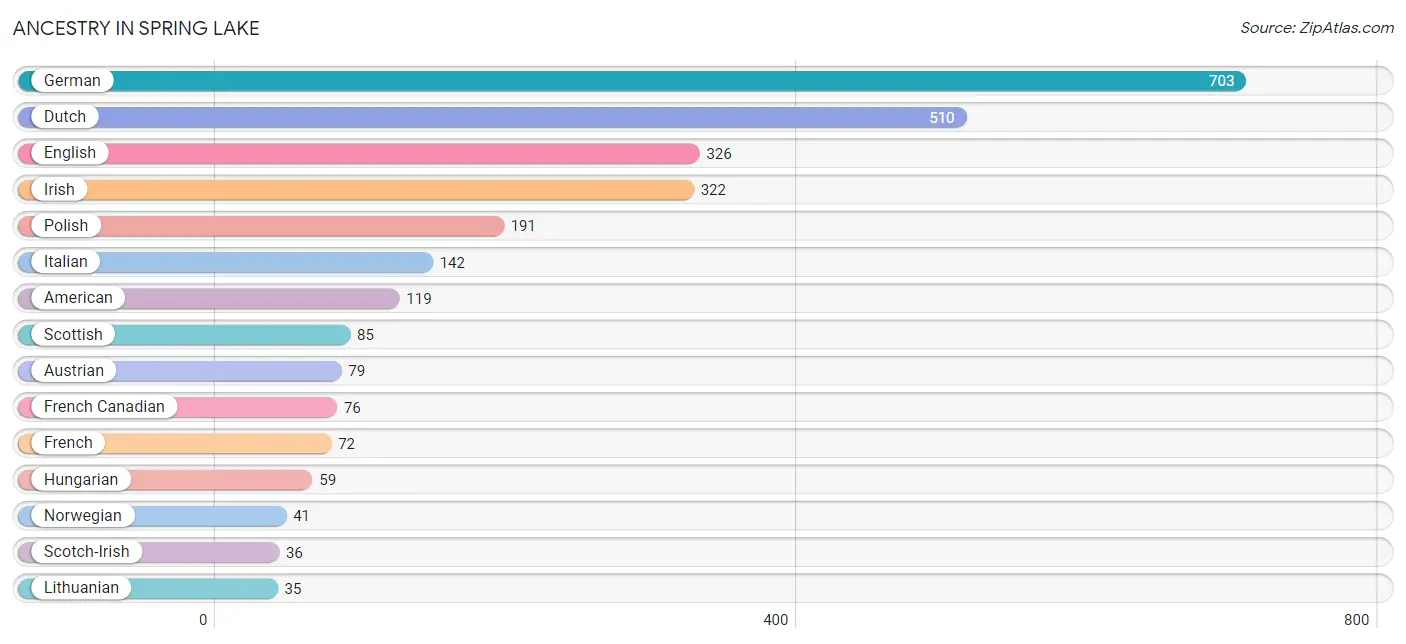
Ancestry in Spring Lake
The most populous ancestries reported in Spring Lake are German (703 | 27.8%), Dutch (510 | 20.2%), English (326 | 12.9%), Irish (322 | 12.7%), and Polish (191 | 7.5%), together accounting for 81.1% of all Spring Lake residents.
| Ancestry | # Population | % Population |
| African | 2 | 0.1% |
| American | 119 | 4.7% |
| Australian | 5 | 0.2% |
| Austrian | 79 | 3.1% |
| Blackfeet | 3 | 0.1% |
| British | 9 | 0.4% |
| Burmese | 9 | 0.4% |
| Canadian | 12 | 0.5% |
| Chippewa | 6 | 0.2% |
| Danish | 13 | 0.5% |
| Dutch | 510 | 20.2% |
| Eastern European | 5 | 0.2% |
| English | 326 | 12.9% |
| European | 29 | 1.1% |
| Finnish | 7 | 0.3% |
| French | 72 | 2.9% |
| French Canadian | 76 | 3.0% |
| German | 703 | 27.8% |
| Greek | 16 | 0.6% |
| Hungarian | 59 | 2.3% |
| Irish | 322 | 12.7% |
| Italian | 142 | 5.6% |
| Korean | 14 | 0.5% |
| Latvian | 29 | 1.1% |
| Lithuanian | 35 | 1.4% |
| Mexican | 14 | 0.5% |
| Northern European | 6 | 0.2% |
| Norwegian | 41 | 1.6% |
| Polish | 191 | 7.5% |
| Potawatomi | 11 | 0.4% |
| Puerto Rican | 8 | 0.3% |
| Scandinavian | 21 | 0.8% |
| Scotch-Irish | 36 | 1.4% |
| Scottish | 85 | 3.4% |
| Serbian | 11 | 0.4% |
| Slovak | 6 | 0.2% |
| Slovene | 11 | 0.4% |
| Sri Lankan | 2 | 0.1% |
| Subsaharan African | 2 | 0.1% |
| Swedish | 32 | 1.3% |
| Swiss | 7 | 0.3% |
| Thai | 11 | 0.4% |
| Welsh | 7 | 0.3% | View All 43 Rows |
Immigrants in Spring Lake
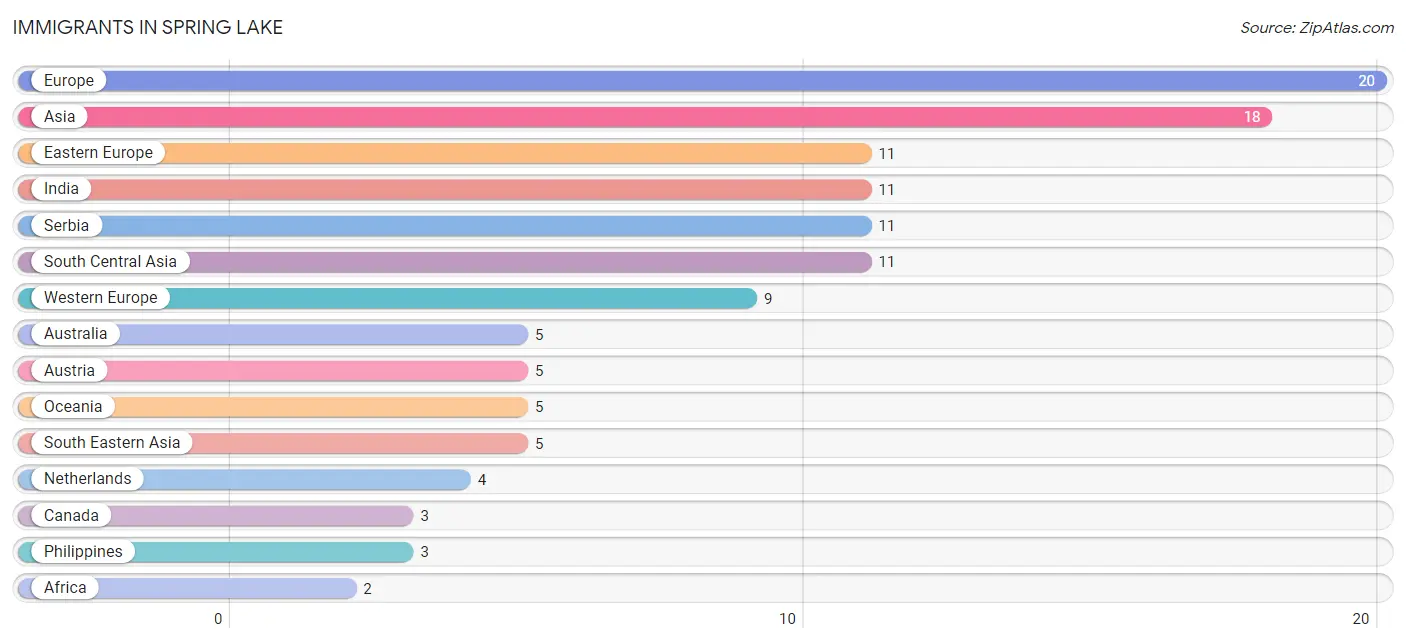
The most numerous immigrant groups reported in Spring Lake came from Europe (20 | 0.8%), Asia (18 | 0.7%), Eastern Europe (11 | 0.4%), India (11 | 0.4%), and Serbia (11 | 0.4%), together accounting for 2.8% of all Spring Lake residents.
| Immigration Origin | # Population | % Population |
| Africa | 2 | 0.1% |
| Asia | 18 | 0.7% |
| Australia | 5 | 0.2% |
| Austria | 5 | 0.2% |
| Canada | 3 | 0.1% |
| Central America | 1 | 0.0% |
| Eastern Africa | 2 | 0.1% |
| Eastern Asia | 2 | 0.1% |
| Eastern Europe | 11 | 0.4% |
| Europe | 20 | 0.8% |
| India | 11 | 0.4% |
| Korea | 2 | 0.1% |
| Latin America | 1 | 0.0% |
| Mexico | 1 | 0.0% |
| Netherlands | 4 | 0.2% |
| Oceania | 5 | 0.2% |
| Philippines | 3 | 0.1% |
| Serbia | 11 | 0.4% |
| South Central Asia | 11 | 0.4% |
| South Eastern Asia | 5 | 0.2% |
| Vietnam | 2 | 0.1% |
| Western Europe | 9 | 0.4% | View All 22 Rows |
Sex and Age in Spring Lake
Sex and Age in Spring Lake
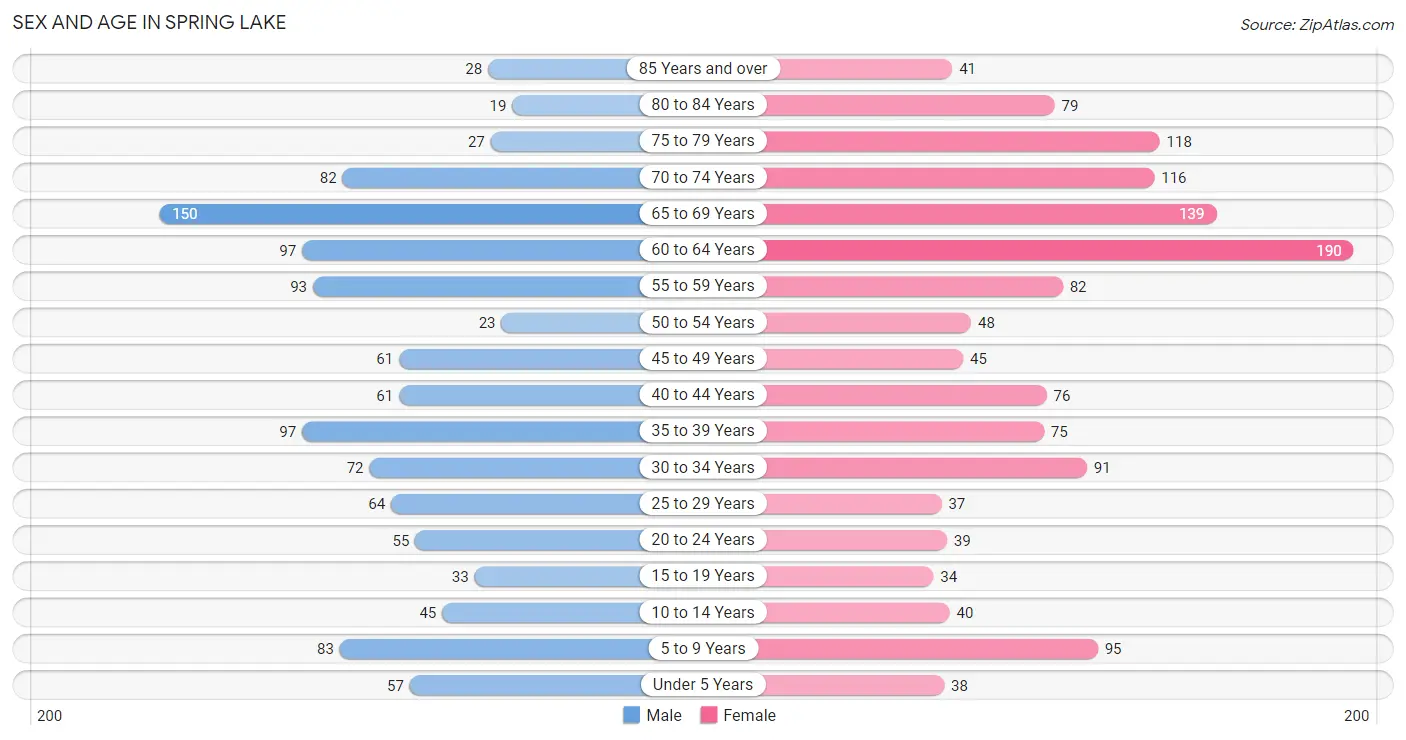
The most populous age groups in Spring Lake are 65 to 69 Years (150 | 13.1%) for men and 60 to 64 Years (190 | 13.7%) for women.
| Age Bracket | Male | Female |
| Under 5 Years | 57 (5.0%) | 38 (2.8%) |
| 5 to 9 Years | 83 (7.2%) | 95 (6.9%) |
| 10 to 14 Years | 45 (3.9%) | 40 (2.9%) |
| 15 to 19 Years | 33 (2.9%) | 34 (2.5%) |
| 20 to 24 Years | 55 (4.8%) | 39 (2.8%) |
| 25 to 29 Years | 64 (5.6%) | 37 (2.7%) |
| 30 to 34 Years | 72 (6.3%) | 91 (6.6%) |
| 35 to 39 Years | 97 (8.5%) | 75 (5.4%) |
| 40 to 44 Years | 61 (5.3%) | 76 (5.5%) |
| 45 to 49 Years | 61 (5.3%) | 45 (3.3%) |
| 50 to 54 Years | 23 (2.0%) | 48 (3.5%) |
| 55 to 59 Years | 93 (8.1%) | 82 (5.9%) |
| 60 to 64 Years | 97 (8.5%) | 190 (13.7%) |
| 65 to 69 Years | 150 (13.1%) | 139 (10.1%) |
| 70 to 74 Years | 82 (7.1%) | 116 (8.4%) |
| 75 to 79 Years | 27 (2.4%) | 118 (8.5%) |
| 80 to 84 Years | 19 (1.7%) | 79 (5.7%) |
| 85 Years and over | 28 (2.4%) | 41 (3.0%) |
| Total | 1,147 (100.0%) | 1,383 (100.0%) |
Families and Households in Spring Lake
Median Family Size in Spring Lake
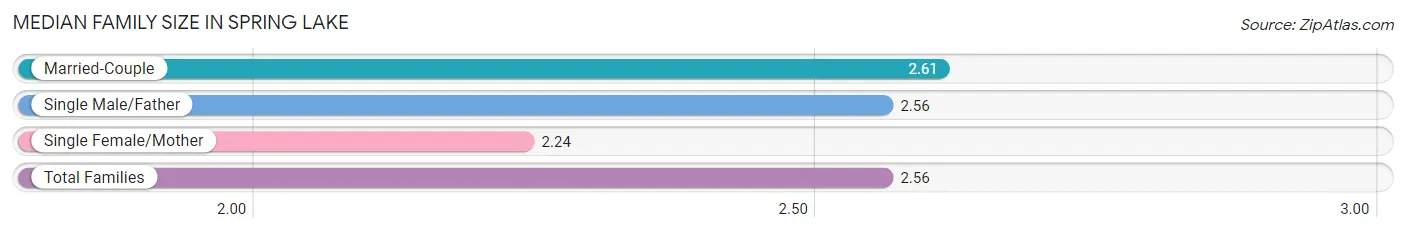
The median family size in Spring Lake is 2.56 persons per family, with married-couple families (633 | 82.9%) accounting for the largest median family size of 2.61 persons per family. On the other hand, single female/mother families (86 | 11.3%) represent the smallest median family size with 2.24 persons per family.
| Family Type | # Families | Family Size |
| Married-Couple | 633 (82.9%) | 2.61 |
| Single Male/Father | 45 (5.9%) | 2.56 |
| Single Female/Mother | 86 (11.3%) | 2.24 |
| Total Families | 764 (100.0%) | 2.56 |
Median Household Size in Spring Lake
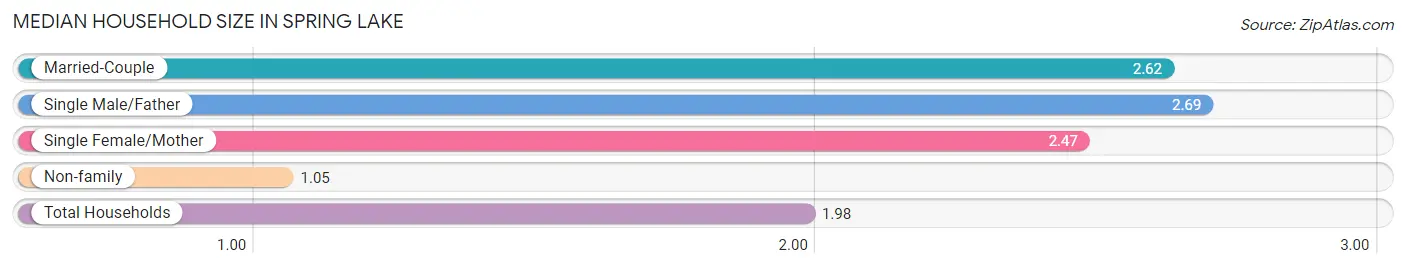
The median household size in Spring Lake is 1.98 persons per household, with single male/father households (45 | 3.5%) accounting for the largest median household size of 2.69 persons per household. non-family households (507 | 39.9%) represent the smallest median household size with 1.05 persons per household.
| Household Type | # Households | Household Size |
| Married-Couple | 633 (49.8%) | 2.62 |
| Single Male/Father | 45 (3.5%) | 2.69 |
| Single Female/Mother | 86 (6.8%) | 2.47 |
| Non-family | 507 (39.9%) | 1.05 |
| Total Households | 1,271 (100.0%) | 1.98 |
Household Size by Marriage Status in Spring Lake
Out of a total of 1,271 households in Spring Lake, 764 (60.1%) are family households, while 507 (39.9%) are nonfamily households. The most numerous type of family households are 2-person households, comprising 507, and the most common type of nonfamily households are 1-person households, comprising 470.
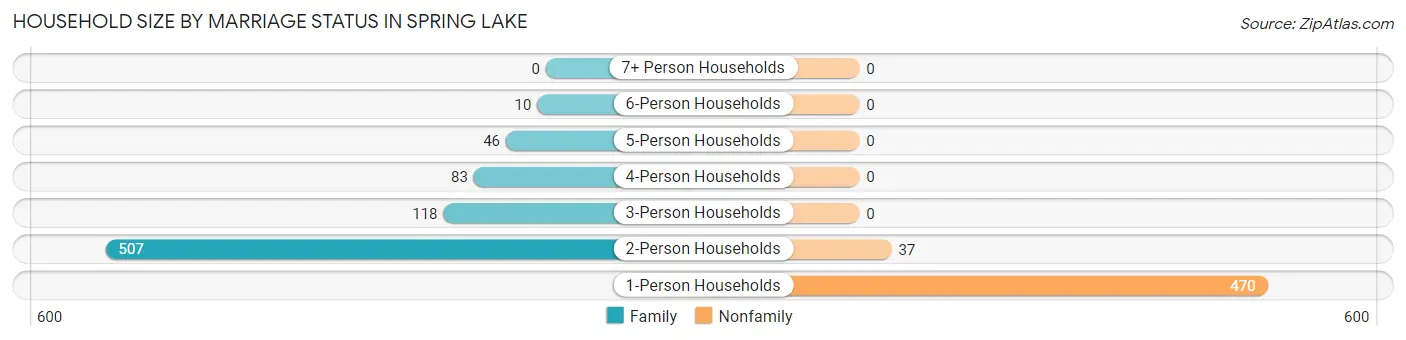
| Household Size | Family Households | Nonfamily Households |
| 1-Person Households | - | 470 (37.0%) |
| 2-Person Households | 507 (39.9%) | 37 (2.9%) |
| 3-Person Households | 118 (9.3%) | 0 (0.0%) |
| 4-Person Households | 83 (6.5%) | 0 (0.0%) |
| 5-Person Households | 46 (3.6%) | 0 (0.0%) |
| 6-Person Households | 10 (0.8%) | 0 (0.0%) |
| 7+ Person Households | 0 (0.0%) | 0 (0.0%) |
| Total | 764 (60.1%) | 507 (39.9%) |
Female Fertility in Spring Lake
Fertility by Age in Spring Lake
Average fertility rate in Spring Lake is 53.0 births per 1,000 women. Women in the age bracket of 20 to 34 years have the highest fertility rate with 108.0 births per 1,000 women. Women in the age bracket of 20 to 34 years acount for 85.7% of all women with births.
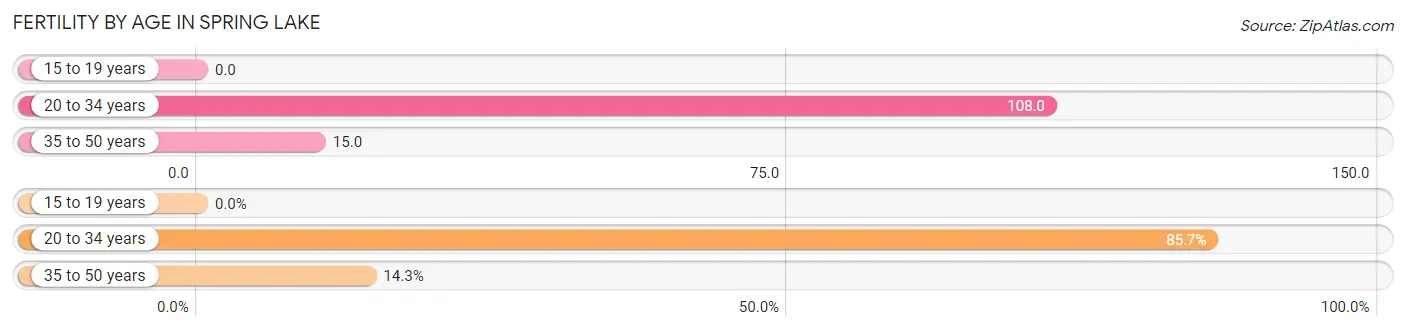
| Age Bracket | Women with Births | Births / 1,000 Women |
| 15 to 19 years | 0 (0.0%) | 0.0 |
| 20 to 34 years | 18 (85.7%) | 108.0 |
| 35 to 50 years | 3 (14.3%) | 15.0 |
| Total | 21 (100.0%) | 53.0 |
Fertility by Age by Marriage Status in Spring Lake
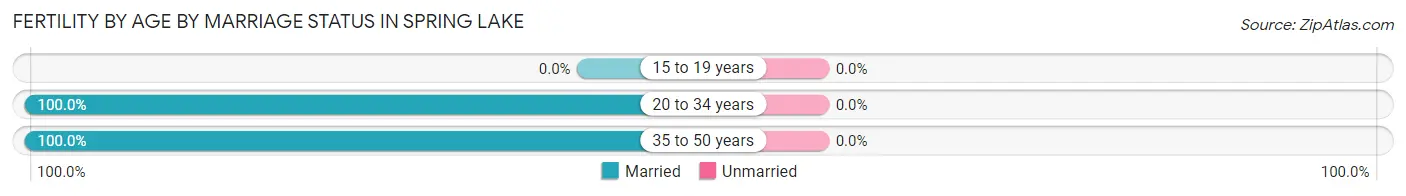
| Age Bracket | Married | Unmarried |
| 15 to 19 years | 0 (0.0%) | 0 (0.0%) |
| 20 to 34 years | 18 (100.0%) | 0 (0.0%) |
| 35 to 50 years | 3 (100.0%) | 0 (0.0%) |
| Total | 21 (100.0%) | 0 (0.0%) |
Fertility by Education in Spring Lake
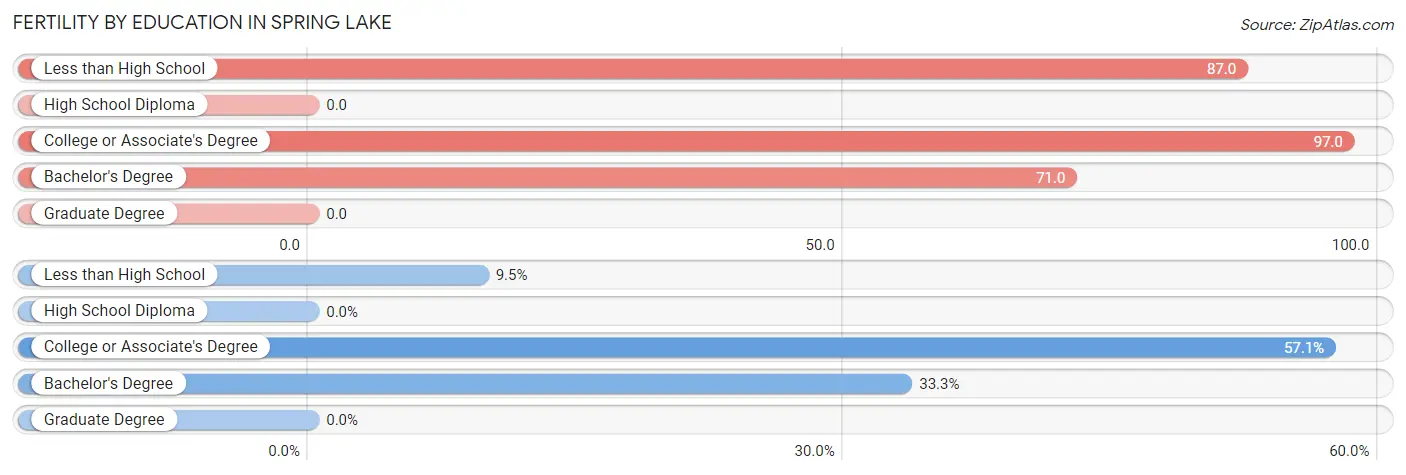
| Educational Attainment | Women with Births | Births / 1,000 Women |
| Less than High School | 2 (9.5%) | 87.0 |
| High School Diploma | 0 (0.0%) | 0.0 |
| College or Associate's Degree | 12 (57.1%) | 97.0 |
| Bachelor's Degree | 7 (33.3%) | 71.0 |
| Graduate Degree | 0 (0.0%) | 0.0 |
| Total | 21 (100.0%) | 53.0 |
Fertility by Education by Marriage Status in Spring Lake
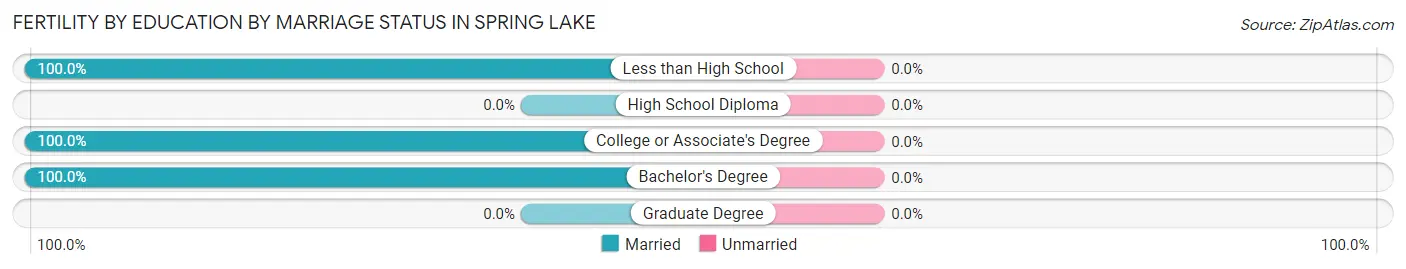
| Educational Attainment | Married | Unmarried |
| Less than High School | 2 (100.0%) | 0 (0.0%) |
| High School Diploma | 0 (0.0%) | 0 (0.0%) |
| College or Associate's Degree | 12 (100.0%) | 0 (0.0%) |
| Bachelor's Degree | 7 (100.0%) | 0 (0.0%) |
| Graduate Degree | 0 (0.0%) | 0 (0.0%) |
| Total | 21 (100.0%) | 0 (0.0%) |
Employment Characteristics in Spring Lake
Employment by Class of Employer in Spring Lake
Among the 1,274 employed individuals in Spring Lake, private company employees (783 | 61.5%), not-for-profit organizations (191 | 15.0%), and self-employed (incorporated) (128 | 10.1%) make up the most common classes of employment.
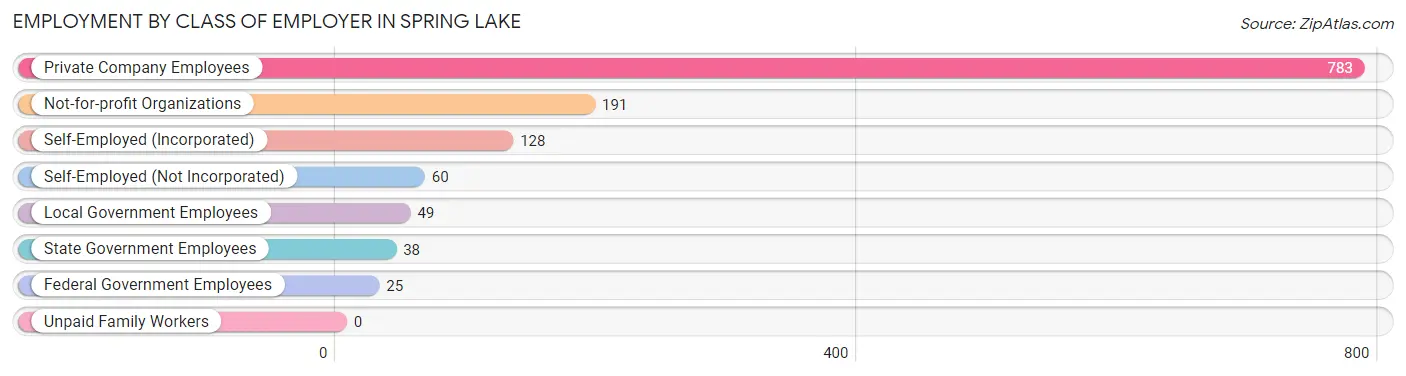
| Employer Class | # Employees | % Employees |
| Private Company Employees | 783 | 61.5% |
| Self-Employed (Incorporated) | 128 | 10.1% |
| Self-Employed (Not Incorporated) | 60 | 4.7% |
| Not-for-profit Organizations | 191 | 15.0% |
| Local Government Employees | 49 | 3.8% |
| State Government Employees | 38 | 3.0% |
| Federal Government Employees | 25 | 2.0% |
| Unpaid Family Workers | 0 | 0.0% |
| Total | 1,274 | 100.0% |
Employment Status by Age in Spring Lake
According to the labor force statistics for Spring Lake, out of the total population over 16 years of age (2,170), 64.8% or 1,406 individuals are in the labor force, with 4.4% or 62 of them unemployed. The age group with the highest labor force participation rate is 45 to 54 years, with 99.4% or 176 individuals in the labor force. Within the labor force, the 16 to 19 years age range has the highest percentage of unemployed individuals, with 16.1% or 5 of them being unemployed.
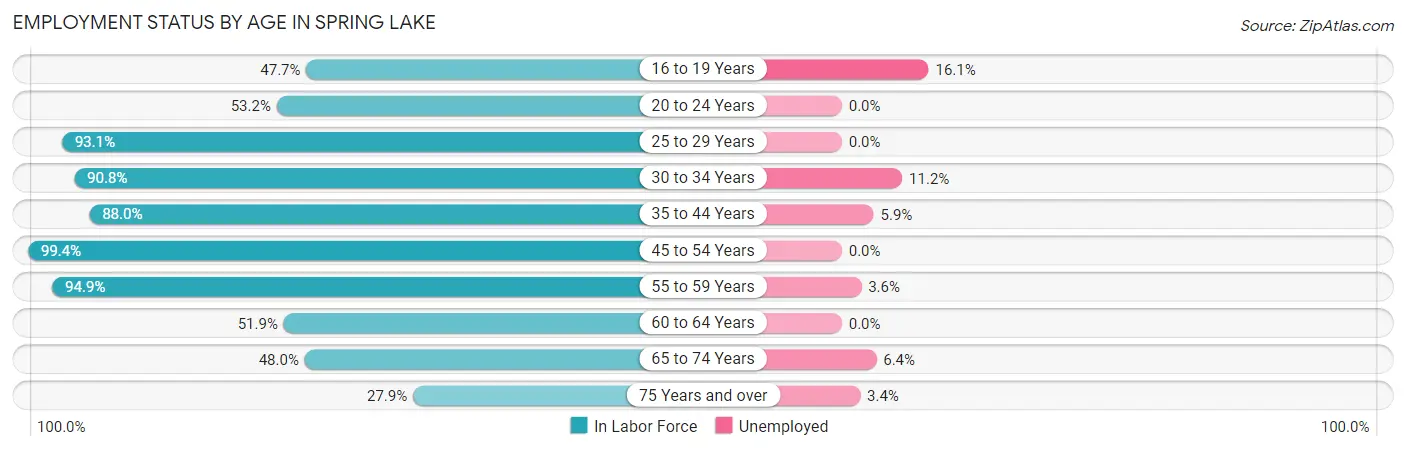
| Age Bracket | In Labor Force | Unemployed |
| 16 to 19 Years | 31 (47.7%) | 5 (16.1%) |
| 20 to 24 Years | 50 (53.2%) | 0 (0.0%) |
| 25 to 29 Years | 94 (93.1%) | 0 (0.0%) |
| 30 to 34 Years | 148 (90.8%) | 17 (11.2%) |
| 35 to 44 Years | 272 (88.0%) | 16 (5.9%) |
| 45 to 54 Years | 176 (99.4%) | 0 (0.0%) |
| 55 to 59 Years | 166 (94.9%) | 6 (3.6%) |
| 60 to 64 Years | 149 (51.9%) | 0 (0.0%) |
| 65 to 74 Years | 234 (48.0%) | 15 (6.4%) |
| 75 Years and over | 87 (27.9%) | 3 (3.4%) |
| Total | 1,406 (64.8%) | 62 (4.4%) |
Employment Status by Educational Attainment in Spring Lake
According to labor force statistics for Spring Lake, 82.9% of individuals (1,005) out of the total population between 25 and 64 years of age (1,212) are in the labor force, with 3.8% or 38 of them being unemployed. The group with the highest labor force participation rate are those with the educational attainment of less than high school, with 100.0% or 16 individuals in the labor force. Within the labor force, individuals with less than high school education have the highest percentage of unemployment, with 50.0% or 8 of them being unemployed.
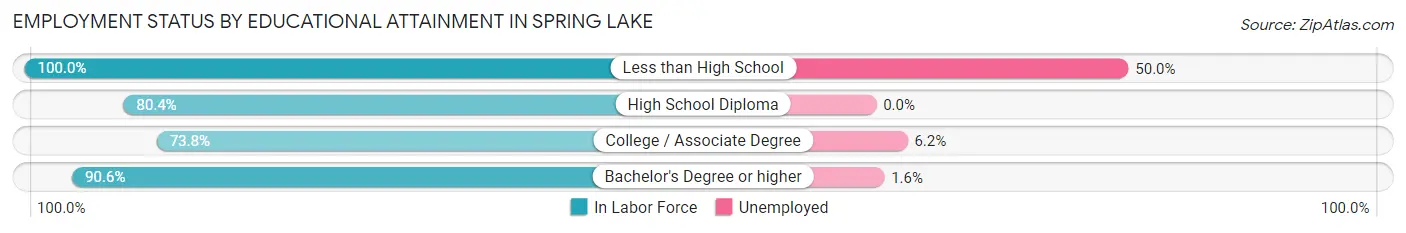
| Educational Attainment | In Labor Force | Unemployed |
| Less than High School | 16 (100.0%) | 8 (50.0%) |
| High School Diploma | 115 (80.4%) | 0 (0.0%) |
| College / Associate Degree | 353 (73.8%) | 30 (6.2%) |
| Bachelor's Degree or higher | 521 (90.6%) | 9 (1.6%) |
| Total | 1,005 (82.9%) | 46 (3.8%) |
Employment Occupations by Sex in Spring Lake
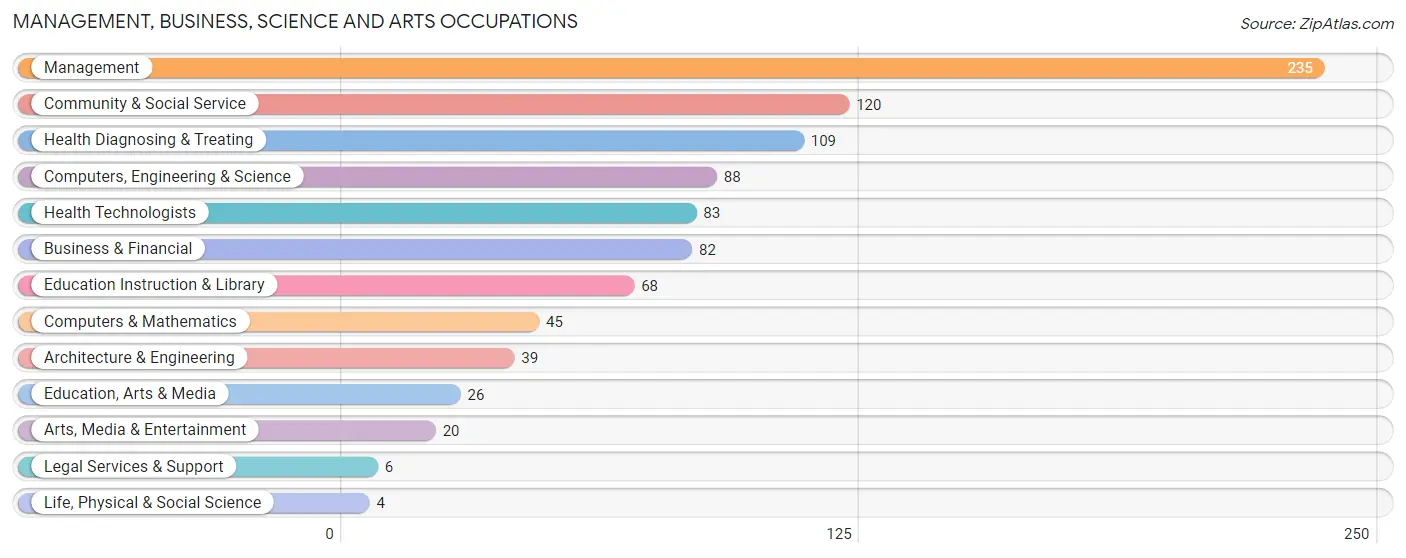
Management, Business, Science and Arts Occupations
The most common Management, Business, Science and Arts occupations in Spring Lake are Management (235 | 17.5%), Community & Social Service (120 | 8.9%), Health Diagnosing & Treating (109 | 8.1%), Computers, Engineering & Science (88 | 6.6%), and Health Technologists (83 | 6.2%).
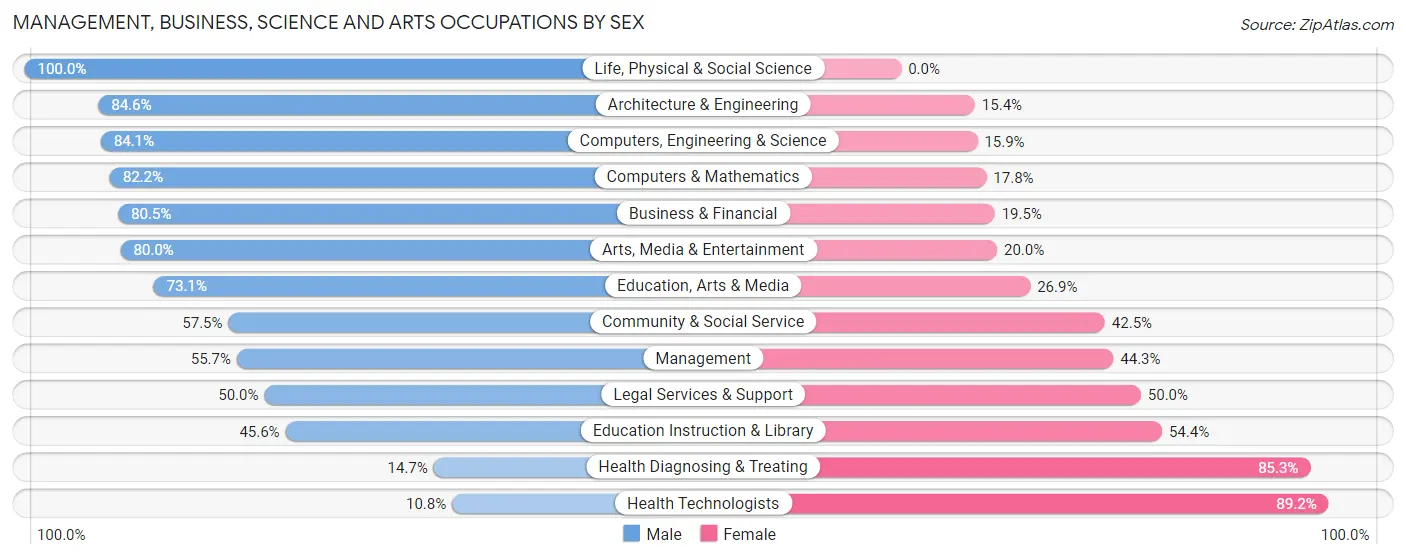
Management, Business, Science and Arts Occupations by Sex
Within the Management, Business, Science and Arts occupations in Spring Lake, the most male-oriented occupations are Life, Physical & Social Science (100.0%), Architecture & Engineering (84.6%), and Computers, Engineering & Science (84.1%), while the most female-oriented occupations are Health Technologists (89.2%), Health Diagnosing & Treating (85.3%), and Education Instruction & Library (54.4%).
| Occupation | Male | Female |
| Management | 131 (55.7%) | 104 (44.3%) |
| Business & Financial | 66 (80.5%) | 16 (19.5%) |
| Computers, Engineering & Science | 74 (84.1%) | 14 (15.9%) |
| Computers & Mathematics | 37 (82.2%) | 8 (17.8%) |
| Architecture & Engineering | 33 (84.6%) | 6 (15.4%) |
| Life, Physical & Social Science | 4 (100.0%) | 0 (0.0%) |
| Community & Social Service | 69 (57.5%) | 51 (42.5%) |
| Education, Arts & Media | 19 (73.1%) | 7 (26.9%) |
| Legal Services & Support | 3 (50.0%) | 3 (50.0%) |
| Education Instruction & Library | 31 (45.6%) | 37 (54.4%) |
| Arts, Media & Entertainment | 16 (80.0%) | 4 (20.0%) |
| Health Diagnosing & Treating | 16 (14.7%) | 93 (85.3%) |
| Health Technologists | 9 (10.8%) | 74 (89.2%) |
| Total (Category) | 356 (56.1%) | 278 (43.9%) |
| Total (Overall) | 693 (51.7%) | 648 (48.3%) |
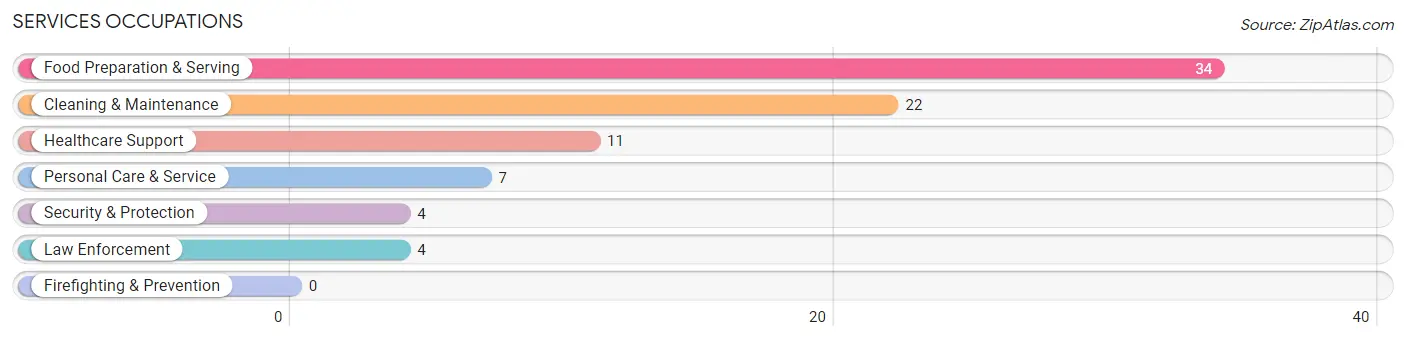
Services Occupations
The most common Services occupations in Spring Lake are Food Preparation & Serving (34 | 2.5%), Cleaning & Maintenance (22 | 1.6%), Healthcare Support (11 | 0.8%), Personal Care & Service (7 | 0.5%), and Security & Protection (4 | 0.3%).
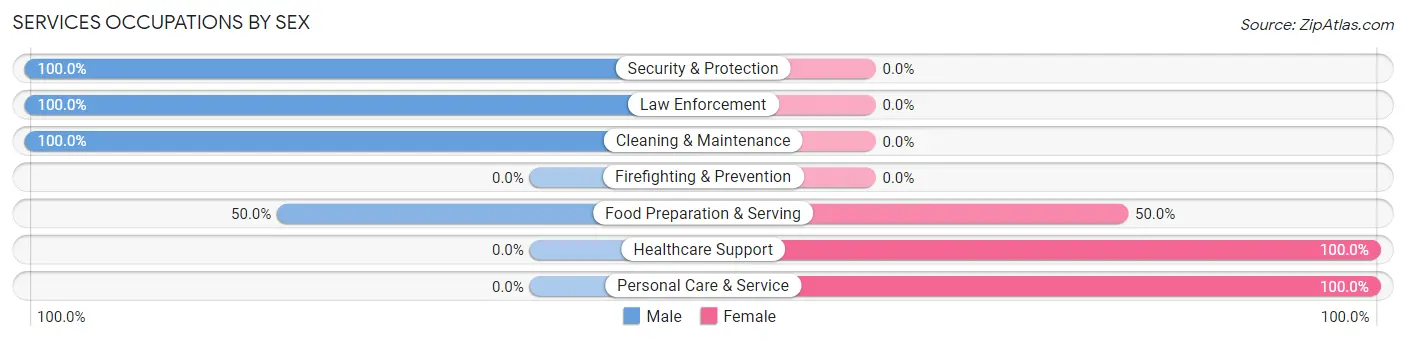
Services Occupations by Sex
Within the Services occupations in Spring Lake, the most male-oriented occupations are Security & Protection (100.0%), Law Enforcement (100.0%), and Cleaning & Maintenance (100.0%), while the most female-oriented occupations are Healthcare Support (100.0%), Personal Care & Service (100.0%), and Food Preparation & Serving (50.0%).
| Occupation | Male | Female |
| Healthcare Support | 0 (0.0%) | 11 (100.0%) |
| Security & Protection | 4 (100.0%) | 0 (0.0%) |
| Firefighting & Prevention | 0 (0.0%) | 0 (0.0%) |
| Law Enforcement | 4 (100.0%) | 0 (0.0%) |
| Food Preparation & Serving | 17 (50.0%) | 17 (50.0%) |
| Cleaning & Maintenance | 22 (100.0%) | 0 (0.0%) |
| Personal Care & Service | 0 (0.0%) | 7 (100.0%) |
| Total (Category) | 43 (55.1%) | 35 (44.9%) |
| Total (Overall) | 693 (51.7%) | 648 (48.3%) |
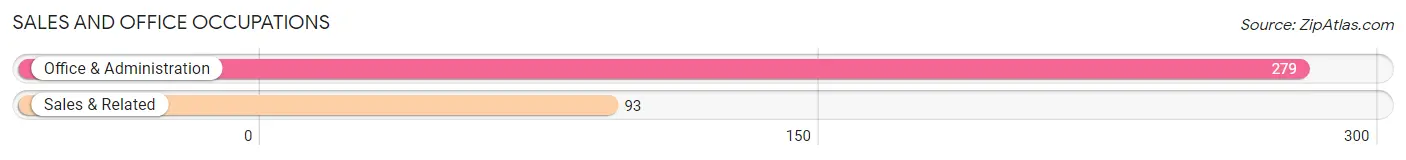
Sales and Office Occupations
The most common Sales and Office occupations in Spring Lake are Office & Administration (279 | 20.8%), and Sales & Related (93 | 6.9%).
Sales and Office Occupations by Sex
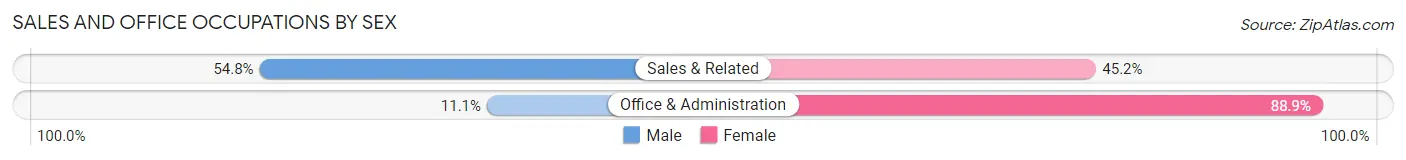
| Occupation | Male | Female |
| Sales & Related | 51 (54.8%) | 42 (45.2%) |
| Office & Administration | 31 (11.1%) | 248 (88.9%) |
| Total (Category) | 82 (22.0%) | 290 (78.0%) |
| Total (Overall) | 693 (51.7%) | 648 (48.3%) |
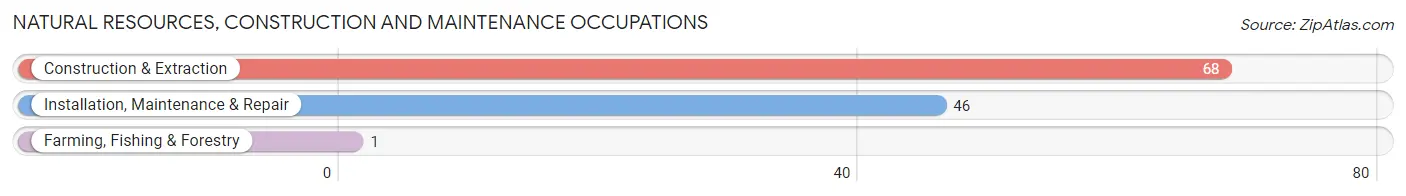
Natural Resources, Construction and Maintenance Occupations
The most common Natural Resources, Construction and Maintenance occupations in Spring Lake are Construction & Extraction (68 | 5.1%), Installation, Maintenance & Repair (46 | 3.4%), and Farming, Fishing & Forestry (1 | 0.1%).
Natural Resources, Construction and Maintenance Occupations by Sex
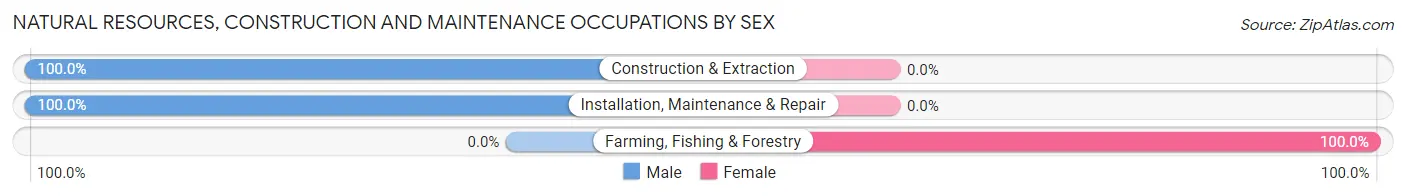
| Occupation | Male | Female |
| Farming, Fishing & Forestry | 0 (0.0%) | 1 (100.0%) |
| Construction & Extraction | 68 (100.0%) | 0 (0.0%) |
| Installation, Maintenance & Repair | 46 (100.0%) | 0 (0.0%) |
| Total (Category) | 114 (99.1%) | 1 (0.9%) |
| Total (Overall) | 693 (51.7%) | 648 (48.3%) |
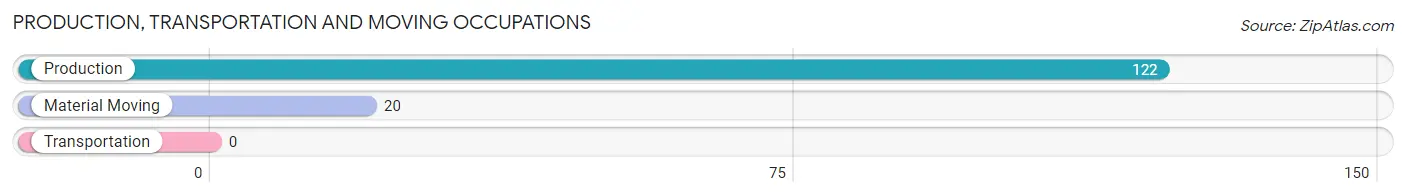
Production, Transportation and Moving Occupations
The most common Production, Transportation and Moving occupations in Spring Lake are Production (122 | 9.1%), and Material Moving (20 | 1.5%).
Production, Transportation and Moving Occupations by Sex
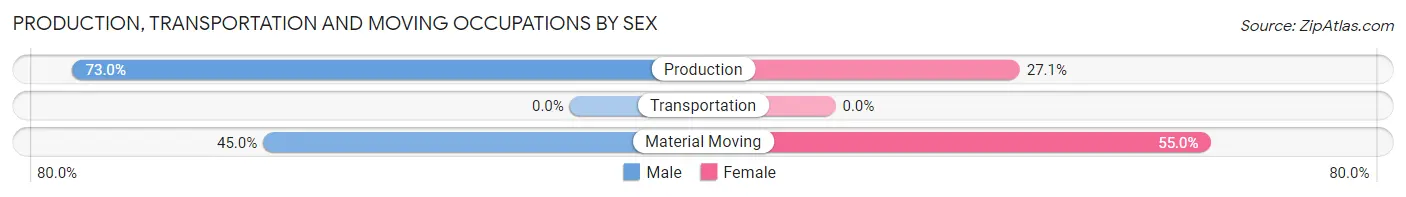
| Occupation | Male | Female |
| Production | 89 (73.0%) | 33 (27.1%) |
| Transportation | 0 (0.0%) | 0 (0.0%) |
| Material Moving | 9 (45.0%) | 11 (55.0%) |
| Total (Category) | 98 (69.0%) | 44 (31.0%) |
| Total (Overall) | 693 (51.7%) | 648 (48.3%) |
Employment Industries by Sex in Spring Lake
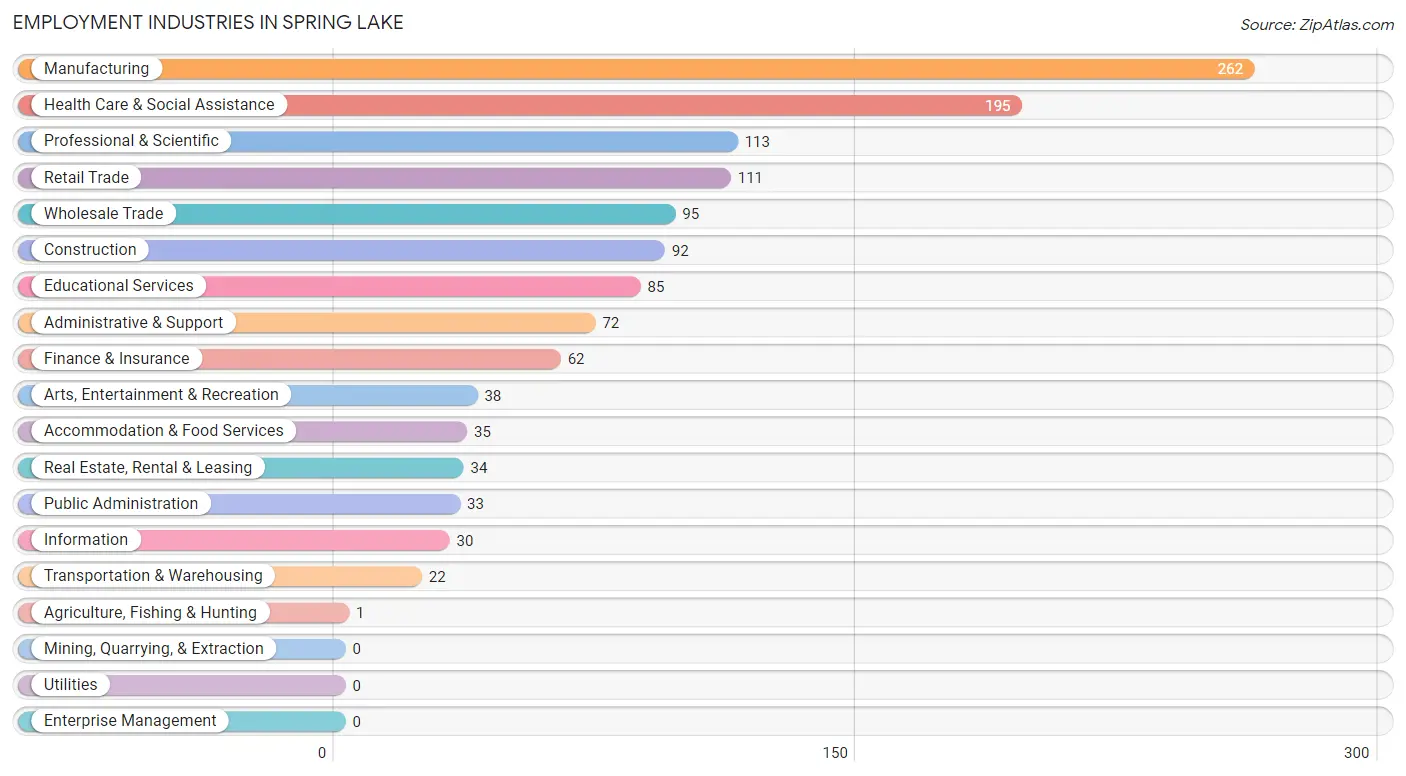
Employment Industries in Spring Lake
The major employment industries in Spring Lake include Manufacturing (262 | 19.5%), Health Care & Social Assistance (195 | 14.5%), Professional & Scientific (113 | 8.4%), Retail Trade (111 | 8.3%), and Wholesale Trade (95 | 7.1%).
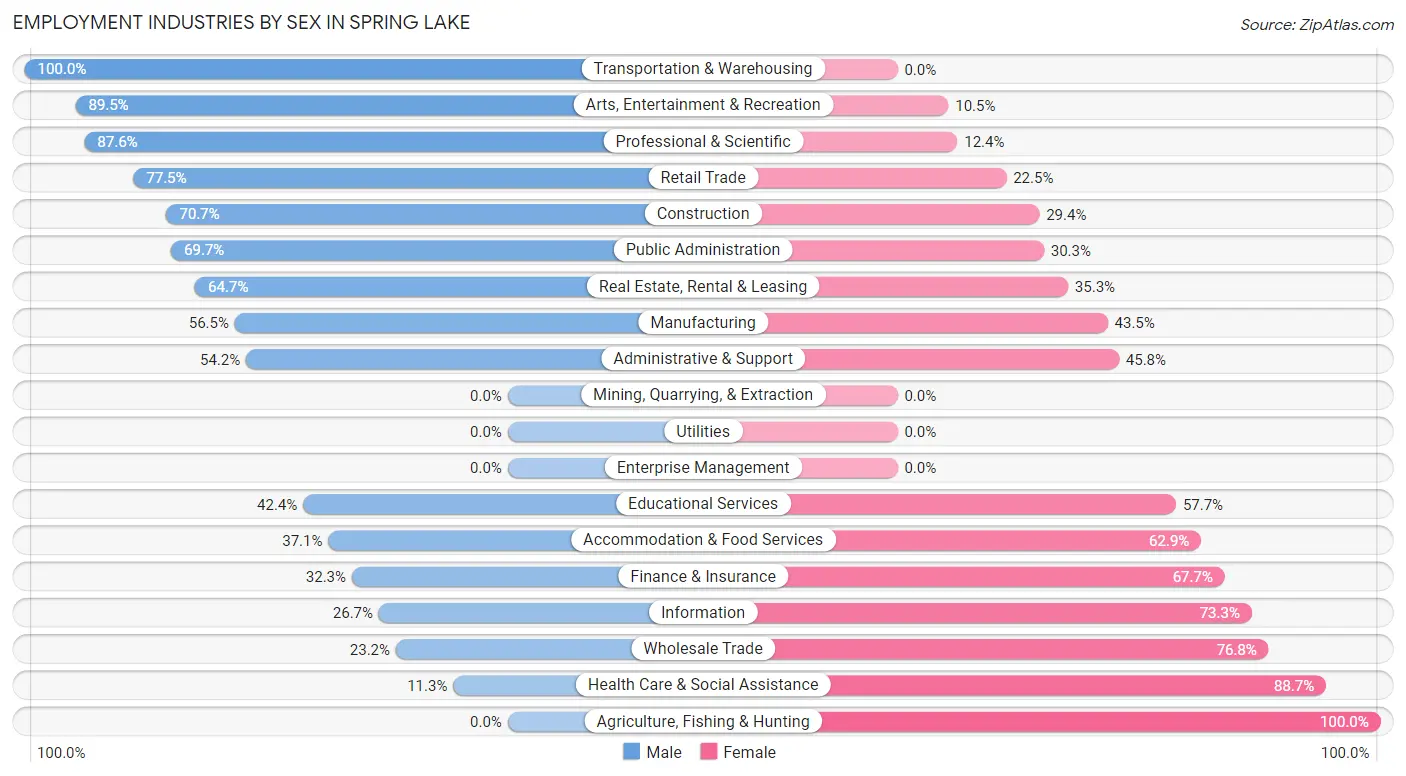
Employment Industries by Sex in Spring Lake
The Spring Lake industries that see more men than women are Transportation & Warehousing (100.0%), Arts, Entertainment & Recreation (89.5%), and Professional & Scientific (87.6%), whereas the industries that tend to have a higher number of women are Agriculture, Fishing & Hunting (100.0%), Health Care & Social Assistance (88.7%), and Wholesale Trade (76.8%).
| Industry | Male | Female |
| Agriculture, Fishing & Hunting | 0 (0.0%) | 1 (100.0%) |
| Mining, Quarrying, & Extraction | 0 (0.0%) | 0 (0.0%) |
| Construction | 65 (70.7%) | 27 (29.3%) |
| Manufacturing | 148 (56.5%) | 114 (43.5%) |
| Wholesale Trade | 22 (23.2%) | 73 (76.8%) |
| Retail Trade | 86 (77.5%) | 25 (22.5%) |
| Transportation & Warehousing | 22 (100.0%) | 0 (0.0%) |
| Utilities | 0 (0.0%) | 0 (0.0%) |
| Information | 8 (26.7%) | 22 (73.3%) |
| Finance & Insurance | 20 (32.3%) | 42 (67.7%) |
| Real Estate, Rental & Leasing | 22 (64.7%) | 12 (35.3%) |
| Professional & Scientific | 99 (87.6%) | 14 (12.4%) |
| Enterprise Management | 0 (0.0%) | 0 (0.0%) |
| Administrative & Support | 39 (54.2%) | 33 (45.8%) |
| Educational Services | 36 (42.3%) | 49 (57.7%) |
| Health Care & Social Assistance | 22 (11.3%) | 173 (88.7%) |
| Arts, Entertainment & Recreation | 34 (89.5%) | 4 (10.5%) |
| Accommodation & Food Services | 13 (37.1%) | 22 (62.9%) |
| Public Administration | 23 (69.7%) | 10 (30.3%) |
| Total | 693 (51.7%) | 648 (48.3%) |
Education in Spring Lake
School Enrollment in Spring Lake
The most common levels of schooling among the 372 students in Spring Lake are elementary school (131 | 35.2%), high school (63 | 16.9%), and middle school (52 | 14.0%).
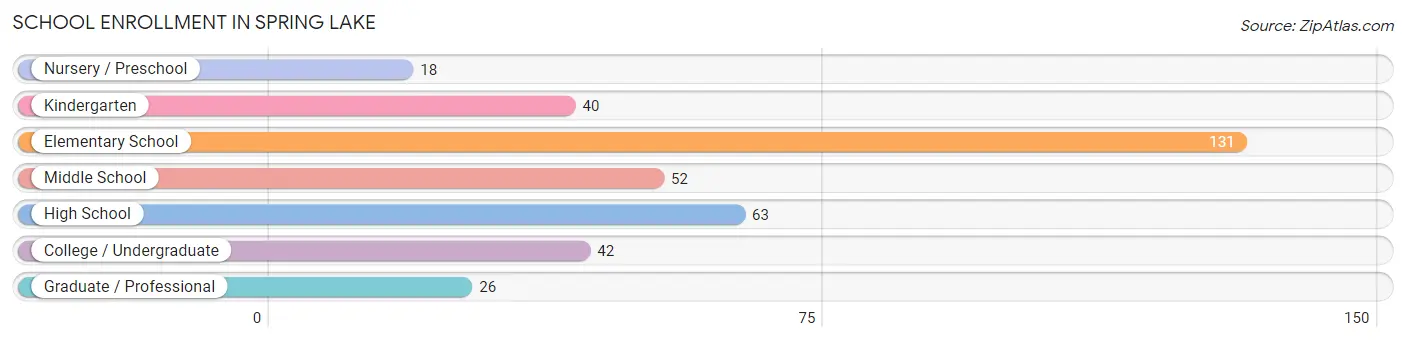
| School Level | # Students | % Students |
| Nursery / Preschool | 18 | 4.8% |
| Kindergarten | 40 | 10.7% |
| Elementary School | 131 | 35.2% |
| Middle School | 52 | 14.0% |
| High School | 63 | 16.9% |
| College / Undergraduate | 42 | 11.3% |
| Graduate / Professional | 26 | 7.0% |
| Total | 372 | 100.0% |
School Enrollment by Age by Funding Source in Spring Lake
Out of a total of 372 students who are enrolled in schools in Spring Lake, 67 (18.0%) attend a private institution, while the remaining 305 (82.0%) are enrolled in public schools. The age group of 35 years and over has the highest likelihood of being enrolled in private schools, with 16 (44.4% in the age bracket) enrolled. Conversely, the age group of 20 to 24 year olds has the lowest likelihood of being enrolled in a private school, with 7 (100.0% in the age bracket) attending a public institution.
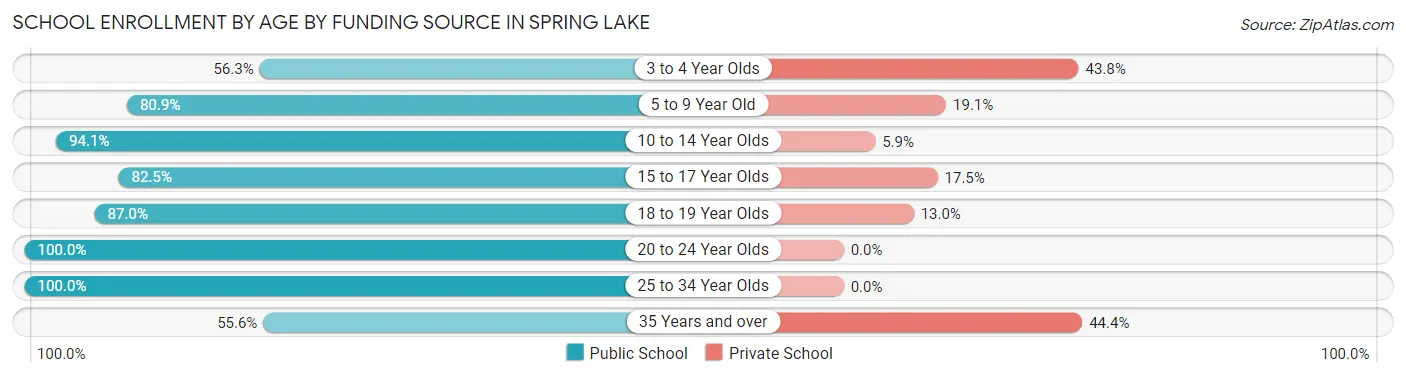
| Age Bracket | Public School | Private School |
| 3 to 4 Year Olds | 9 (56.2%) | 7 (43.8%) |
| 5 to 9 Year Old | 123 (80.9%) | 29 (19.1%) |
| 10 to 14 Year Olds | 80 (94.1%) | 5 (5.9%) |
| 15 to 17 Year Olds | 33 (82.5%) | 7 (17.5%) |
| 18 to 19 Year Olds | 20 (87.0%) | 3 (13.0%) |
| 20 to 24 Year Olds | 7 (100.0%) | 0 (0.0%) |
| 25 to 34 Year Olds | 13 (100.0%) | 0 (0.0%) |
| 35 Years and over | 20 (55.6%) | 16 (44.4%) |
| Total | 305 (82.0%) | 67 (18.0%) |
Educational Attainment by Field of Study in Spring Lake
Business (162 | 16.8%), education (152 | 15.8%), science & technology (125 | 13.0%), engineering (76 | 7.9%), and computers & mathematics (71 | 7.4%) are the most common fields of study among 963 individuals in Spring Lake who have obtained a bachelor's degree or higher.
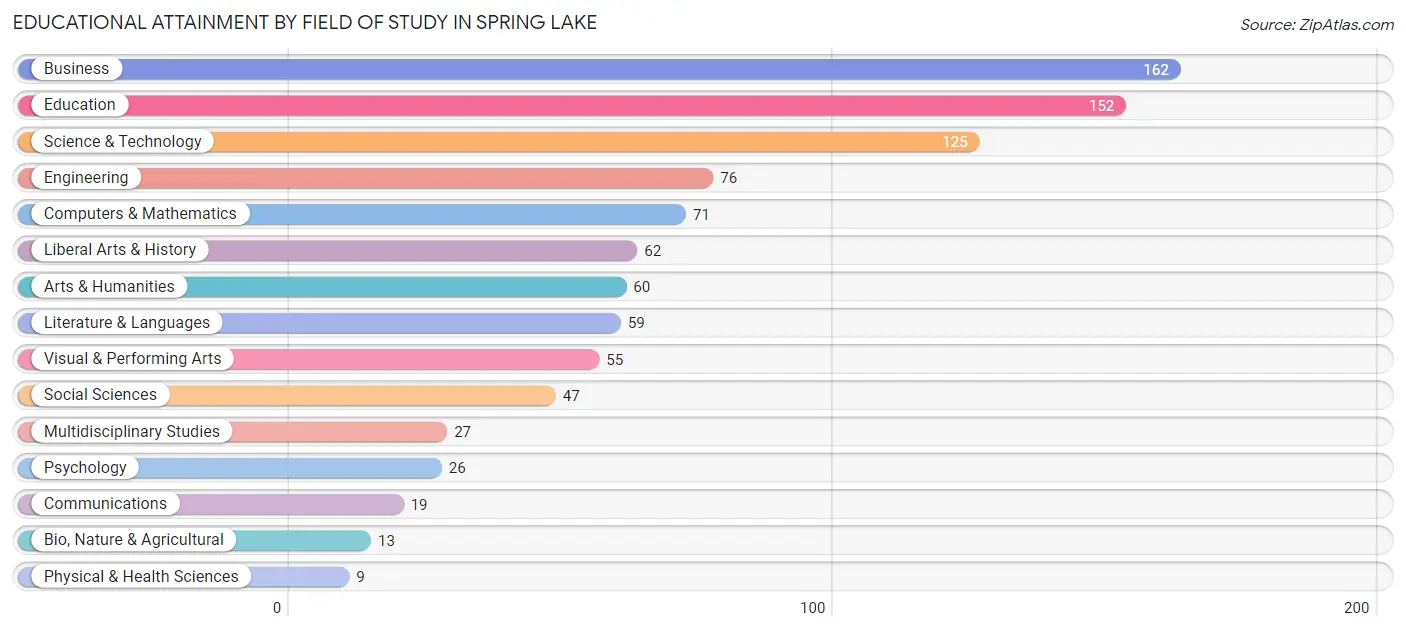
| Field of Study | # Graduates | % Graduates |
| Computers & Mathematics | 71 | 7.4% |
| Bio, Nature & Agricultural | 13 | 1.3% |
| Physical & Health Sciences | 9 | 0.9% |
| Psychology | 26 | 2.7% |
| Social Sciences | 47 | 4.9% |
| Engineering | 76 | 7.9% |
| Multidisciplinary Studies | 27 | 2.8% |
| Science & Technology | 125 | 13.0% |
| Business | 162 | 16.8% |
| Education | 152 | 15.8% |
| Literature & Languages | 59 | 6.1% |
| Liberal Arts & History | 62 | 6.4% |
| Visual & Performing Arts | 55 | 5.7% |
| Communications | 19 | 2.0% |
| Arts & Humanities | 60 | 6.2% |
| Total | 963 | 100.0% |
Transportation & Commute in Spring Lake
Vehicle Availability by Sex in Spring Lake
The most prevalent vehicle ownership categories in Spring Lake are males with 2 vehicles (386, accounting for 59.7%) and females with 2 vehicles (283, making up 61.7%).
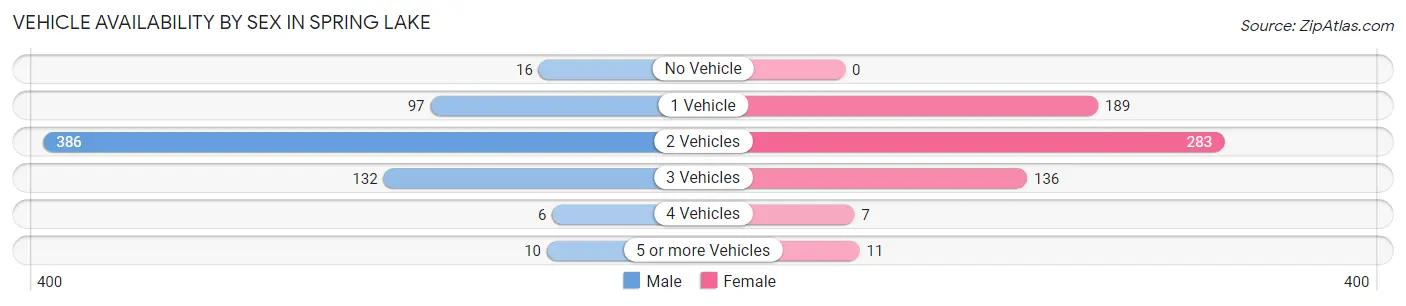
| Vehicles Available | Male | Female |
| No Vehicle | 16 (2.5%) | 0 (0.0%) |
| 1 Vehicle | 97 (15.0%) | 189 (30.2%) |
| 2 Vehicles | 386 (59.7%) | 283 (45.2%) |
| 3 Vehicles | 132 (20.4%) | 136 (21.7%) |
| 4 Vehicles | 6 (0.9%) | 7 (1.1%) |
| 5 or more Vehicles | 10 (1.5%) | 11 (1.8%) |
| Total | 647 (100.0%) | 626 (100.0%) |
Commute Time in Spring Lake
The most frequently occuring commute durations in Spring Lake are 30 to 34 minutes (173 commuters, 16.1%), 10 to 14 minutes (160 commuters, 14.9%), and 5 to 9 minutes (141 commuters, 13.1%).
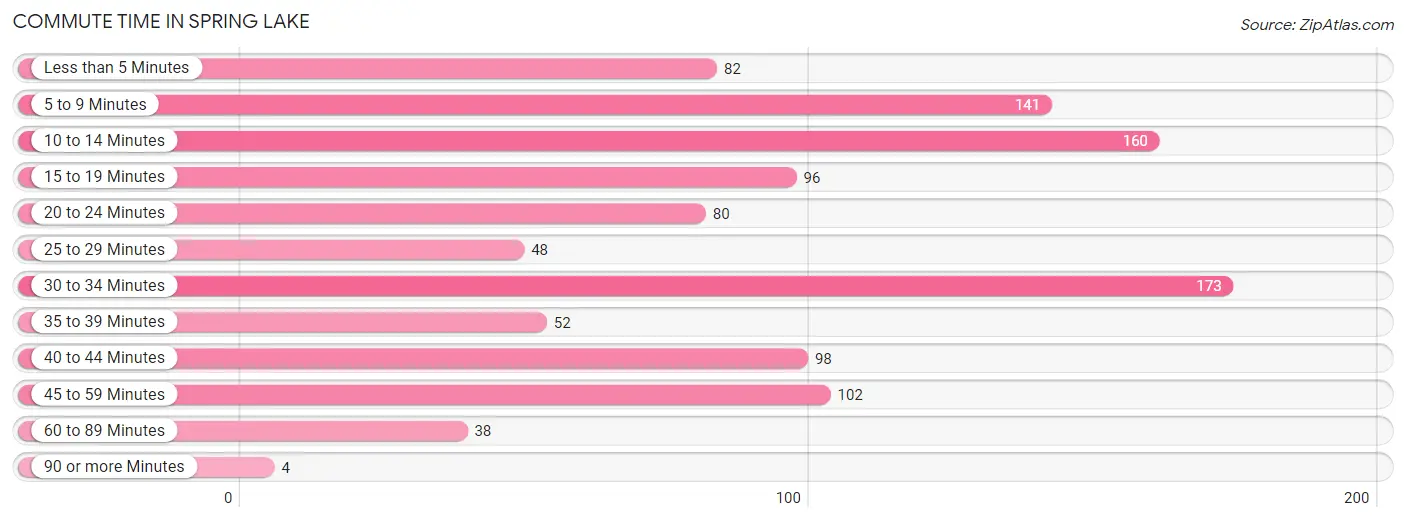
| Commute Time | # Commuters | % Commuters |
| Less than 5 Minutes | 82 | 7.6% |
| 5 to 9 Minutes | 141 | 13.1% |
| 10 to 14 Minutes | 160 | 14.9% |
| 15 to 19 Minutes | 96 | 8.9% |
| 20 to 24 Minutes | 80 | 7.4% |
| 25 to 29 Minutes | 48 | 4.5% |
| 30 to 34 Minutes | 173 | 16.1% |
| 35 to 39 Minutes | 52 | 4.8% |
| 40 to 44 Minutes | 98 | 9.1% |
| 45 to 59 Minutes | 102 | 9.5% |
| 60 to 89 Minutes | 38 | 3.5% |
| 90 or more Minutes | 4 | 0.4% |
Commute Time by Sex in Spring Lake
The most common commute times in Spring Lake are 10 to 14 minutes (85 commuters, 15.7%) for males and 30 to 34 minutes (113 commuters, 21.2%) for females.
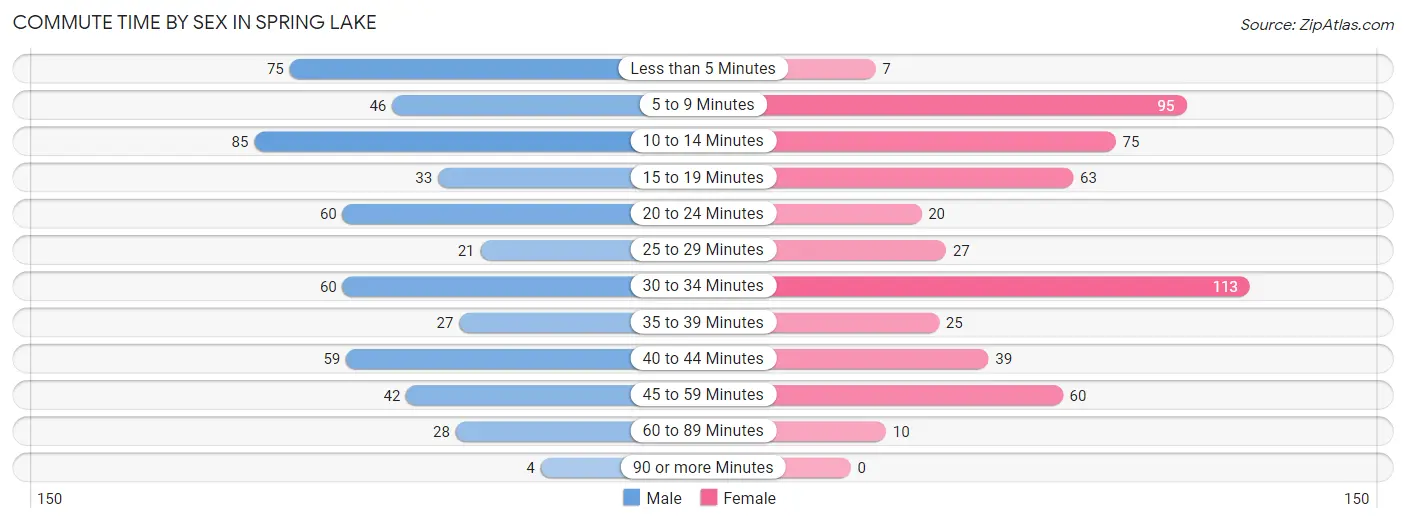
| Commute Time | Male | Female |
| Less than 5 Minutes | 75 (13.9%) | 7 (1.3%) |
| 5 to 9 Minutes | 46 (8.5%) | 95 (17.8%) |
| 10 to 14 Minutes | 85 (15.7%) | 75 (14.0%) |
| 15 to 19 Minutes | 33 (6.1%) | 63 (11.8%) |
| 20 to 24 Minutes | 60 (11.1%) | 20 (3.7%) |
| 25 to 29 Minutes | 21 (3.9%) | 27 (5.1%) |
| 30 to 34 Minutes | 60 (11.1%) | 113 (21.2%) |
| 35 to 39 Minutes | 27 (5.0%) | 25 (4.7%) |
| 40 to 44 Minutes | 59 (10.9%) | 39 (7.3%) |
| 45 to 59 Minutes | 42 (7.8%) | 60 (11.2%) |
| 60 to 89 Minutes | 28 (5.2%) | 10 (1.9%) |
| 90 or more Minutes | 4 (0.7%) | 0 (0.0%) |
Time of Departure to Work by Sex in Spring Lake
The most frequent times of departure to work in Spring Lake are 7:00 AM to 7:29 AM (108, 20.0%) for males and 6:00 AM to 6:29 AM (137, 25.7%) for females.
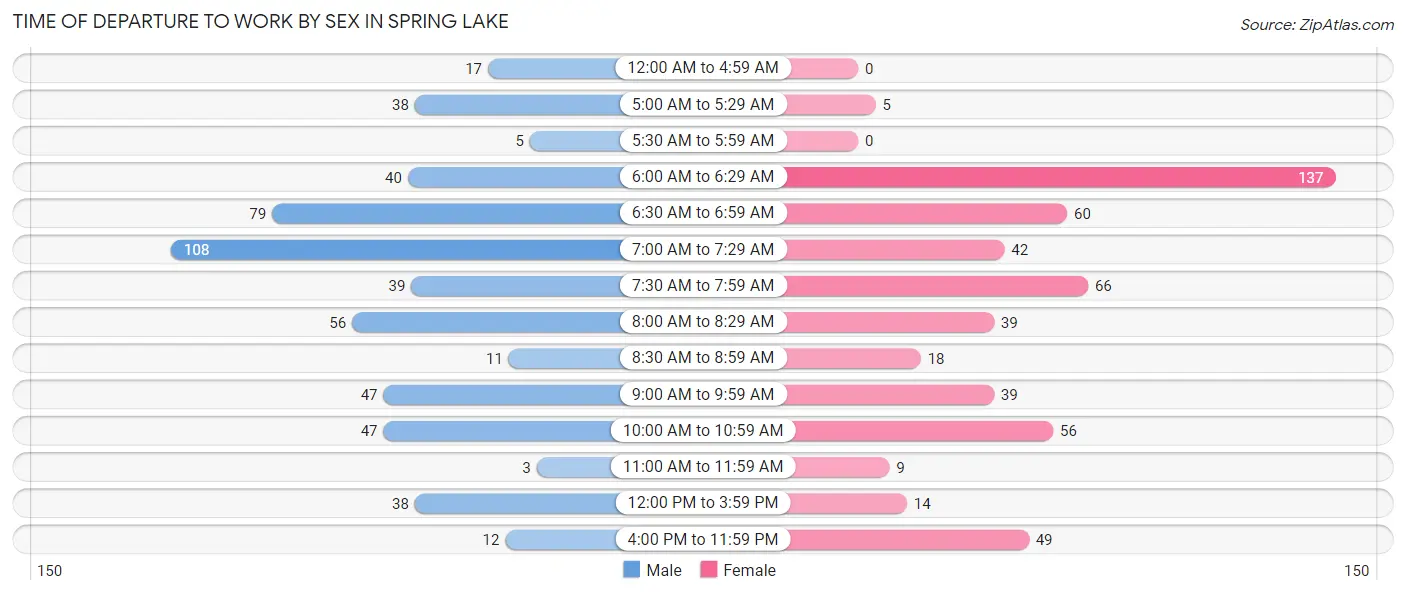
| Time of Departure | Male | Female |
| 12:00 AM to 4:59 AM | 17 (3.2%) | 0 (0.0%) |
| 5:00 AM to 5:29 AM | 38 (7.0%) | 5 (0.9%) |
| 5:30 AM to 5:59 AM | 5 (0.9%) | 0 (0.0%) |
| 6:00 AM to 6:29 AM | 40 (7.4%) | 137 (25.7%) |
| 6:30 AM to 6:59 AM | 79 (14.6%) | 60 (11.2%) |
| 7:00 AM to 7:29 AM | 108 (20.0%) | 42 (7.9%) |
| 7:30 AM to 7:59 AM | 39 (7.2%) | 66 (12.4%) |
| 8:00 AM to 8:29 AM | 56 (10.4%) | 39 (7.3%) |
| 8:30 AM to 8:59 AM | 11 (2.0%) | 18 (3.4%) |
| 9:00 AM to 9:59 AM | 47 (8.7%) | 39 (7.3%) |
| 10:00 AM to 10:59 AM | 47 (8.7%) | 56 (10.5%) |
| 11:00 AM to 11:59 AM | 3 (0.6%) | 9 (1.7%) |
| 12:00 PM to 3:59 PM | 38 (7.0%) | 14 (2.6%) |
| 4:00 PM to 11:59 PM | 12 (2.2%) | 49 (9.2%) |
| Total | 540 (100.0%) | 534 (100.0%) |
Housing Occupancy in Spring Lake
Occupancy by Ownership in Spring Lake
Of the total 1,271 dwellings in Spring Lake, owner-occupied units account for 1,105 (86.9%), while renter-occupied units make up 166 (13.1%).
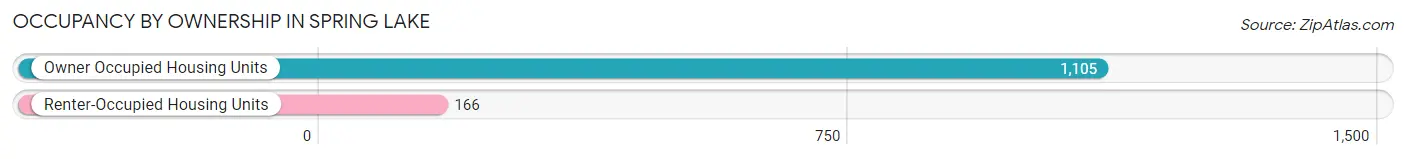
| Occupancy | # Housing Units | % Housing Units |
| Owner Occupied Housing Units | 1,105 | 86.9% |
| Renter-Occupied Housing Units | 166 | 13.1% |
| Total Occupied Housing Units | 1,271 | 100.0% |
Occupancy by Household Size in Spring Lake
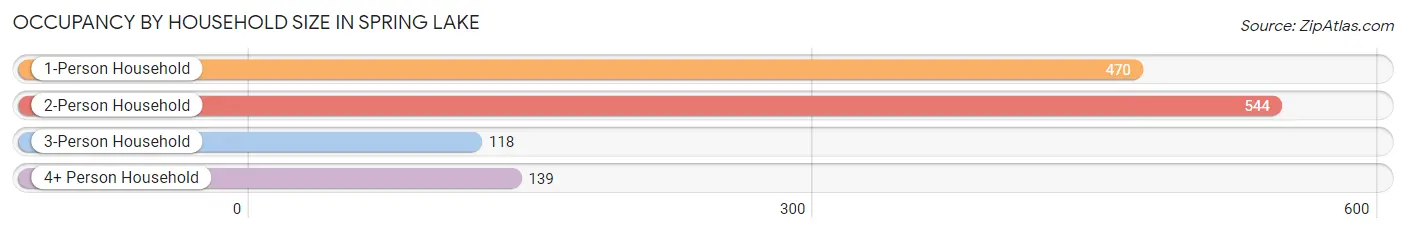
| Household Size | # Housing Units | % Housing Units |
| 1-Person Household | 470 | 37.0% |
| 2-Person Household | 544 | 42.8% |
| 3-Person Household | 118 | 9.3% |
| 4+ Person Household | 139 | 10.9% |
| Total Housing Units | 1,271 | 100.0% |
Occupancy by Ownership by Household Size in Spring Lake
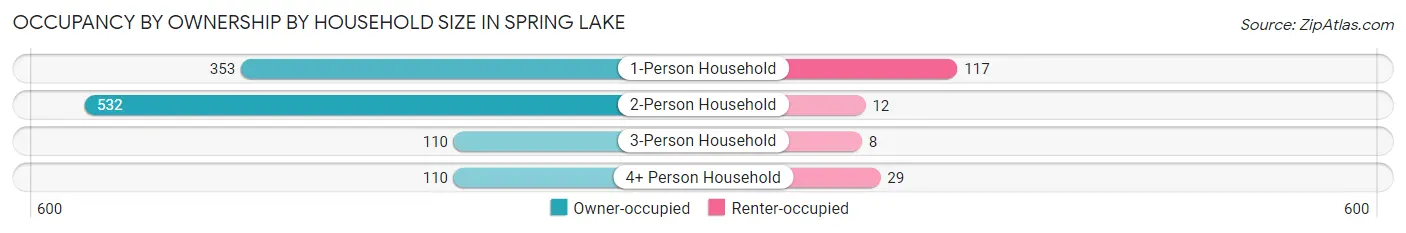
| Household Size | Owner-occupied | Renter-occupied |
| 1-Person Household | 353 (75.1%) | 117 (24.9%) |
| 2-Person Household | 532 (97.8%) | 12 (2.2%) |
| 3-Person Household | 110 (93.2%) | 8 (6.8%) |
| 4+ Person Household | 110 (79.1%) | 29 (20.9%) |
| Total Housing Units | 1,105 (86.9%) | 166 (13.1%) |
Occupancy by Educational Attainment in Spring Lake
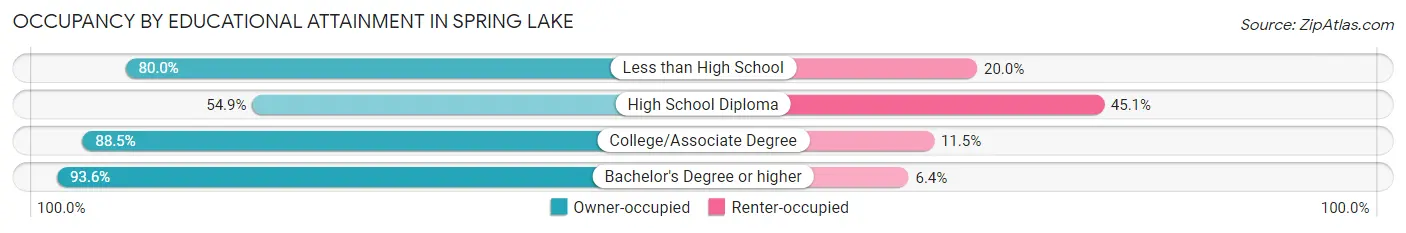
| Household Size | Owner-occupied | Renter-occupied |
| Less than High School | 8 (80.0%) | 2 (20.0%) |
| High School Diploma | 79 (54.9%) | 65 (45.1%) |
| College/Associate Degree | 479 (88.5%) | 62 (11.5%) |
| Bachelor's Degree or higher | 539 (93.6%) | 37 (6.4%) |
Occupancy by Age of Householder in Spring Lake
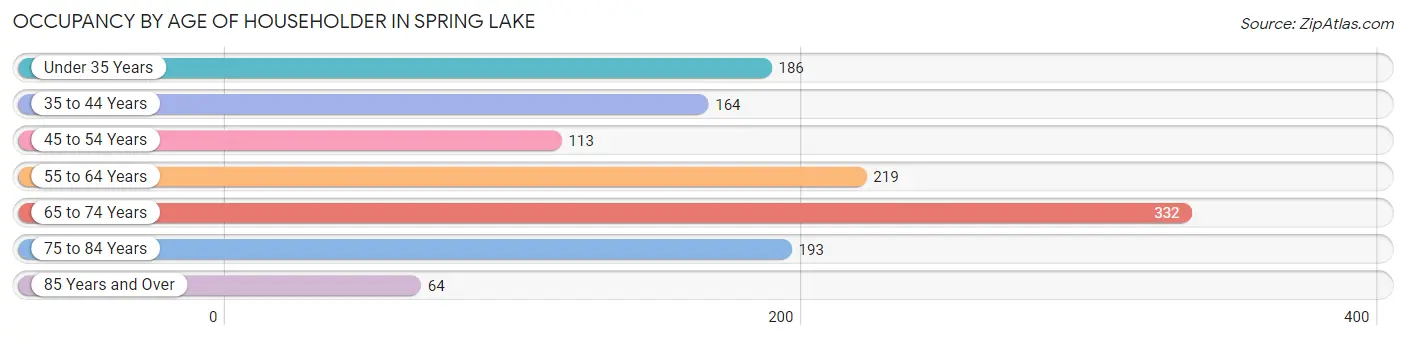
| Age Bracket | # Households | % Households |
| Under 35 Years | 186 | 14.6% |
| 35 to 44 Years | 164 | 12.9% |
| 45 to 54 Years | 113 | 8.9% |
| 55 to 64 Years | 219 | 17.2% |
| 65 to 74 Years | 332 | 26.1% |
| 75 to 84 Years | 193 | 15.2% |
| 85 Years and Over | 64 | 5.0% |
| Total | 1,271 | 100.0% |
Housing Finances in Spring Lake
Median Income by Occupancy in Spring Lake
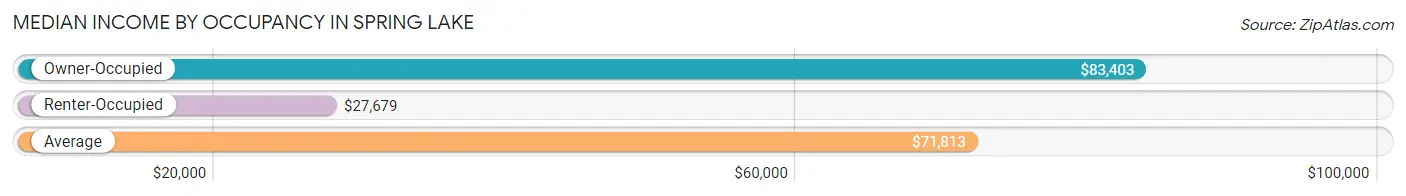
| Occupancy Type | # Households | Median Income |
| Owner-Occupied | 1,105 (86.9%) | $83,403 |
| Renter-Occupied | 166 (13.1%) | $27,679 |
| Average | 1,271 (100.0%) | $71,813 |
Occupancy by Householder Income Bracket in Spring Lake
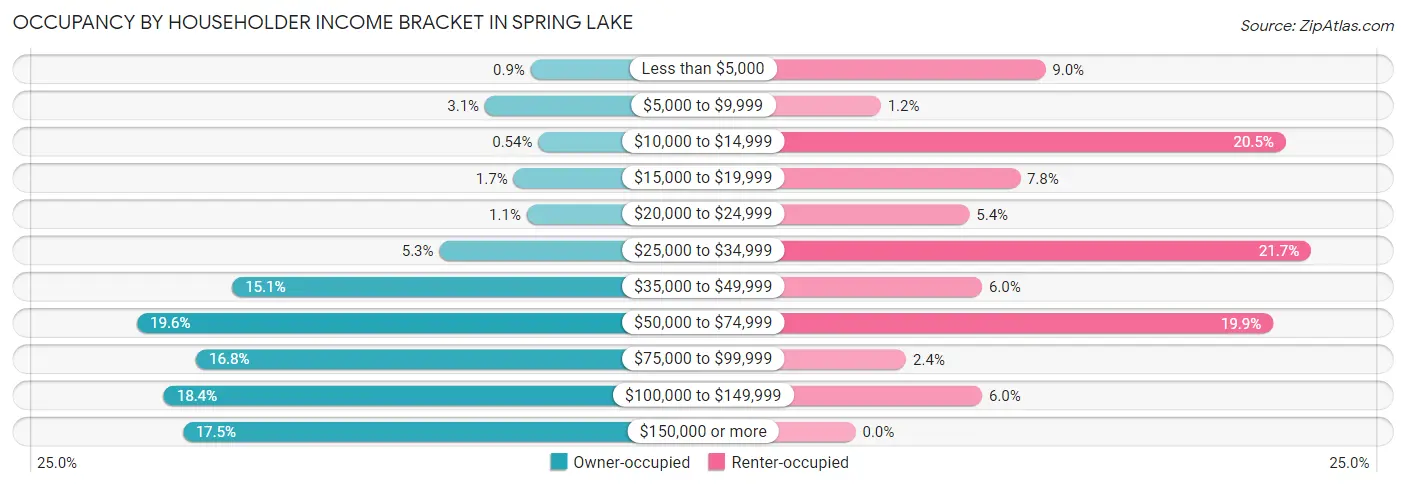
| Income Bracket | Owner-occupied | Renter-occupied |
| Less than $5,000 | 10 (0.9%) | 15 (9.0%) |
| $5,000 to $9,999 | 34 (3.1%) | 2 (1.2%) |
| $10,000 to $14,999 | 6 (0.5%) | 34 (20.5%) |
| $15,000 to $19,999 | 19 (1.7%) | 13 (7.8%) |
| $20,000 to $24,999 | 12 (1.1%) | 9 (5.4%) |
| $25,000 to $34,999 | 58 (5.2%) | 36 (21.7%) |
| $35,000 to $49,999 | 167 (15.1%) | 10 (6.0%) |
| $50,000 to $74,999 | 217 (19.6%) | 33 (19.9%) |
| $75,000 to $99,999 | 186 (16.8%) | 4 (2.4%) |
| $100,000 to $149,999 | 203 (18.4%) | 10 (6.0%) |
| $150,000 or more | 193 (17.5%) | 0 (0.0%) |
| Total | 1,105 (100.0%) | 166 (100.0%) |
Monthly Housing Cost Tiers in Spring Lake
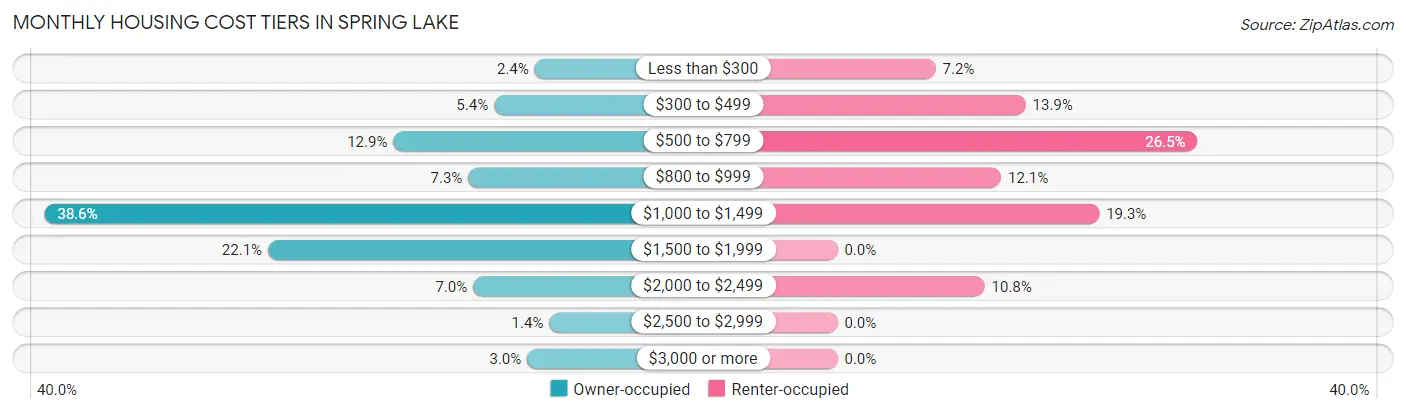
| Monthly Cost | Owner-occupied | Renter-occupied |
| Less than $300 | 27 (2.4%) | 12 (7.2%) |
| $300 to $499 | 60 (5.4%) | 23 (13.9%) |
| $500 to $799 | 142 (12.9%) | 44 (26.5%) |
| $800 to $999 | 81 (7.3%) | 20 (12.0%) |
| $1,000 to $1,499 | 426 (38.6%) | 32 (19.3%) |
| $1,500 to $1,999 | 244 (22.1%) | 0 (0.0%) |
| $2,000 to $2,499 | 77 (7.0%) | 18 (10.8%) |
| $2,500 to $2,999 | 15 (1.4%) | 0 (0.0%) |
| $3,000 or more | 33 (3.0%) | 0 (0.0%) |
| Total | 1,105 (100.0%) | 166 (100.0%) |
Physical Housing Characteristics in Spring Lake
Housing Structures in Spring Lake
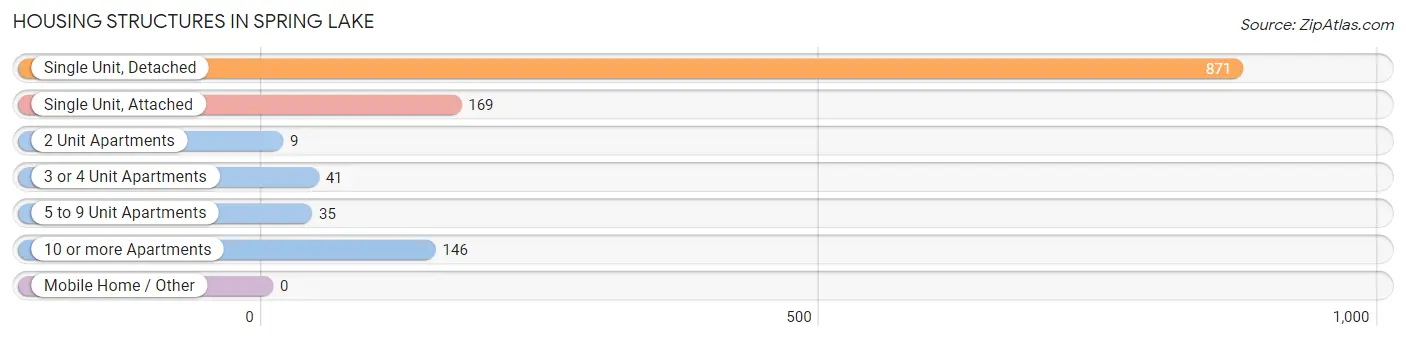
| Structure Type | # Housing Units | % Housing Units |
| Single Unit, Detached | 871 | 68.5% |
| Single Unit, Attached | 169 | 13.3% |
| 2 Unit Apartments | 9 | 0.7% |
| 3 or 4 Unit Apartments | 41 | 3.2% |
| 5 to 9 Unit Apartments | 35 | 2.8% |
| 10 or more Apartments | 146 | 11.5% |
| Mobile Home / Other | 0 | 0.0% |
| Total | 1,271 | 100.0% |
Housing Structures by Occupancy in Spring Lake
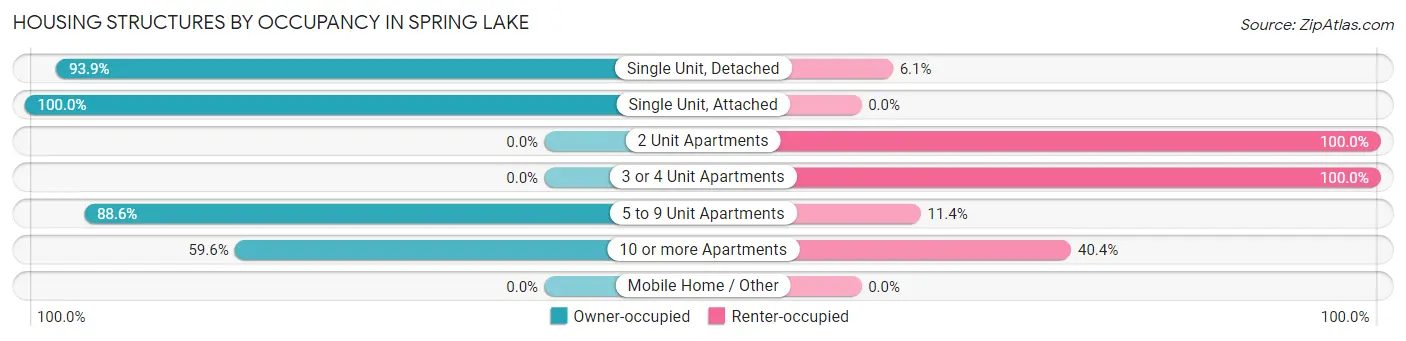
| Structure Type | Owner-occupied | Renter-occupied |
| Single Unit, Detached | 818 (93.9%) | 53 (6.1%) |
| Single Unit, Attached | 169 (100.0%) | 0 (0.0%) |
| 2 Unit Apartments | 0 (0.0%) | 9 (100.0%) |
| 3 or 4 Unit Apartments | 0 (0.0%) | 41 (100.0%) |
| 5 to 9 Unit Apartments | 31 (88.6%) | 4 (11.4%) |
| 10 or more Apartments | 87 (59.6%) | 59 (40.4%) |
| Mobile Home / Other | 0 (0.0%) | 0 (0.0%) |
| Total | 1,105 (86.9%) | 166 (13.1%) |
Housing Structures by Number of Rooms in Spring Lake
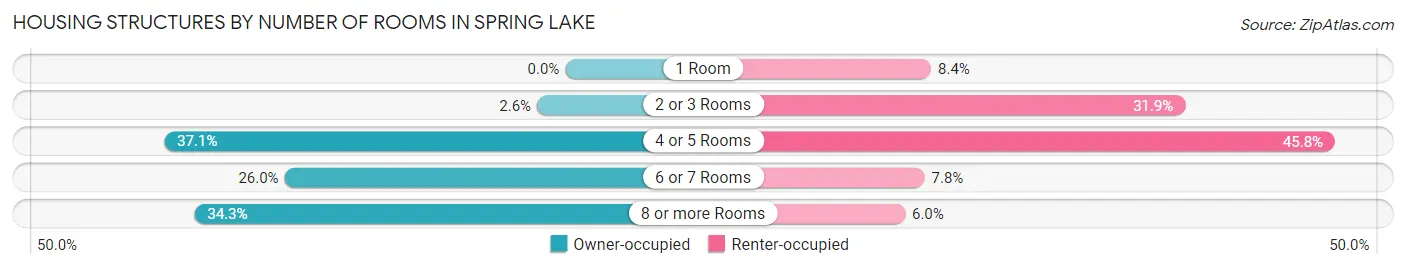
| Number of Rooms | Owner-occupied | Renter-occupied |
| 1 Room | 0 (0.0%) | 14 (8.4%) |
| 2 or 3 Rooms | 29 (2.6%) | 53 (31.9%) |
| 4 or 5 Rooms | 410 (37.1%) | 76 (45.8%) |
| 6 or 7 Rooms | 287 (26.0%) | 13 (7.8%) |
| 8 or more Rooms | 379 (34.3%) | 10 (6.0%) |
| Total | 1,105 (100.0%) | 166 (100.0%) |
Housing Structure by Heating Type in Spring Lake
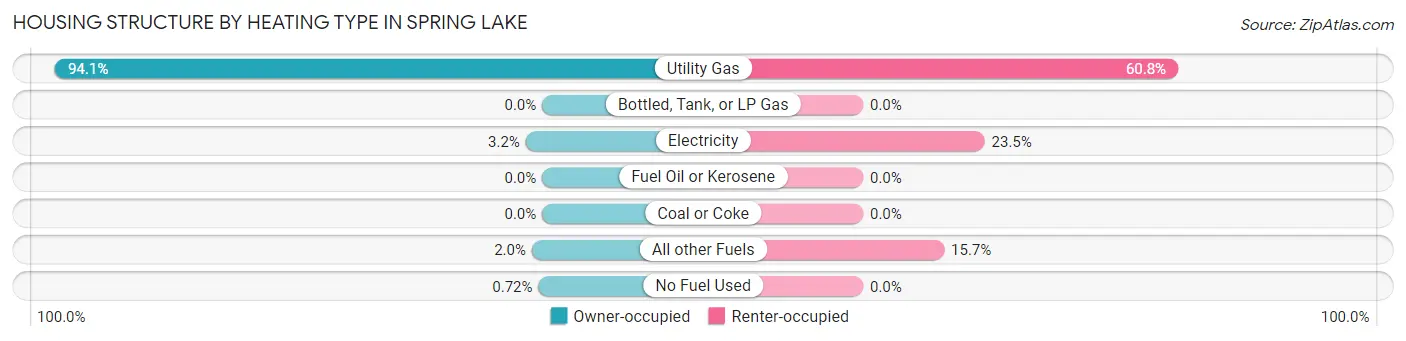
| Heating Type | Owner-occupied | Renter-occupied |
| Utility Gas | 1,040 (94.1%) | 101 (60.8%) |
| Bottled, Tank, or LP Gas | 0 (0.0%) | 0 (0.0%) |
| Electricity | 35 (3.2%) | 39 (23.5%) |
| Fuel Oil or Kerosene | 0 (0.0%) | 0 (0.0%) |
| Coal or Coke | 0 (0.0%) | 0 (0.0%) |
| All other Fuels | 22 (2.0%) | 26 (15.7%) |
| No Fuel Used | 8 (0.7%) | 0 (0.0%) |
| Total | 1,105 (100.0%) | 166 (100.0%) |
Household Vehicle Usage in Spring Lake
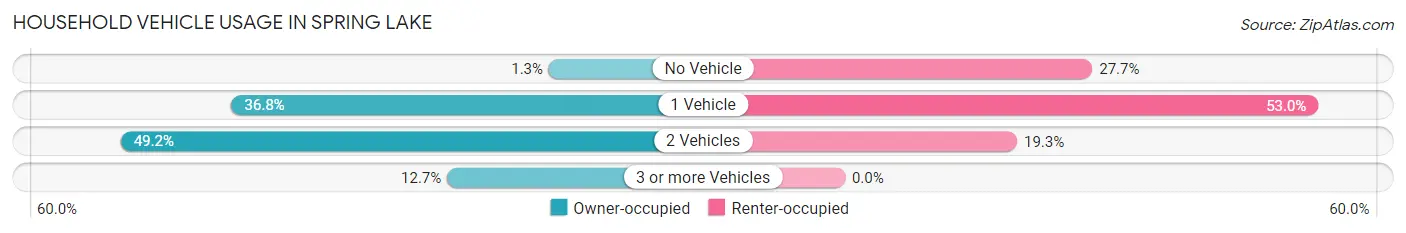
| Vehicles per Household | Owner-occupied | Renter-occupied |
| No Vehicle | 14 (1.3%) | 46 (27.7%) |
| 1 Vehicle | 407 (36.8%) | 88 (53.0%) |
| 2 Vehicles | 544 (49.2%) | 32 (19.3%) |
| 3 or more Vehicles | 140 (12.7%) | 0 (0.0%) |
| Total | 1,105 (100.0%) | 166 (100.0%) |
Real Estate & Mortgages in Spring Lake
Real Estate and Mortgage Overview in Spring Lake
| Characteristic | Without Mortgage | With Mortgage |
| Housing Units | 342 | 763 |
| Median Property Value | $261,100 | $264,400 |
| Median Household Income | $67,639 | $143 |
| Monthly Housing Costs | $681 | $33 |
| Real Estate Taxes | $3,717 | $0 |
Property Value by Mortgage Status in Spring Lake
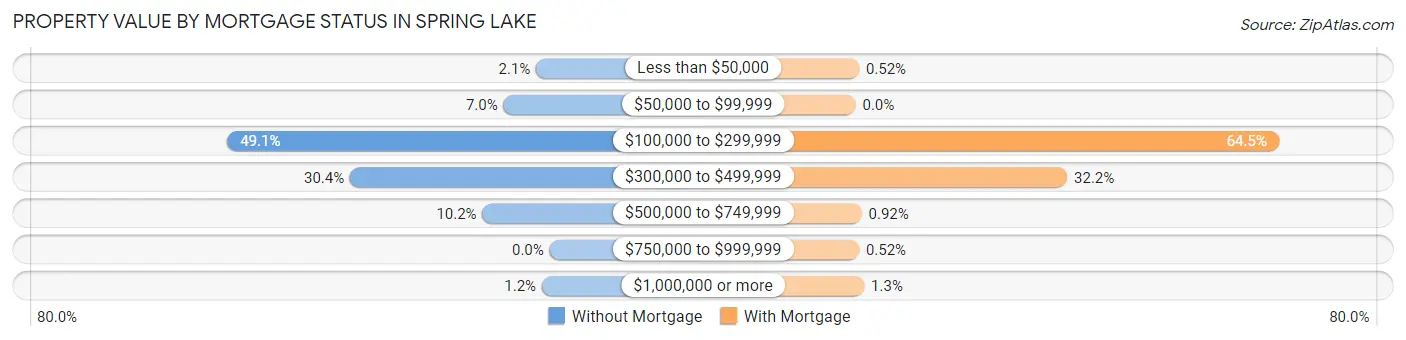
| Property Value | Without Mortgage | With Mortgage |
| Less than $50,000 | 7 (2.1%) | 4 (0.5%) |
| $50,000 to $99,999 | 24 (7.0%) | 0 (0.0%) |
| $100,000 to $299,999 | 168 (49.1%) | 492 (64.5%) |
| $300,000 to $499,999 | 104 (30.4%) | 246 (32.2%) |
| $500,000 to $749,999 | 35 (10.2%) | 7 (0.9%) |
| $750,000 to $999,999 | 0 (0.0%) | 4 (0.5%) |
| $1,000,000 or more | 4 (1.2%) | 10 (1.3%) |
| Total | 342 (100.0%) | 763 (100.0%) |
Household Income by Mortgage Status in Spring Lake
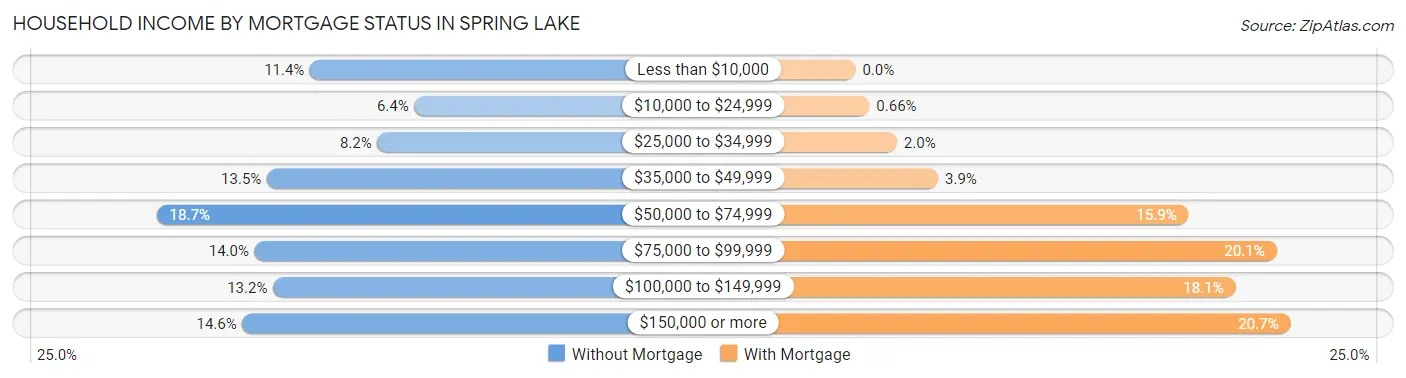
| Household Income | Without Mortgage | With Mortgage |
| Less than $10,000 | 39 (11.4%) | 0 (0.0%) |
| $10,000 to $24,999 | 22 (6.4%) | 5 (0.7%) |
| $25,000 to $34,999 | 28 (8.2%) | 15 (2.0%) |
| $35,000 to $49,999 | 46 (13.5%) | 30 (3.9%) |
| $50,000 to $74,999 | 64 (18.7%) | 121 (15.9%) |
| $75,000 to $99,999 | 48 (14.0%) | 153 (20.1%) |
| $100,000 to $149,999 | 45 (13.2%) | 138 (18.1%) |
| $150,000 or more | 50 (14.6%) | 158 (20.7%) |
| Total | 342 (100.0%) | 763 (100.0%) |
Property Value to Household Income Ratio in Spring Lake
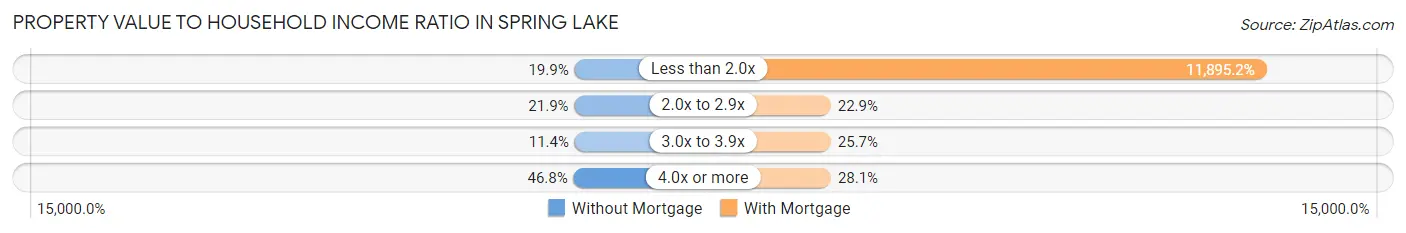
| Value-to-Income Ratio | Without Mortgage | With Mortgage |
| Less than 2.0x | 68 (19.9%) | 90,760 (11,895.1%) |
| 2.0x to 2.9x | 75 (21.9%) | 175 (22.9%) |
| 3.0x to 3.9x | 39 (11.4%) | 196 (25.7%) |
| 4.0x or more | 160 (46.8%) | 214 (28.1%) |
| Total | 342 (100.0%) | 763 (100.0%) |
Real Estate Taxes by Mortgage Status in Spring Lake
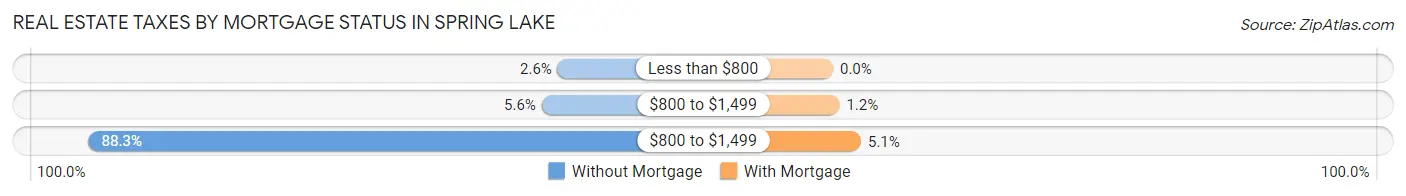
| Property Taxes | Without Mortgage | With Mortgage |
| Less than $800 | 9 (2.6%) | 0 (0.0%) |
| $800 to $1,499 | 19 (5.6%) | 9 (1.2%) |
| $800 to $1,499 | 302 (88.3%) | 39 (5.1%) |
| Total | 342 (100.0%) | 763 (100.0%) |
Health & Disability in Spring Lake
Health Insurance Coverage by Age in Spring Lake
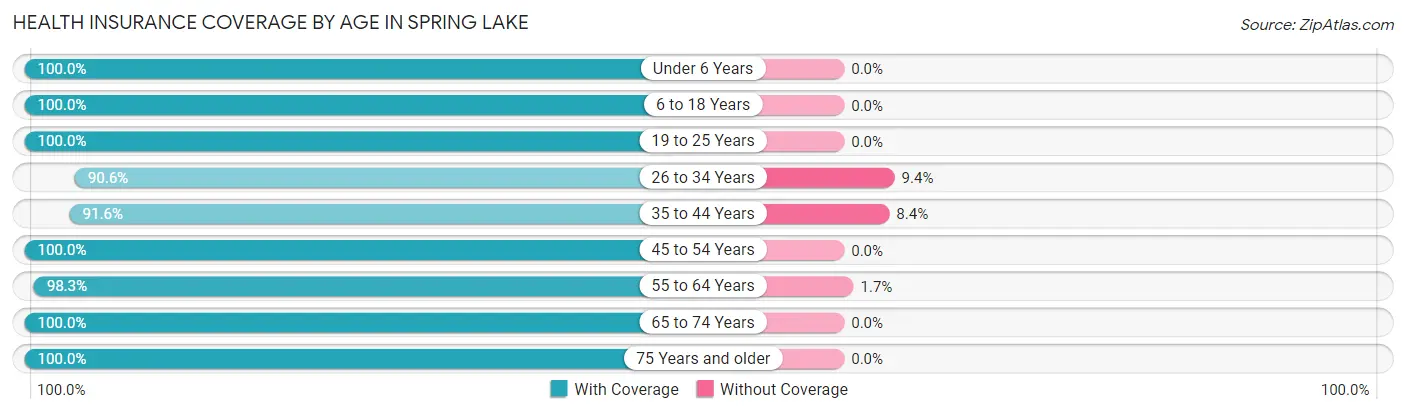
| Age Bracket | With Coverage | Without Coverage |
| Under 6 Years | 128 (100.0%) | 0 (0.0%) |
| 6 to 18 Years | 276 (100.0%) | 0 (0.0%) |
| 19 to 25 Years | 129 (100.0%) | 0 (0.0%) |
| 26 to 34 Years | 222 (90.6%) | 23 (9.4%) |
| 35 to 44 Years | 283 (91.6%) | 26 (8.4%) |
| 45 to 54 Years | 177 (100.0%) | 0 (0.0%) |
| 55 to 64 Years | 454 (98.3%) | 8 (1.7%) |
| 65 to 74 Years | 487 (100.0%) | 0 (0.0%) |
| 75 Years and older | 312 (100.0%) | 0 (0.0%) |
| Total | 2,468 (97.7%) | 57 (2.3%) |
Health Insurance Coverage by Citizenship Status in Spring Lake
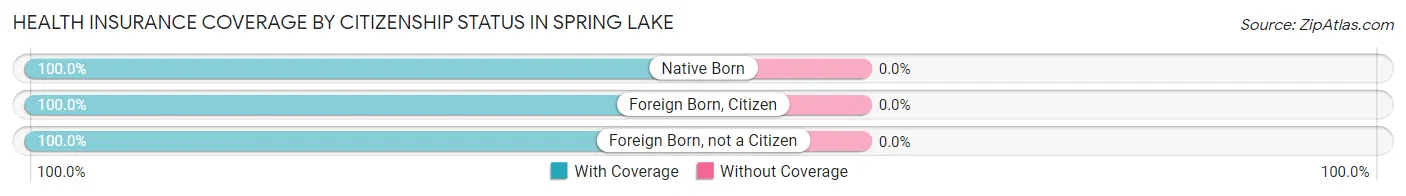
| Citizenship Status | With Coverage | Without Coverage |
| Native Born | 128 (100.0%) | 0 (0.0%) |
| Foreign Born, Citizen | 276 (100.0%) | 0 (0.0%) |
| Foreign Born, not a Citizen | 129 (100.0%) | 0 (0.0%) |
Health Insurance Coverage by Household Income in Spring Lake
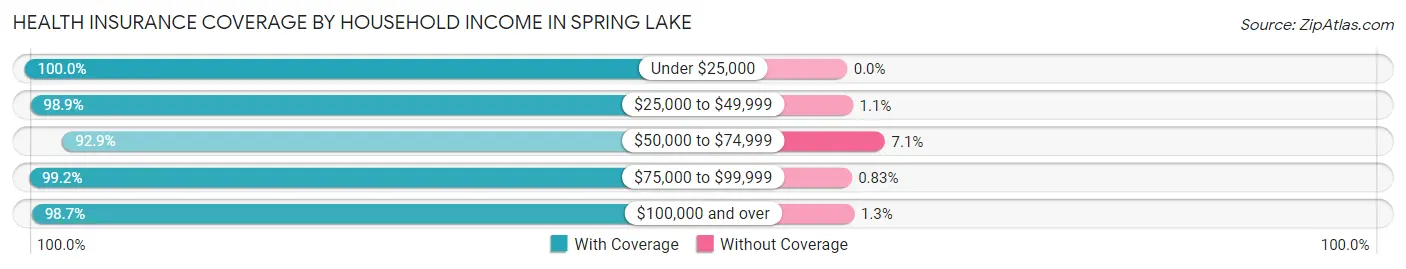
| Household Income | With Coverage | Without Coverage |
| Under $25,000 | 170 (100.0%) | 0 (0.0%) |
| $25,000 to $49,999 | 456 (98.9%) | 5 (1.1%) |
| $50,000 to $74,999 | 446 (92.9%) | 34 (7.1%) |
| $75,000 to $99,999 | 358 (99.2%) | 3 (0.8%) |
| $100,000 and over | 1,031 (98.7%) | 14 (1.3%) |
Public vs Private Health Insurance Coverage by Age in Spring Lake
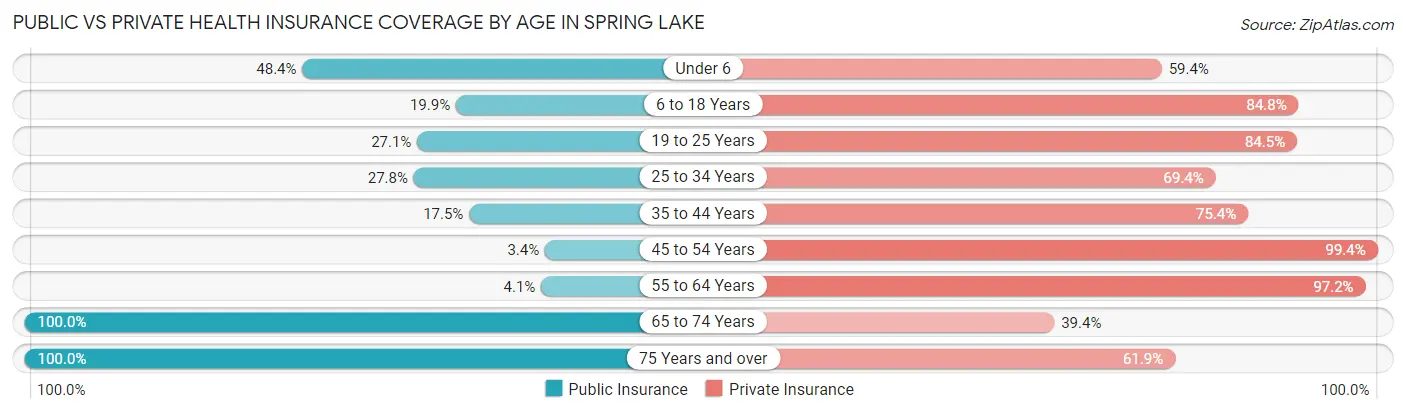
| Age Bracket | Public Insurance | Private Insurance |
| Under 6 | 62 (48.4%) | 76 (59.4%) |
| 6 to 18 Years | 55 (19.9%) | 234 (84.8%) |
| 19 to 25 Years | 35 (27.1%) | 109 (84.5%) |
| 25 to 34 Years | 68 (27.8%) | 170 (69.4%) |
| 35 to 44 Years | 54 (17.5%) | 233 (75.4%) |
| 45 to 54 Years | 6 (3.4%) | 176 (99.4%) |
| 55 to 64 Years | 19 (4.1%) | 449 (97.2%) |
| 65 to 74 Years | 487 (100.0%) | 192 (39.4%) |
| 75 Years and over | 312 (100.0%) | 193 (61.9%) |
| Total | 1,098 (43.5%) | 1,832 (72.6%) |
Disability Status by Sex by Age in Spring Lake
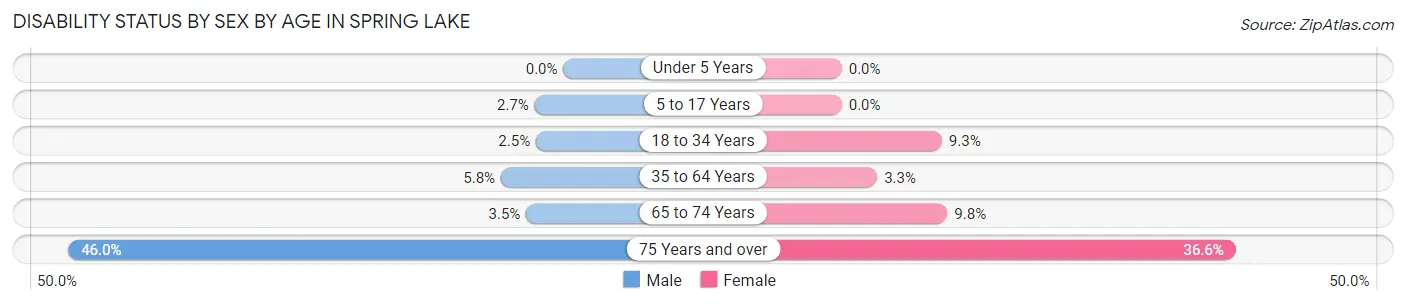
| Age Bracket | Male | Female |
| Under 5 Years | 0 (0.0%) | 0 (0.0%) |
| 5 to 17 Years | 4 (2.7%) | 0 (0.0%) |
| 18 to 34 Years | 5 (2.5%) | 17 (9.3%) |
| 35 to 64 Years | 25 (5.8%) | 17 (3.3%) |
| 65 to 74 Years | 8 (3.5%) | 25 (9.8%) |
| 75 Years and over | 34 (46.0%) | 87 (36.5%) |
Disability Class by Sex by Age in Spring Lake
Disability Class: Hearing Difficulty
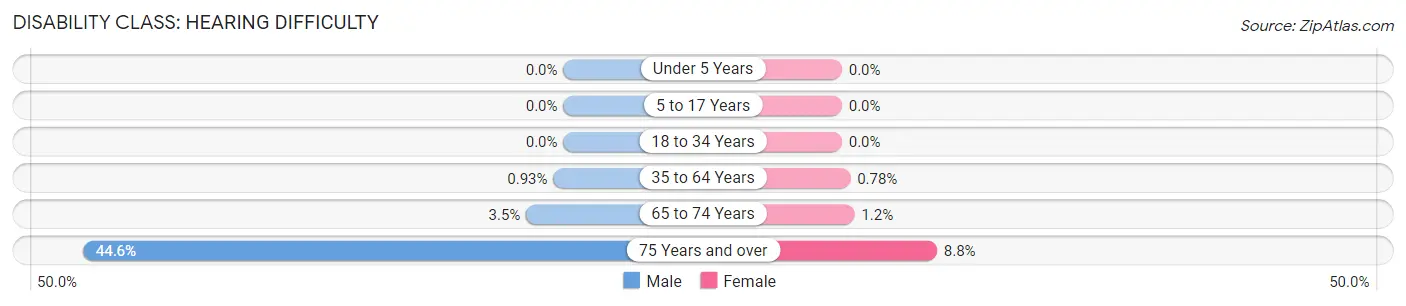
| Age Bracket | Male | Female |
| Under 5 Years | 0 (0.0%) | 0 (0.0%) |
| 5 to 17 Years | 0 (0.0%) | 0 (0.0%) |
| 18 to 34 Years | 0 (0.0%) | 0 (0.0%) |
| 35 to 64 Years | 4 (0.9%) | 4 (0.8%) |
| 65 to 74 Years | 8 (3.5%) | 3 (1.2%) |
| 75 Years and over | 33 (44.6%) | 21 (8.8%) |
Disability Class: Vision Difficulty
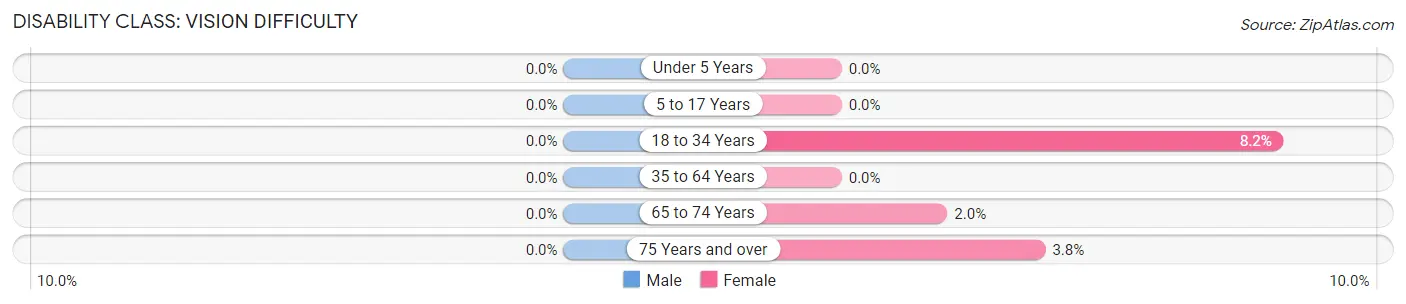
| Age Bracket | Male | Female |
| Under 5 Years | 0 (0.0%) | 0 (0.0%) |
| 5 to 17 Years | 0 (0.0%) | 0 (0.0%) |
| 18 to 34 Years | 0 (0.0%) | 15 (8.2%) |
| 35 to 64 Years | 0 (0.0%) | 0 (0.0%) |
| 65 to 74 Years | 0 (0.0%) | 5 (2.0%) |
| 75 Years and over | 0 (0.0%) | 9 (3.8%) |
Disability Class: Cognitive Difficulty
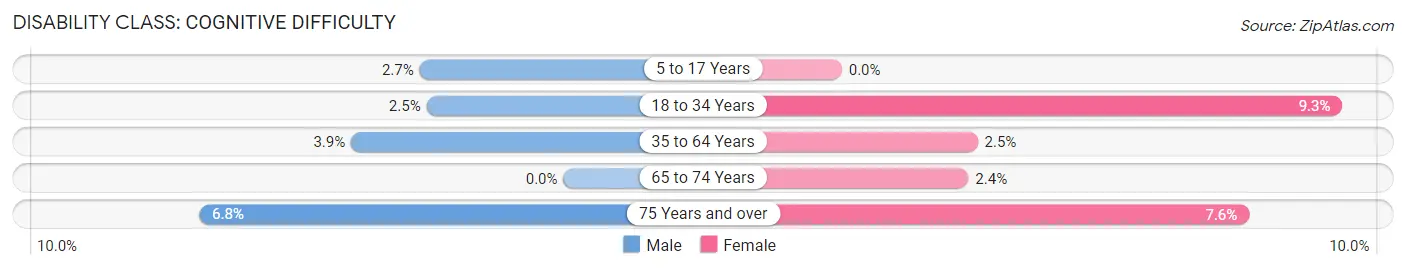
| Age Bracket | Male | Female |
| 5 to 17 Years | 4 (2.7%) | 0 (0.0%) |
| 18 to 34 Years | 5 (2.5%) | 17 (9.3%) |
| 35 to 64 Years | 17 (3.9%) | 13 (2.5%) |
| 65 to 74 Years | 0 (0.0%) | 6 (2.4%) |
| 75 Years and over | 5 (6.8%) | 18 (7.6%) |
Disability Class: Ambulatory Difficulty
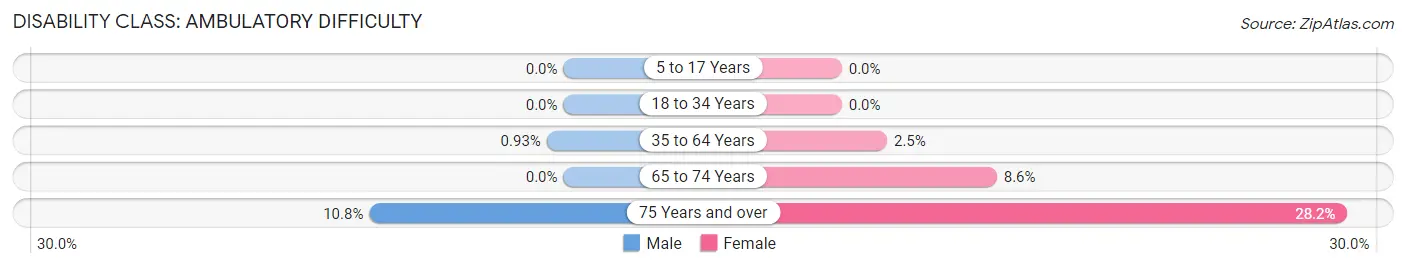
| Age Bracket | Male | Female |
| 5 to 17 Years | 0 (0.0%) | 0 (0.0%) |
| 18 to 34 Years | 0 (0.0%) | 0 (0.0%) |
| 35 to 64 Years | 4 (0.9%) | 13 (2.5%) |
| 65 to 74 Years | 0 (0.0%) | 22 (8.6%) |
| 75 Years and over | 8 (10.8%) | 67 (28.1%) |
Disability Class: Self-Care Difficulty
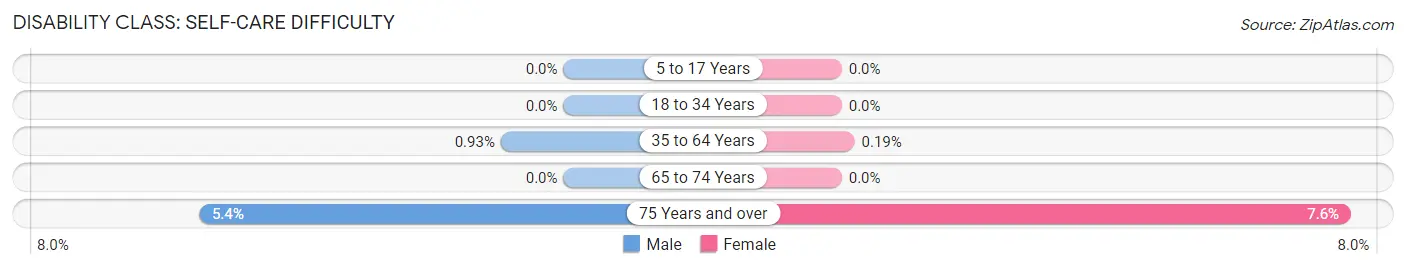
| Age Bracket | Male | Female |
| 5 to 17 Years | 0 (0.0%) | 0 (0.0%) |
| 18 to 34 Years | 0 (0.0%) | 0 (0.0%) |
| 35 to 64 Years | 4 (0.9%) | 1 (0.2%) |
| 65 to 74 Years | 0 (0.0%) | 0 (0.0%) |
| 75 Years and over | 4 (5.4%) | 18 (7.6%) |
Technology Access in Spring Lake
Computing Device Access in Spring Lake
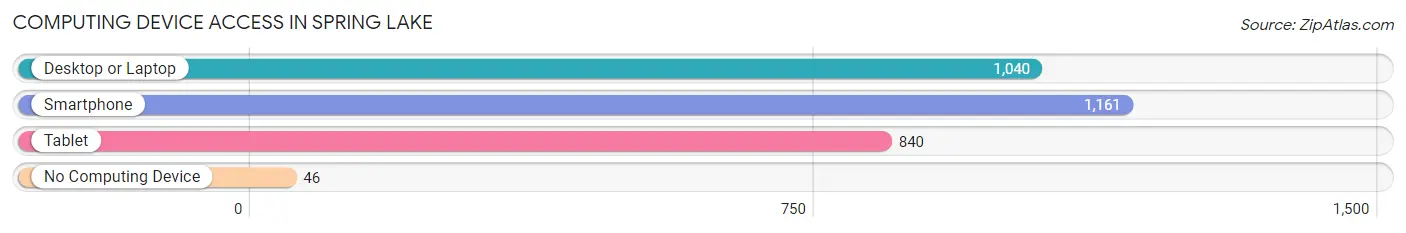
| Device Type | # Households | % Households |
| Desktop or Laptop | 1,040 | 81.8% |
| Smartphone | 1,161 | 91.3% |
| Tablet | 840 | 66.1% |
| No Computing Device | 46 | 3.6% |
| Total | 1,271 | 100.0% |
Internet Access in Spring Lake
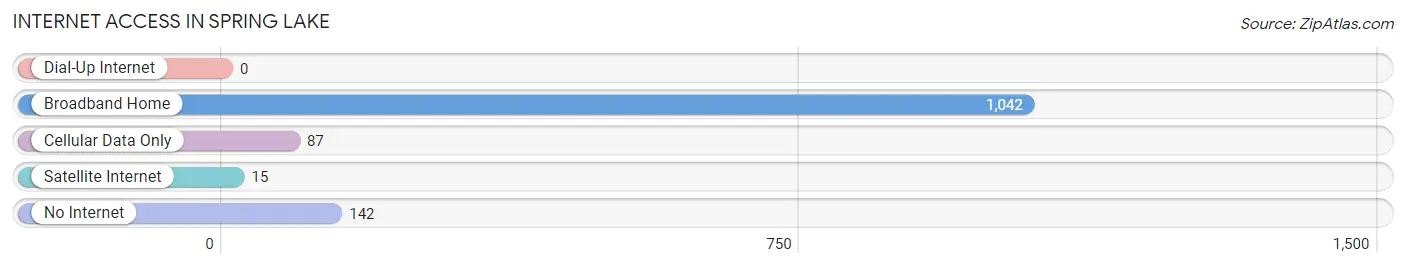
| Internet Type | # Households | % Households |
| Dial-Up Internet | 0 | 0.0% |
| Broadband Home | 1,042 | 82.0% |
| Cellular Data Only | 87 | 6.9% |
| Satellite Internet | 15 | 1.2% |
| No Internet | 142 | 11.2% |
| Total | 1,271 | 100.0% |
Spring Lake Summary
History
Spring Lake, Michigan is a small village located in Ottawa County, Michigan. It is situated on the eastern shore of Spring Lake, a large lake that is part of the Grand River watershed. The village was first settled in 1837 by a group of Dutch immigrants who were looking for a place to settle and farm. The village was originally known as “Vliet”, which is Dutch for “valley”. The name was changed to Spring Lake in 1845 when the first post office was established.
The village was a popular summer destination for wealthy families from Grand Rapids and Detroit. In the late 19th century, the village was home to several large resorts, including the Spring Lake Hotel, which was built in 1887. The hotel was a popular destination for wealthy families from Grand Rapids and Detroit.
The village was incorporated in 1891 and has remained a small, quiet community ever since. The village is home to several historic buildings, including the Spring Lake Inn, which was built in 1892 and is now a bed and breakfast.
Geography
Spring Lake is located in Ottawa County, Michigan, on the eastern shore of Spring Lake. The village is situated on the Grand River watershed, which is the largest watershed in Michigan. The village is bordered by the cities of Grand Haven to the north, Ferrysburg to the east, and Fruitport to the south.
The village is located on the western edge of the Grand River Valley, which is a large, flat area of land that is surrounded by rolling hills and forests. The village is located on the edge of the Grand River, which is the largest river in Michigan. The river is a popular destination for fishing, boating, and other recreational activities.
The village is located in a temperate climate, with warm summers and cold winters. The average temperature in the summer is around 75 degrees Fahrenheit, and the average temperature in the winter is around 25 degrees Fahrenheit.
Economy
The economy of Spring Lake is largely based on tourism and agriculture. The village is home to several resorts and bed and breakfasts, which attract visitors from all over the state and country. The village is also home to several farms, which produce a variety of fruits and vegetables.
The village is also home to several small businesses, including restaurants, retail stores, and professional services. The village is home to several small manufacturing companies, which produce a variety of products, including furniture, clothing, and electronics.
Demographics
As of the 2010 census, the population of Spring Lake was 2,717. The population is largely white (94.3%), with small percentages of African American (2.2%), Asian (1.2%), and Hispanic (1.3%) residents. The median household income is $50,945, and the median age is 43.
The village is home to several churches, including the Spring Lake United Methodist Church, the Spring Lake Presbyterian Church, and the Spring Lake Baptist Church. The village is also home to several schools, including Spring Lake High School, Spring Lake Middle School, and Spring Lake Elementary School.
Conclusion
Spring Lake, Michigan is a small village located in Ottawa County, Michigan. It is situated on the eastern shore of Spring Lake, a large lake that is part of the Grand River watershed. The village was first settled in 1837 by a group of Dutch immigrants who were looking for a place to settle and farm. The village was originally known as “Vliet”, which is Dutch for “valley”. The name was changed to Spring Lake in 1845 when the first post office was established.
The village is located in a temperate climate, with warm summers and cold winters. The economy of Spring Lake is largely based on tourism and agriculture. The village is home to several resorts and bed and breakfasts, which attract visitors from all over the state and country. The village is also home to several small businesses, including restaurants, retail stores, and professional services.
As of the 2010 census, the population of Spring Lake was 2,717. The population is largely white (94.3%), with small percentages of African American (2.2%), Asian (1.2%), and Hispanic (1.3%) residents. The median household income is $50,945, and the median age is 43. The village is home to several churches, schools, and other amenities. Spring Lake is a small, quiet community that is a popular destination for tourists and locals alike.
Common Questions
What is Per Capita Income in Spring Lake?
Per Capita income in Spring Lake is $54,562.
What is the Median Family Income in Spring Lake?
Median Family Income in Spring Lake is $97,625.
What is the Median Household income in Spring Lake?
Median Household Income in Spring Lake is $71,813.
What is Income or Wage Gap in Spring Lake?
Income or Wage Gap in Spring Lake is 8.0%.
Women in Spring Lake earn 92.0 cents for every dollar earned by a man.
What is Inequality or Gini Index in Spring Lake?
Inequality or Gini Index in Spring Lake is 0.51.
What is the Total Population of Spring Lake?
Total Population of Spring Lake is 2,530.
What is the Total Male Population of Spring Lake?
Total Male Population of Spring Lake is 1,147.
What is the Total Female Population of Spring Lake?
Total Female Population of Spring Lake is 1,383.
What is the Ratio of Males per 100 Females in Spring Lake?
There are 82.94 Males per 100 Females in Spring Lake.
What is the Ratio of Females per 100 Males in Spring Lake?
There are 120.58 Females per 100 Males in Spring Lake.
What is the Median Population Age in Spring Lake?
Median Population Age in Spring Lake is 54.7 Years.
What is the Average Family Size in Spring Lake
Average Family Size in Spring Lake is 2.6 People.
What is the Average Household Size in Spring Lake
Average Household Size in Spring Lake is 2.0 People.
How Large is the Labor Force in Spring Lake?
There are 1,406 People in the Labor Forcein in Spring Lake.
What is the Percentage of People in the Labor Force in Spring Lake?
64.8% of People are in the Labor Force in Spring Lake.
What is the Unemployment Rate in Spring Lake?
Unemployment Rate in Spring Lake is 4.4%.