Berkley, MI Map & Demographics
Berkley Map
Berkley Overview
$58,286
PER CAPITA INCOME
$134,891
AVG FAMILY INCOME
$108,125
AVG HOUSEHOLD INCOME
9.7%
WAGE / INCOME GAP [ % ]
90.3¢/ $1
WAGE / INCOME GAP [ $ ]
0.37
INEQUALITY / GINI INDEX
15,150
TOTAL POPULATION
7,382
MALE POPULATION
7,768
FEMALE POPULATION
95.03
MALES / 100 FEMALES
105.23
FEMALES / 100 MALES
37.6
MEDIAN AGE
2.9
AVG FAMILY SIZE
2.2
AVG HOUSEHOLD SIZE
9,498
LABOR FORCE [ PEOPLE ]
76.1%
PERCENT IN LABOR FORCE
3.0%
UNEMPLOYMENT RATE
Berkley Zip Codes
Berkley Area Codes
Income in Berkley
Income Overview in Berkley
Per Capita Income in Berkley is $58,286, while median incomes of families and households are $134,891 and $108,125 respectively.
| Characteristic | Number | Measure |
| Per Capita Income | 15,150 | $58,286 |
| Median Family Income | 3,702 | $134,891 |
| Mean Family Income | 3,702 | $154,960 |
| Median Household Income | 6,954 | $108,125 |
| Mean Household Income | 6,954 | $125,147 |
| Income Deficit | 3,702 | $0 |
| Wage / Income Gap (%) | 15,150 | 9.72% |
| Wage / Income Gap ($) | 15,150 | 90.28¢ per $1 |
| Gini / Inequality Index | 15,150 | 0.37 |
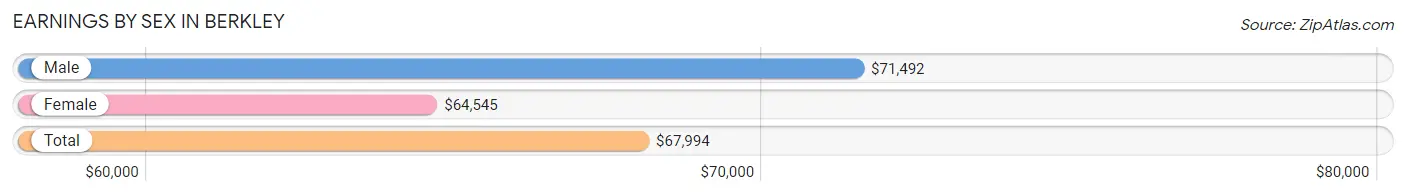
Earnings by Sex in Berkley
Average Earnings in Berkley are $67,994, $71,492 for men and $64,545 for women, a difference of 9.7%.
| Sex | Number | Average Earnings |
| Male | 5,098 (52.0%) | $71,492 |
| Female | 4,714 (48.0%) | $64,545 |
| Total | 9,812 (100.0%) | $67,994 |
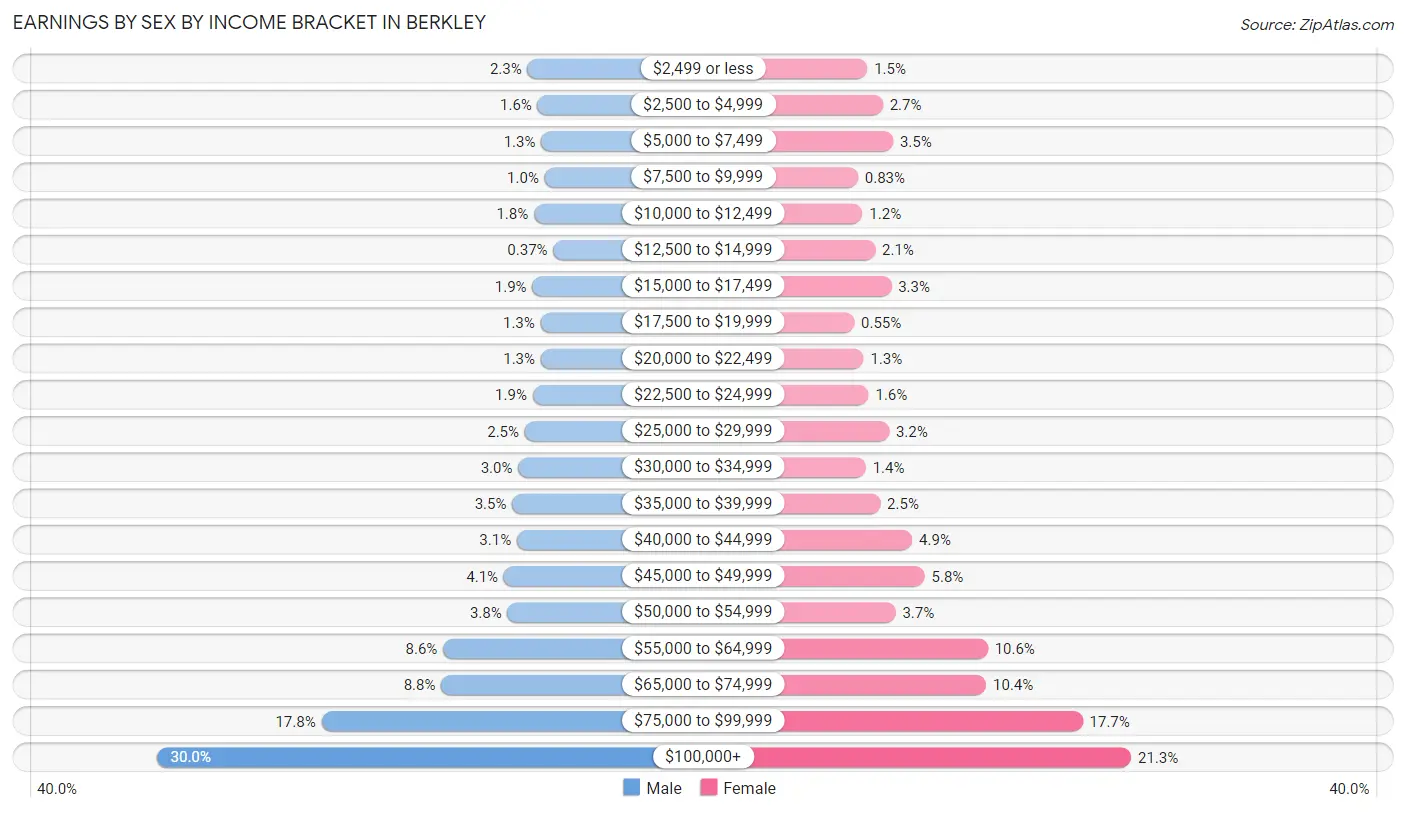
Earnings by Sex by Income Bracket in Berkley
The most common earnings brackets in Berkley are $100,000+ for men (1,531 | 30.0%) and $100,000+ for women (1,004 | 21.3%).
| Income | Male | Female |
| $2,499 or less | 118 (2.3%) | 72 (1.5%) |
| $2,500 to $4,999 | 79 (1.5%) | 127 (2.7%) |
| $5,000 to $7,499 | 65 (1.3%) | 163 (3.5%) |
| $7,500 to $9,999 | 52 (1.0%) | 39 (0.8%) |
| $10,000 to $12,499 | 93 (1.8%) | 55 (1.2%) |
| $12,500 to $14,999 | 19 (0.4%) | 100 (2.1%) |
| $15,000 to $17,499 | 99 (1.9%) | 157 (3.3%) |
| $17,500 to $19,999 | 68 (1.3%) | 26 (0.5%) |
| $20,000 to $22,499 | 67 (1.3%) | 59 (1.3%) |
| $22,500 to $24,999 | 98 (1.9%) | 77 (1.6%) |
| $25,000 to $29,999 | 128 (2.5%) | 149 (3.2%) |
| $30,000 to $34,999 | 153 (3.0%) | 67 (1.4%) |
| $35,000 to $39,999 | 176 (3.5%) | 118 (2.5%) |
| $40,000 to $44,999 | 158 (3.1%) | 231 (4.9%) |
| $45,000 to $49,999 | 208 (4.1%) | 275 (5.8%) |
| $50,000 to $54,999 | 194 (3.8%) | 172 (3.6%) |
| $55,000 to $64,999 | 440 (8.6%) | 498 (10.6%) |
| $65,000 to $74,999 | 447 (8.8%) | 492 (10.4%) |
| $75,000 to $99,999 | 905 (17.7%) | 833 (17.7%) |
| $100,000+ | 1,531 (30.0%) | 1,004 (21.3%) |
| Total | 5,098 (100.0%) | 4,714 (100.0%) |
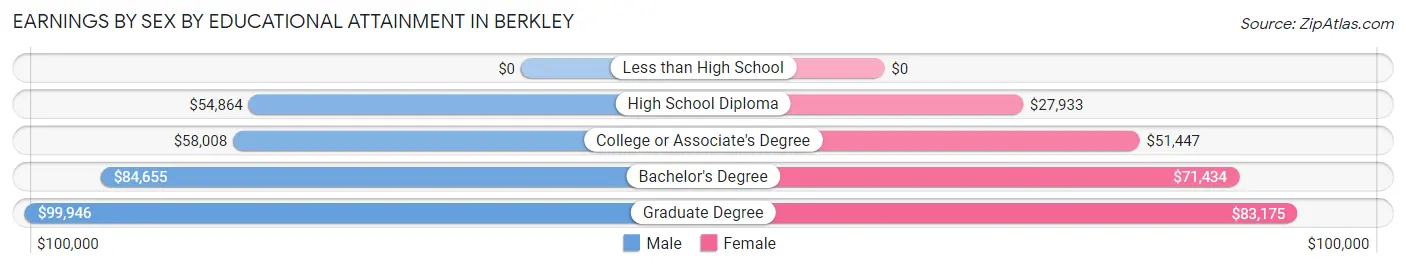
Earnings by Sex by Educational Attainment in Berkley
Average earnings in Berkley are $75,652 for men and $67,400 for women, a difference of 10.9%. Men with an educational attainment of graduate degree enjoy the highest average annual earnings of $99,946, while those with high school diploma education earn the least with $54,864. Women with an educational attainment of graduate degree earn the most with the average annual earnings of $83,175, while those with high school diploma education have the smallest earnings of $27,933.
| Educational Attainment | Male Income | Female Income |
| Less than High School | - | - |
| High School Diploma | $54,864 | $27,933 |
| College or Associate's Degree | $58,008 | $51,447 |
| Bachelor's Degree | $84,655 | $71,434 |
| Graduate Degree | $99,946 | $83,175 |
| Total | $75,652 | $67,400 |
Family Income in Berkley
Family Income Brackets in Berkley
According to the Berkley family income data, there are 1,148 families falling into the $100,000 to $149,999 income range, which is the most common income bracket and makes up 31.0% of all families.
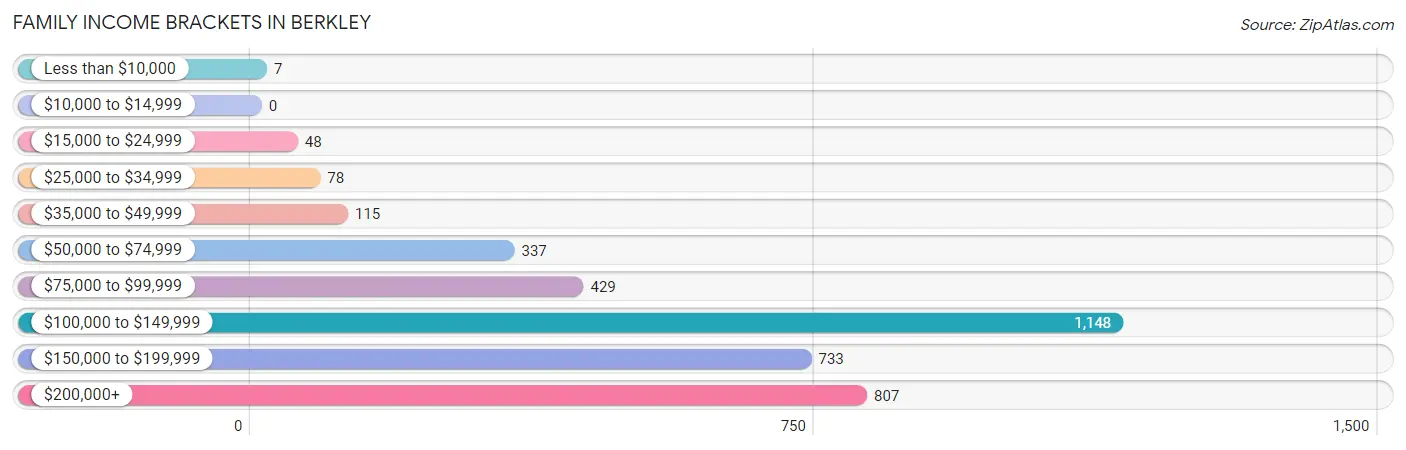
| Income Bracket | # Families | % Families |
| Less than $10,000 | 7 | 0.2% |
| $10,000 to $14,999 | 0 | 0.0% |
| $15,000 to $24,999 | 48 | 1.3% |
| $25,000 to $34,999 | 78 | 2.1% |
| $35,000 to $49,999 | 115 | 3.1% |
| $50,000 to $74,999 | 337 | 9.1% |
| $75,000 to $99,999 | 429 | 11.6% |
| $100,000 to $149,999 | 1,148 | 31.0% |
| $150,000 to $199,999 | 733 | 19.8% |
| $200,000+ | 807 | 21.8% |
Family Income by Famaliy Size in Berkley
4-person families (670 | 18.1%) account for the highest median family income in Berkley with $178,100 per family, while 2-person families (1,897 | 51.2%) have the highest median income of $58,148 per family member.
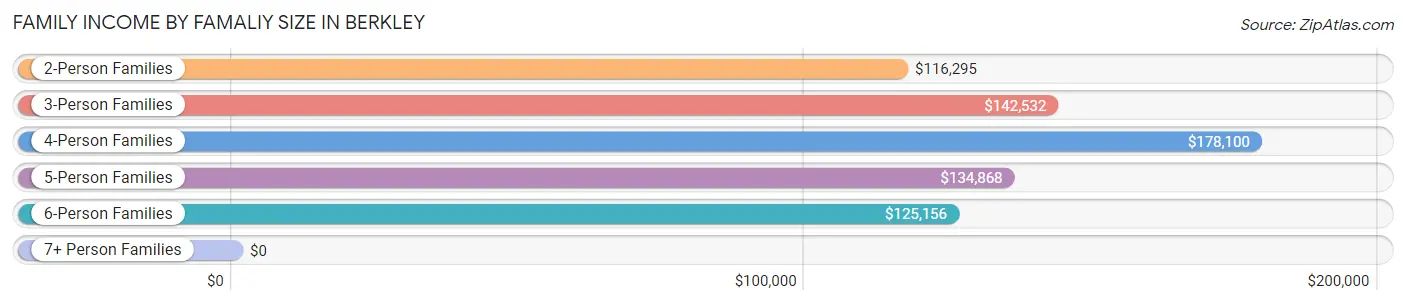
| Income Bracket | # Families | Median Income |
| 2-Person Families | 1,897 (51.2%) | $116,295 |
| 3-Person Families | 845 (22.8%) | $142,532 |
| 4-Person Families | 670 (18.1%) | $178,100 |
| 5-Person Families | 238 (6.4%) | $134,868 |
| 6-Person Families | 43 (1.2%) | $125,156 |
| 7+ Person Families | 9 (0.2%) | $0 |
| Total | 3,702 (100.0%) | $134,891 |
Family Income by Number of Earners in Berkley
The median family income in Berkley is $134,891, with families comprising 3+ earners (285) having the highest median family income of $176,750, while families with no earners (330) have the lowest median family income of $64,048, accounting for 7.7% and 8.9% of families, respectively.
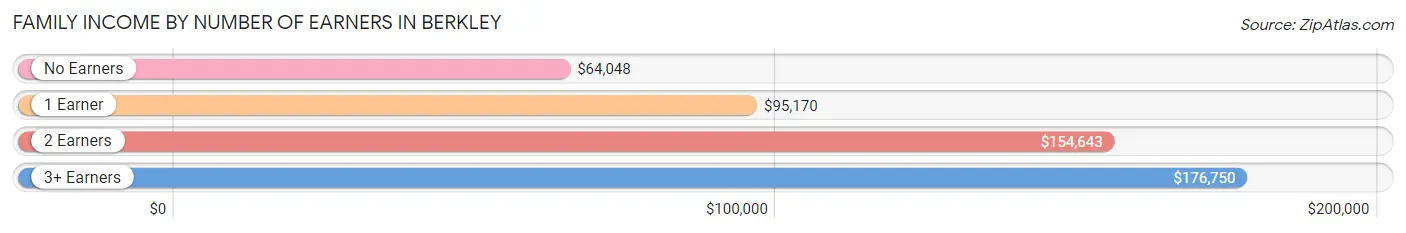
| Number of Earners | # Families | Median Income |
| No Earners | 330 (8.9%) | $64,048 |
| 1 Earner | 741 (20.0%) | $95,170 |
| 2 Earners | 2,346 (63.4%) | $154,643 |
| 3+ Earners | 285 (7.7%) | $176,750 |
| Total | 3,702 (100.0%) | $134,891 |
Household Income in Berkley
Household Income Brackets in Berkley
With 1,780 households falling in the category, the $100,000 to $149,999 income range is the most frequent in Berkley, accounting for 25.6% of all households. In contrast, only 90 households (1.3%) fall into the $10,000 to $14,999 income bracket, making it the least populous group.
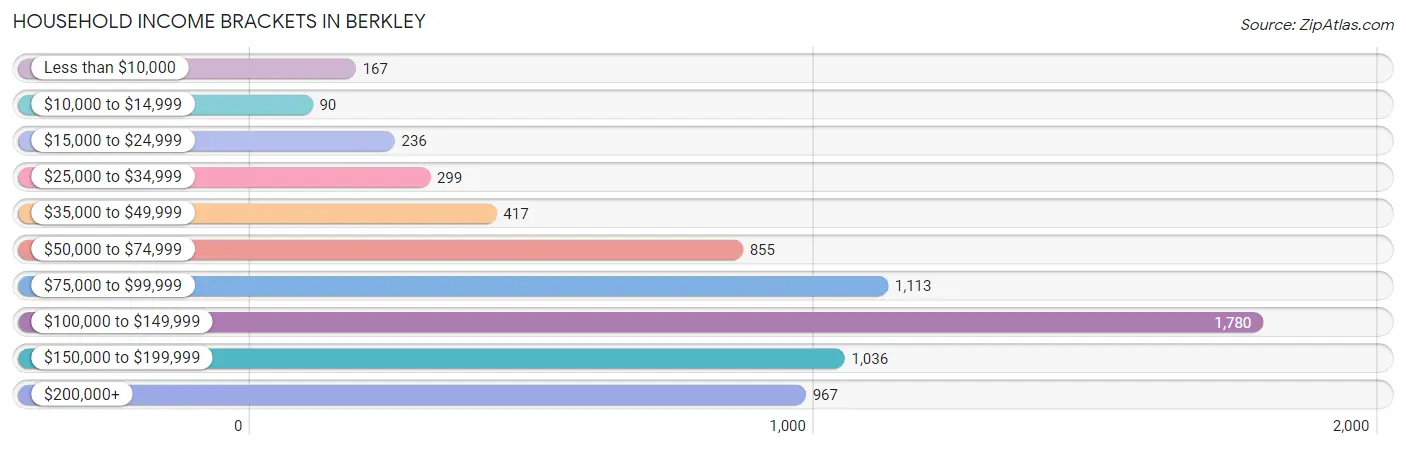
| Income Bracket | # Households | % Households |
| Less than $10,000 | 167 | 2.4% |
| $10,000 to $14,999 | 90 | 1.3% |
| $15,000 to $24,999 | 236 | 3.4% |
| $25,000 to $34,999 | 299 | 4.3% |
| $35,000 to $49,999 | 417 | 6.0% |
| $50,000 to $74,999 | 855 | 12.3% |
| $75,000 to $99,999 | 1,113 | 16.0% |
| $100,000 to $149,999 | 1,780 | 25.6% |
| $150,000 to $199,999 | 1,036 | 14.9% |
| $200,000+ | 967 | 13.9% |
Household Income by Householder Age in Berkley
The median household income in Berkley is $108,125, with the highest median household income of $126,434 found in the 25 to 44 years age bracket for the primary householder. A total of 2,904 households (41.8%) fall into this category. Meanwhile, the 65+ years age bracket for the primary householder has the lowest median household income of $64,971, with 1,491 households (21.4%) in this group.
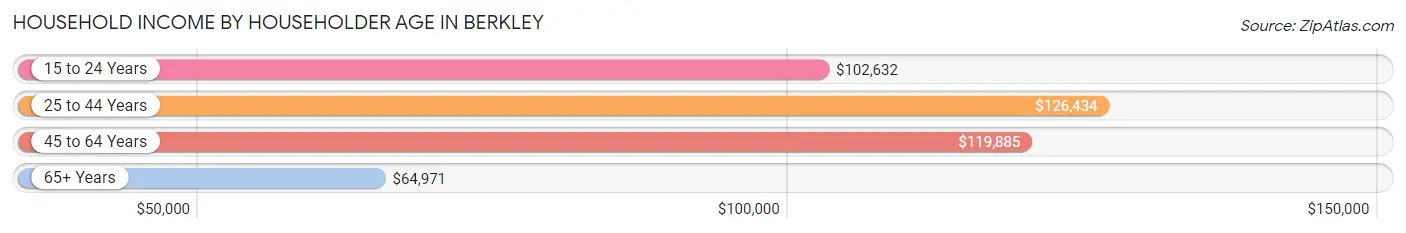
| Income Bracket | # Households | Median Income |
| 15 to 24 Years | 62 (0.9%) | $102,632 |
| 25 to 44 Years | 2,904 (41.8%) | $126,434 |
| 45 to 64 Years | 2,497 (35.9%) | $119,885 |
| 65+ Years | 1,491 (21.4%) | $64,971 |
| Total | 6,954 (100.0%) | $108,125 |
Poverty in Berkley
Income Below Poverty by Sex and Age in Berkley
With 3.3% poverty level for males and 2.9% for females among the residents of Berkley, 16 and 17 year old males and 18 to 24 year old females are the most vulnerable to poverty, with 12 males (9.8%) and 33 females (9.0%) in their respective age groups living below the poverty level.
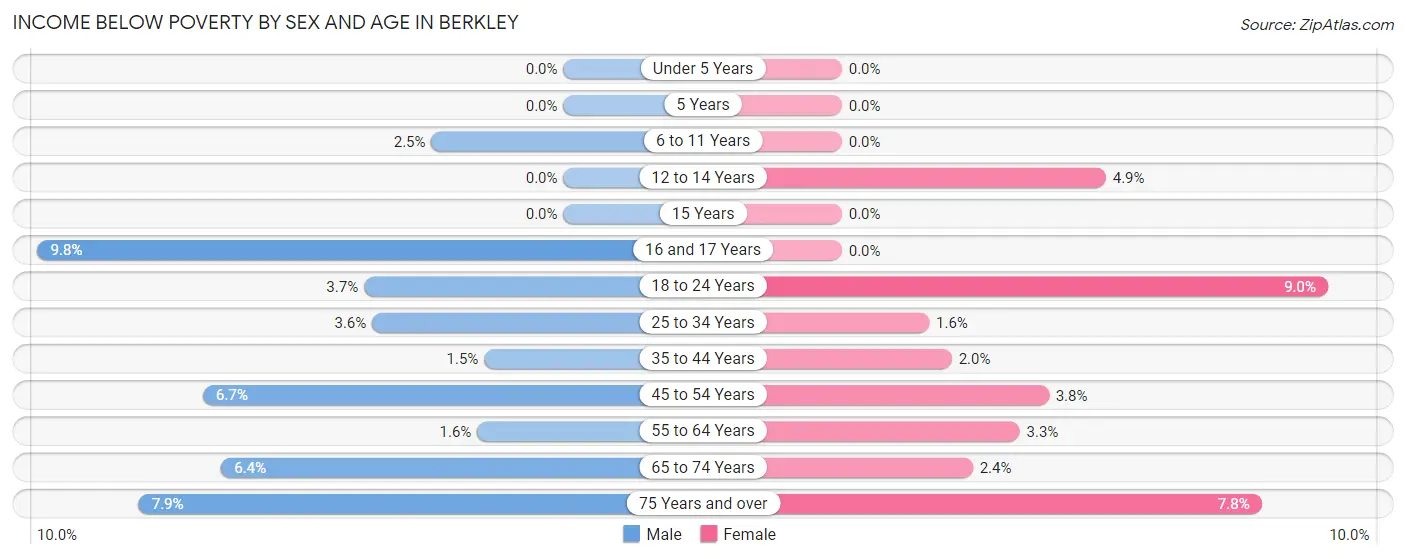
| Age Bracket | Male | Female |
| Under 5 Years | 0 (0.0%) | 0 (0.0%) |
| 5 Years | 0 (0.0%) | 0 (0.0%) |
| 6 to 11 Years | 12 (2.5%) | 0 (0.0%) |
| 12 to 14 Years | 0 (0.0%) | 10 (4.9%) |
| 15 Years | 0 (0.0%) | 0 (0.0%) |
| 16 and 17 Years | 12 (9.8%) | 0 (0.0%) |
| 18 to 24 Years | 11 (3.7%) | 33 (9.0%) |
| 25 to 34 Years | 63 (3.5%) | 26 (1.6%) |
| 35 to 44 Years | 16 (1.5%) | 21 (2.0%) |
| 45 to 54 Years | 61 (6.7%) | 35 (3.8%) |
| 55 to 64 Years | 17 (1.6%) | 37 (3.3%) |
| 65 to 74 Years | 33 (6.4%) | 19 (2.4%) |
| 75 Years and over | 19 (7.9%) | 38 (7.8%) |
| Total | 244 (3.3%) | 219 (2.9%) |
Income Above Poverty by Sex and Age in Berkley
According to the poverty statistics in Berkley, males aged under 5 years and females aged under 5 years are the age groups that are most secure financially, with 100.0% of males and 100.0% of females in these age groups living above the poverty line.
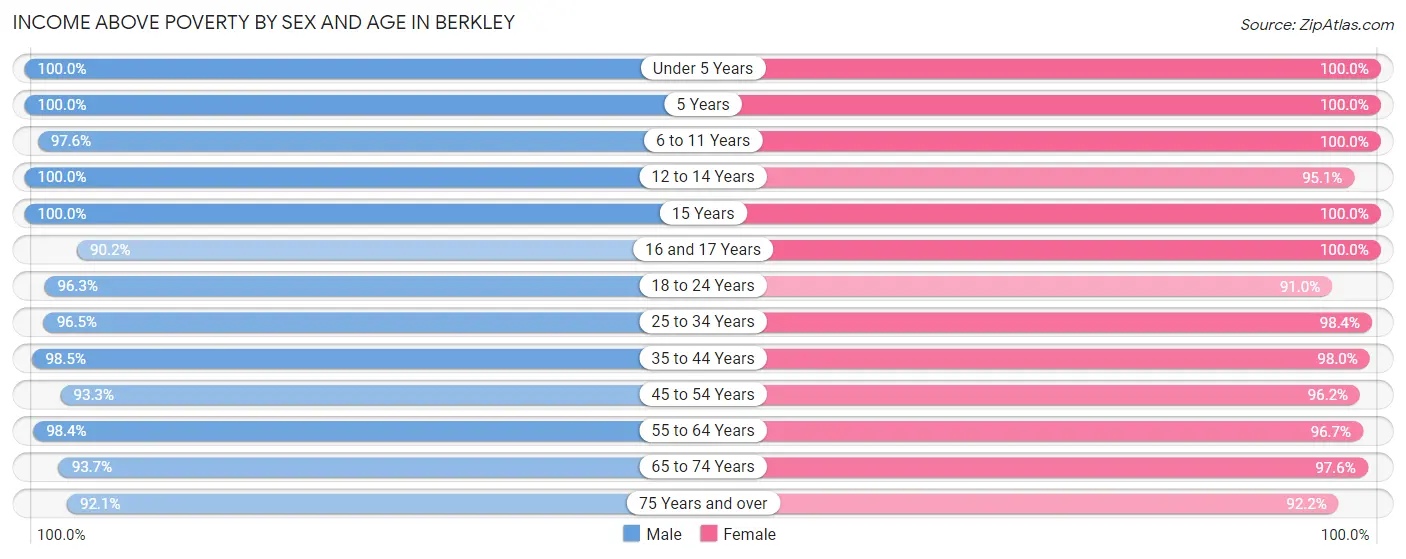
| Age Bracket | Male | Female |
| Under 5 Years | 595 (100.0%) | 496 (100.0%) |
| 5 Years | 70 (100.0%) | 84 (100.0%) |
| 6 to 11 Years | 477 (97.6%) | 301 (100.0%) |
| 12 to 14 Years | 162 (100.0%) | 194 (95.1%) |
| 15 Years | 18 (100.0%) | 125 (100.0%) |
| 16 and 17 Years | 111 (90.2%) | 158 (100.0%) |
| 18 to 24 Years | 286 (96.3%) | 333 (91.0%) |
| 25 to 34 Years | 1,712 (96.5%) | 1,574 (98.4%) |
| 35 to 44 Years | 1,076 (98.5%) | 1,009 (98.0%) |
| 45 to 54 Years | 851 (93.3%) | 877 (96.2%) |
| 55 to 64 Years | 1,047 (98.4%) | 1,084 (96.7%) |
| 65 to 74 Years | 487 (93.6%) | 763 (97.6%) |
| 75 Years and over | 222 (92.1%) | 450 (92.2%) |
| Total | 7,114 (96.7%) | 7,448 (97.1%) |
Income Below Poverty Among Married-Couple Families in Berkley
The poverty statistics for married-couple families in Berkley show that 0.7% or 20 of the total 3,037 families live below the poverty line. Families with 3 or 4 children have the highest poverty rate of 6.1%, comprising of 11 families. On the other hand, families with 1 or 2 children have the lowest poverty rate of 0.0%, which includes 0 families.
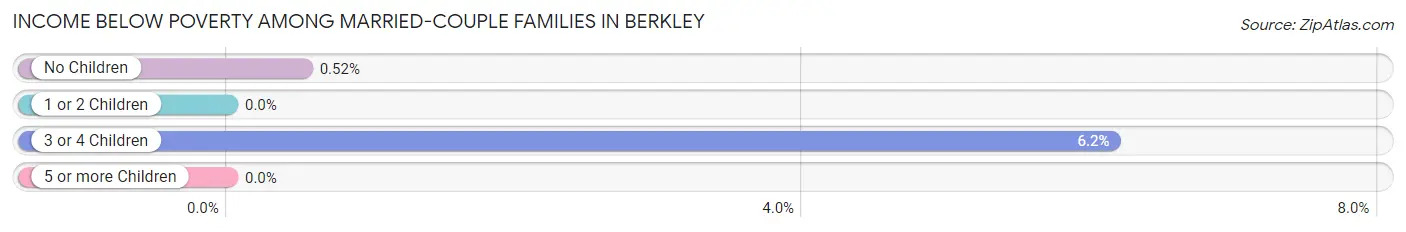
| Children | Above Poverty | Below Poverty |
| No Children | 1,710 (99.5%) | 9 (0.5%) |
| 1 or 2 Children | 1,130 (100.0%) | 0 (0.0%) |
| 3 or 4 Children | 168 (93.9%) | 11 (6.1%) |
| 5 or more Children | 9 (100.0%) | 0 (0.0%) |
| Total | 3,017 (99.3%) | 20 (0.7%) |
Income Below Poverty Among Single-Parent Households in Berkley
| Children | Single Father | Single Mother |
| No Children | 0 (0.0%) | 0 (0.0%) |
| 1 or 2 Children | 0 (0.0%) | 0 (0.0%) |
| 3 or 4 Children | 0 (0.0%) | 0 (0.0%) |
| 5 or more Children | 0 (0.0%) | 0 (0.0%) |
| Total | 0 (0.0%) | 0 (0.0%) |
Income Below Poverty Among Married-Couple vs Single-Parent Households in Berkley
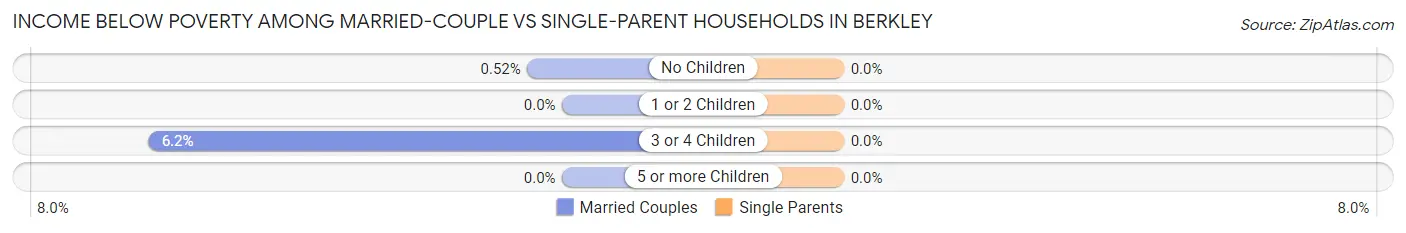
| Children | Married-Couple Families | Single-Parent Households |
| No Children | 9 (0.5%) | 0 (0.0%) |
| 1 or 2 Children | 0 (0.0%) | 0 (0.0%) |
| 3 or 4 Children | 11 (6.1%) | 0 (0.0%) |
| 5 or more Children | 0 (0.0%) | 0 (0.0%) |
| Total | 20 (0.7%) | 0 (0.0%) |
Race in Berkley
The most populous races in Berkley are White / Caucasian (13,394 | 88.4%), Two or more Races (1,069 | 7.1%), and Hispanic or Latino (668 | 4.4%).
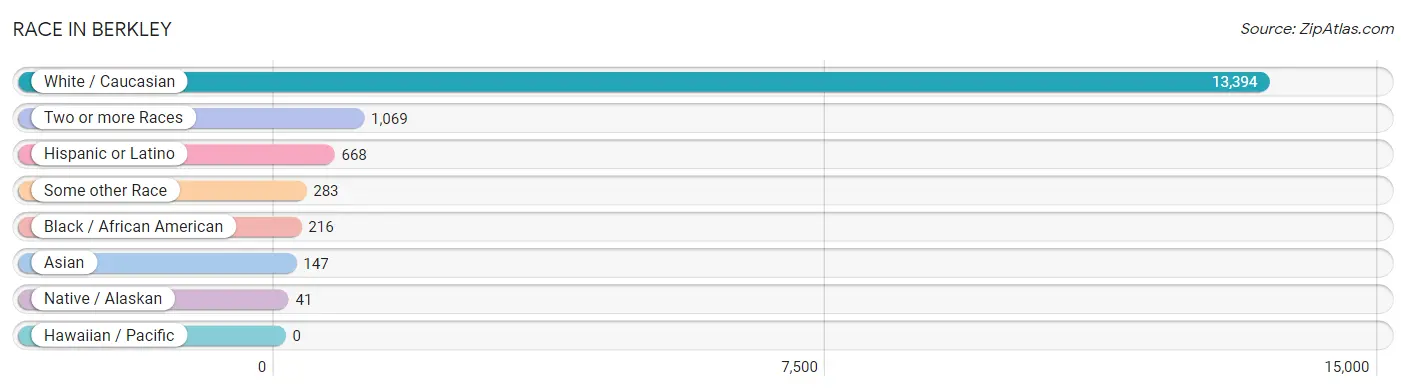
| Race | # Population | % Population |
| Asian | 147 | 1.0% |
| Black / African American | 216 | 1.4% |
| Hawaiian / Pacific | 0 | 0.0% |
| Hispanic or Latino | 668 | 4.4% |
| Native / Alaskan | 41 | 0.3% |
| White / Caucasian | 13,394 | 88.4% |
| Two or more Races | 1,069 | 7.1% |
| Some other Race | 283 | 1.9% |
| Total | 15,150 | 100.0% |
Ancestry in Berkley
The most populous ancestries reported in Berkley are German (3,084 | 20.4%), Irish (2,417 | 16.0%), English (2,174 | 14.3%), Polish (1,953 | 12.9%), and Italian (1,450 | 9.6%), together accounting for 73.1% of all Berkley residents.
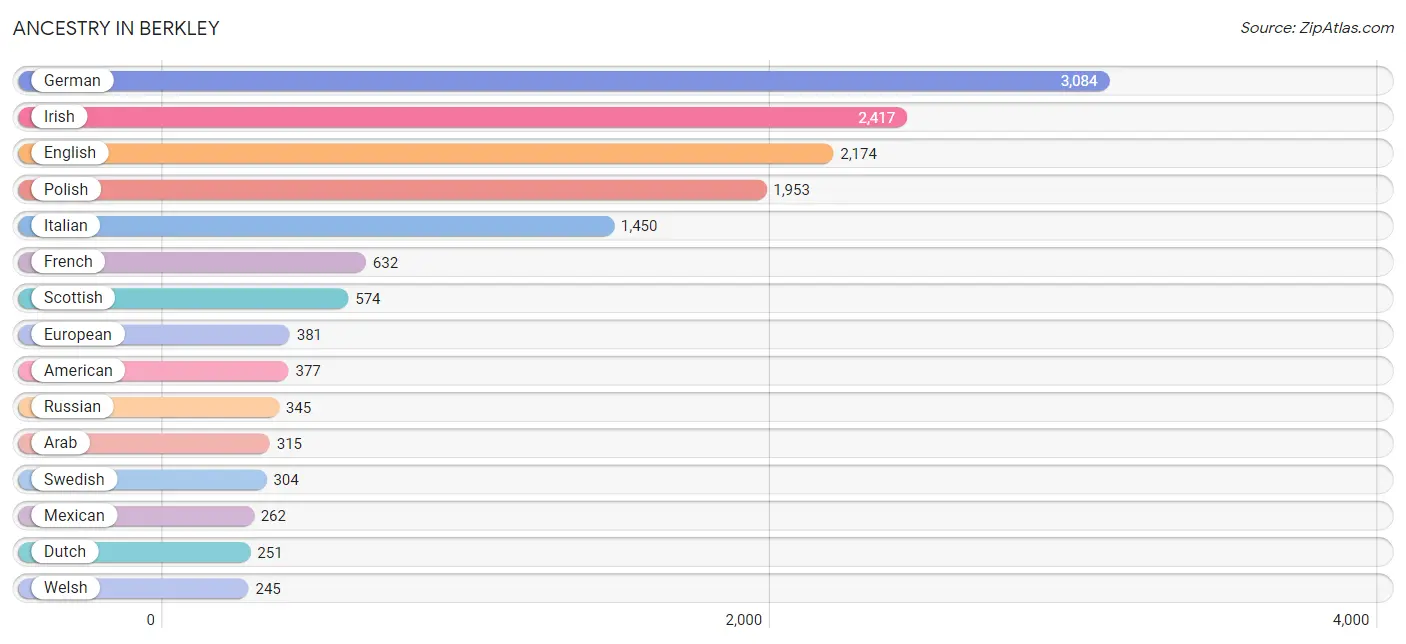
| Ancestry | # Population | % Population |
| African | 12 | 0.1% |
| Albanian | 13 | 0.1% |
| American | 377 | 2.5% |
| Apache | 24 | 0.2% |
| Arab | 315 | 2.1% |
| Argentinean | 32 | 0.2% |
| Armenian | 104 | 0.7% |
| Austrian | 41 | 0.3% |
| Belgian | 110 | 0.7% |
| Bhutanese | 44 | 0.3% |
| Brazilian | 49 | 0.3% |
| British | 127 | 0.8% |
| Bulgarian | 9 | 0.1% |
| Burmese | 69 | 0.5% |
| Canadian | 79 | 0.5% |
| Central American | 43 | 0.3% |
| Chippewa | 14 | 0.1% |
| Costa Rican | 10 | 0.1% |
| Croatian | 81 | 0.5% |
| Cuban | 184 | 1.2% |
| Czech | 51 | 0.3% |
| Czechoslovakian | 24 | 0.2% |
| Danish | 47 | 0.3% |
| Dominican | 4 | 0.0% |
| Dutch | 251 | 1.7% |
| Eastern European | 38 | 0.3% |
| Ecuadorian | 6 | 0.0% |
| Egyptian | 12 | 0.1% |
| English | 2,174 | 14.3% |
| European | 381 | 2.5% |
| Finnish | 223 | 1.5% |
| French | 632 | 4.2% |
| French American Indian | 9 | 0.1% |
| French Canadian | 160 | 1.1% |
| German | 3,084 | 20.4% |
| Greek | 206 | 1.4% |
| Guatemalan | 7 | 0.1% |
| Hungarian | 172 | 1.1% |
| Icelander | 6 | 0.0% |
| Indian (Asian) | 193 | 1.3% |
| Inupiat | 2 | 0.0% |
| Irish | 2,417 | 16.0% |
| Israeli | 13 | 0.1% |
| Italian | 1,450 | 9.6% |
| Japanese | 1 | 0.0% |
| Korean | 110 | 0.7% |
| Lebanese | 189 | 1.3% |
| Lithuanian | 65 | 0.4% |
| Macedonian | 10 | 0.1% |
| Maltese | 78 | 0.5% |
| Mexican | 262 | 1.7% |
| Nicaraguan | 18 | 0.1% |
| Northern European | 7 | 0.1% |
| Norwegian | 140 | 0.9% |
| Pennsylvania German | 7 | 0.1% |
| Polish | 1,953 | 12.9% |
| Portuguese | 63 | 0.4% |
| Puerto Rican | 53 | 0.4% |
| Romanian | 33 | 0.2% |
| Russian | 345 | 2.3% |
| Salvadoran | 8 | 0.1% |
| Scandinavian | 53 | 0.4% |
| Scotch-Irish | 144 | 0.9% |
| Scottish | 574 | 3.8% |
| Serbian | 18 | 0.1% |
| Slovak | 47 | 0.3% |
| Slovene | 22 | 0.2% |
| South American | 38 | 0.3% |
| South American Indian | 11 | 0.1% |
| Spaniard | 39 | 0.3% |
| Spanish | 14 | 0.1% |
| Subsaharan African | 12 | 0.1% |
| Swedish | 304 | 2.0% |
| Syrian | 13 | 0.1% |
| Thai | 18 | 0.1% |
| Ukrainian | 200 | 1.3% |
| Welsh | 245 | 1.6% | View All 77 Rows |
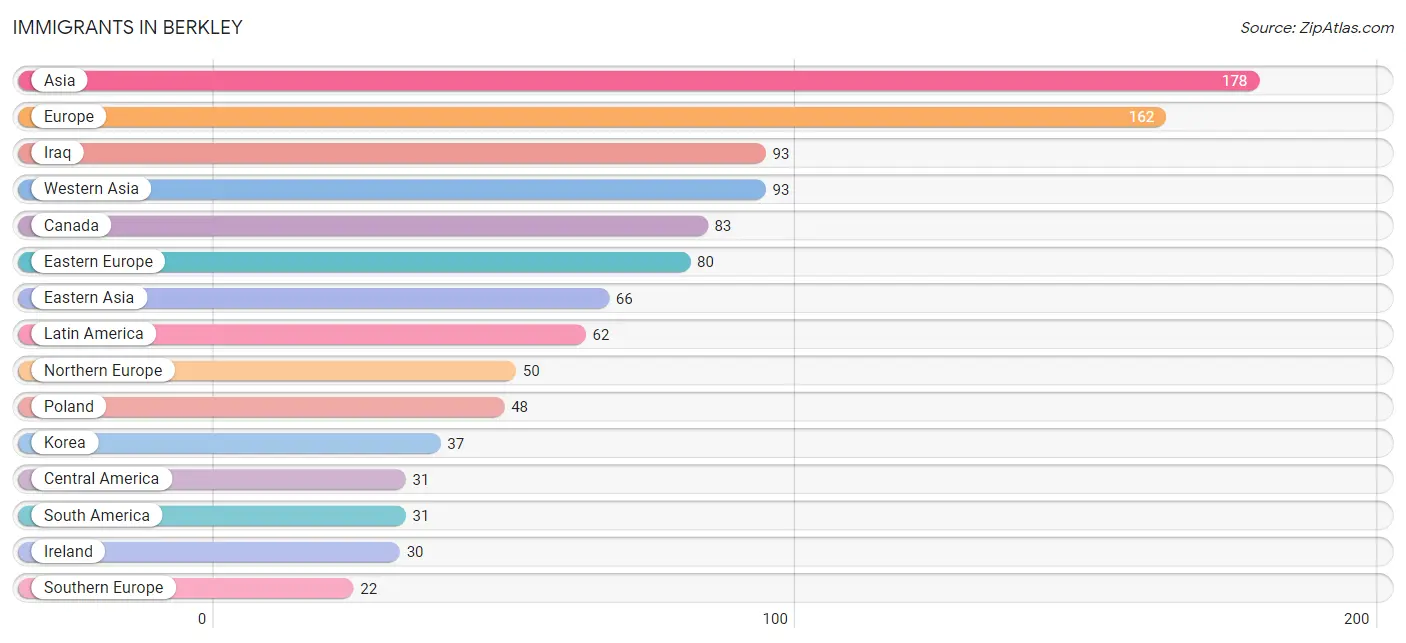
Immigrants in Berkley
The most numerous immigrant groups reported in Berkley came from Asia (178 | 1.2%), Europe (162 | 1.1%), Iraq (93 | 0.6%), Western Asia (93 | 0.6%), and Canada (83 | 0.5%), together accounting for 4.0% of all Berkley residents.
| Immigration Origin | # Population | % Population |
| Argentina | 11 | 0.1% |
| Asia | 178 | 1.2% |
| Brazil | 14 | 0.1% |
| Cambodia | 1 | 0.0% |
| Canada | 83 | 0.5% |
| Central America | 31 | 0.2% |
| China | 19 | 0.1% |
| Costa Rica | 10 | 0.1% |
| Eastern Asia | 66 | 0.4% |
| Eastern Europe | 80 | 0.5% |
| Ecuador | 6 | 0.0% |
| Europe | 162 | 1.1% |
| Greece | 9 | 0.1% |
| India | 6 | 0.0% |
| Iraq | 93 | 0.6% |
| Ireland | 30 | 0.2% |
| Japan | 10 | 0.1% |
| Korea | 37 | 0.2% |
| Latin America | 62 | 0.4% |
| Mexico | 21 | 0.1% |
| Netherlands | 10 | 0.1% |
| Northern Europe | 50 | 0.3% |
| Philippines | 12 | 0.1% |
| Poland | 48 | 0.3% |
| Russia | 9 | 0.1% |
| South America | 31 | 0.2% |
| South Central Asia | 6 | 0.0% |
| South Eastern Asia | 13 | 0.1% |
| Southern Europe | 22 | 0.2% |
| Spain | 13 | 0.1% |
| Ukraine | 11 | 0.1% |
| Western Asia | 93 | 0.6% |
| Western Europe | 10 | 0.1% | View All 33 Rows |
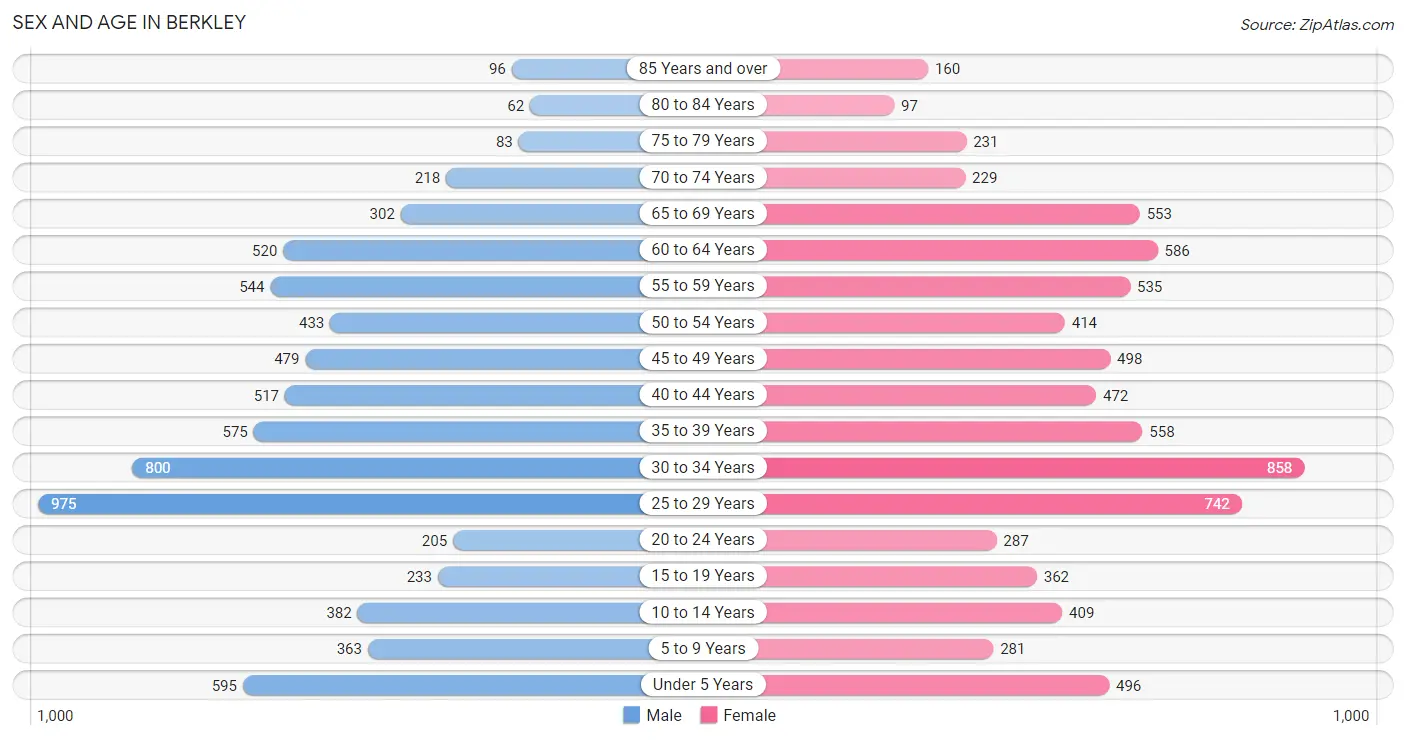
Sex and Age in Berkley
Sex and Age in Berkley
The most populous age groups in Berkley are 25 to 29 Years (975 | 13.2%) for men and 30 to 34 Years (858 | 11.1%) for women.
| Age Bracket | Male | Female |
| Under 5 Years | 595 (8.1%) | 496 (6.4%) |
| 5 to 9 Years | 363 (4.9%) | 281 (3.6%) |
| 10 to 14 Years | 382 (5.2%) | 409 (5.3%) |
| 15 to 19 Years | 233 (3.2%) | 362 (4.7%) |
| 20 to 24 Years | 205 (2.8%) | 287 (3.7%) |
| 25 to 29 Years | 975 (13.2%) | 742 (9.6%) |
| 30 to 34 Years | 800 (10.8%) | 858 (11.1%) |
| 35 to 39 Years | 575 (7.8%) | 558 (7.2%) |
| 40 to 44 Years | 517 (7.0%) | 472 (6.1%) |
| 45 to 49 Years | 479 (6.5%) | 498 (6.4%) |
| 50 to 54 Years | 433 (5.9%) | 414 (5.3%) |
| 55 to 59 Years | 544 (7.4%) | 535 (6.9%) |
| 60 to 64 Years | 520 (7.0%) | 586 (7.5%) |
| 65 to 69 Years | 302 (4.1%) | 553 (7.1%) |
| 70 to 74 Years | 218 (2.9%) | 229 (2.9%) |
| 75 to 79 Years | 83 (1.1%) | 231 (3.0%) |
| 80 to 84 Years | 62 (0.8%) | 97 (1.3%) |
| 85 Years and over | 96 (1.3%) | 160 (2.1%) |
| Total | 7,382 (100.0%) | 7,768 (100.0%) |
Families and Households in Berkley
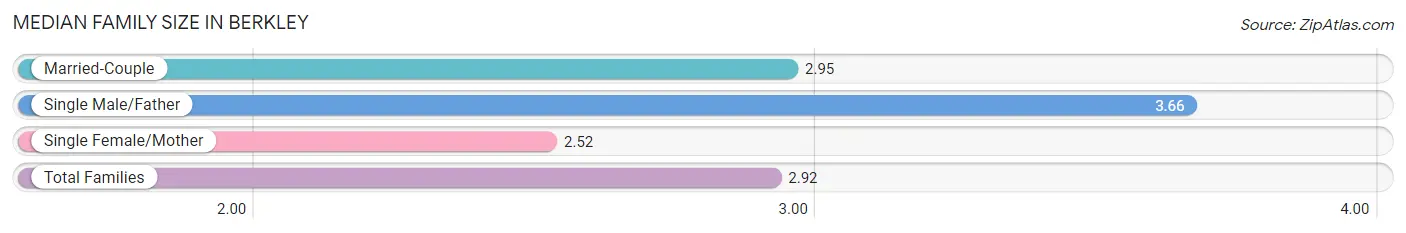
Median Family Size in Berkley
The median family size in Berkley is 2.92 persons per family, with single male/father families (160 | 4.3%) accounting for the largest median family size of 3.66 persons per family. On the other hand, single female/mother families (505 | 13.6%) represent the smallest median family size with 2.52 persons per family.
| Family Type | # Families | Family Size |
| Married-Couple | 3,037 (82.0%) | 2.95 |
| Single Male/Father | 160 (4.3%) | 3.66 |
| Single Female/Mother | 505 (13.6%) | 2.52 |
| Total Families | 3,702 (100.0%) | 2.92 |
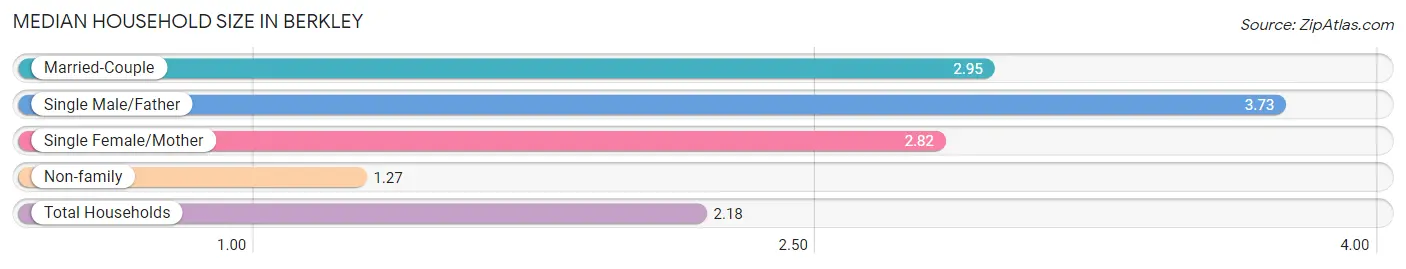
Median Household Size in Berkley
The median household size in Berkley is 2.18 persons per household, with single male/father households (160 | 2.3%) accounting for the largest median household size of 3.73 persons per household. non-family households (3,252 | 46.8%) represent the smallest median household size with 1.27 persons per household.
| Household Type | # Households | Household Size |
| Married-Couple | 3,037 (43.7%) | 2.95 |
| Single Male/Father | 160 (2.3%) | 3.73 |
| Single Female/Mother | 505 (7.3%) | 2.82 |
| Non-family | 3,252 (46.8%) | 1.27 |
| Total Households | 6,954 (100.0%) | 2.18 |
Household Size by Marriage Status in Berkley
Out of a total of 6,954 households in Berkley, 3,702 (53.2%) are family households, while 3,252 (46.8%) are nonfamily households. The most numerous type of family households are 2-person households, comprising 1,853, and the most common type of nonfamily households are 1-person households, comprising 2,530.
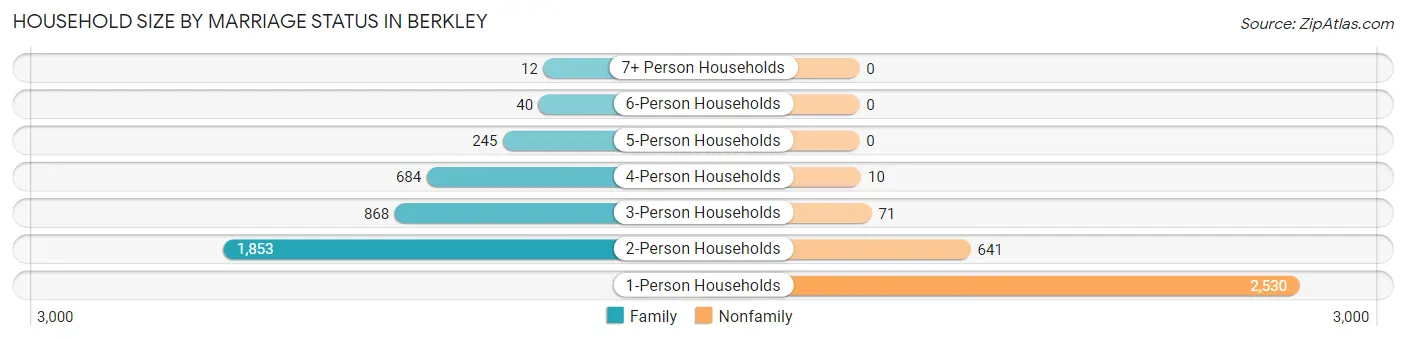
| Household Size | Family Households | Nonfamily Households |
| 1-Person Households | - | 2,530 (36.4%) |
| 2-Person Households | 1,853 (26.7%) | 641 (9.2%) |
| 3-Person Households | 868 (12.5%) | 71 (1.0%) |
| 4-Person Households | 684 (9.8%) | 10 (0.1%) |
| 5-Person Households | 245 (3.5%) | 0 (0.0%) |
| 6-Person Households | 40 (0.6%) | 0 (0.0%) |
| 7+ Person Households | 12 (0.2%) | 0 (0.0%) |
| Total | 3,702 (53.2%) | 3,252 (46.8%) |
Female Fertility in Berkley
Fertility by Age in Berkley
Average fertility rate in Berkley is 64.0 births per 1,000 women. Women in the age bracket of 20 to 34 years have the highest fertility rate with 82.0 births per 1,000 women. Women in the age bracket of 20 to 34 years acount for 62.0% of all women with births.
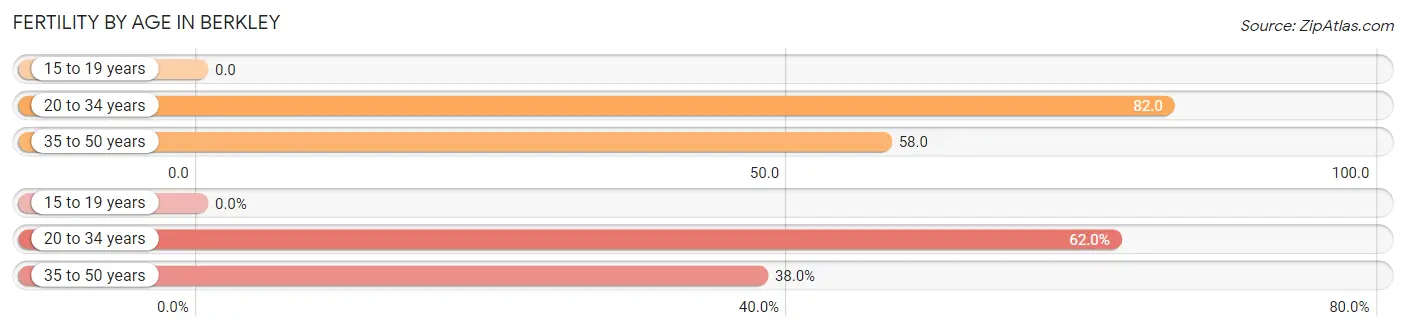
| Age Bracket | Women with Births | Births / 1,000 Women |
| 15 to 19 years | 0 (0.0%) | 0.0 |
| 20 to 34 years | 155 (62.0%) | 82.0 |
| 35 to 50 years | 95 (38.0%) | 58.0 |
| Total | 250 (100.0%) | 64.0 |
Fertility by Age by Marriage Status in Berkley
69.2% of women with births (250) in Berkley are married. The highest percentage of unmarried women with births falls into 20 to 34 years age bracket with 36.8% of them unmarried at the time of birth, while the lowest percentage of unmarried women with births belong to 35 to 50 years age bracket with 21.1% of them unmarried.
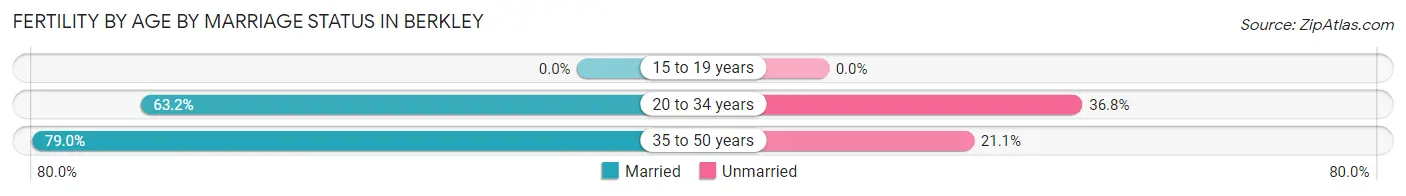
| Age Bracket | Married | Unmarried |
| 15 to 19 years | 0 (0.0%) | 0 (0.0%) |
| 20 to 34 years | 98 (63.2%) | 57 (36.8%) |
| 35 to 50 years | 75 (78.9%) | 20 (21.0%) |
| Total | 173 (69.2%) | 77 (30.8%) |
Fertility by Education in Berkley
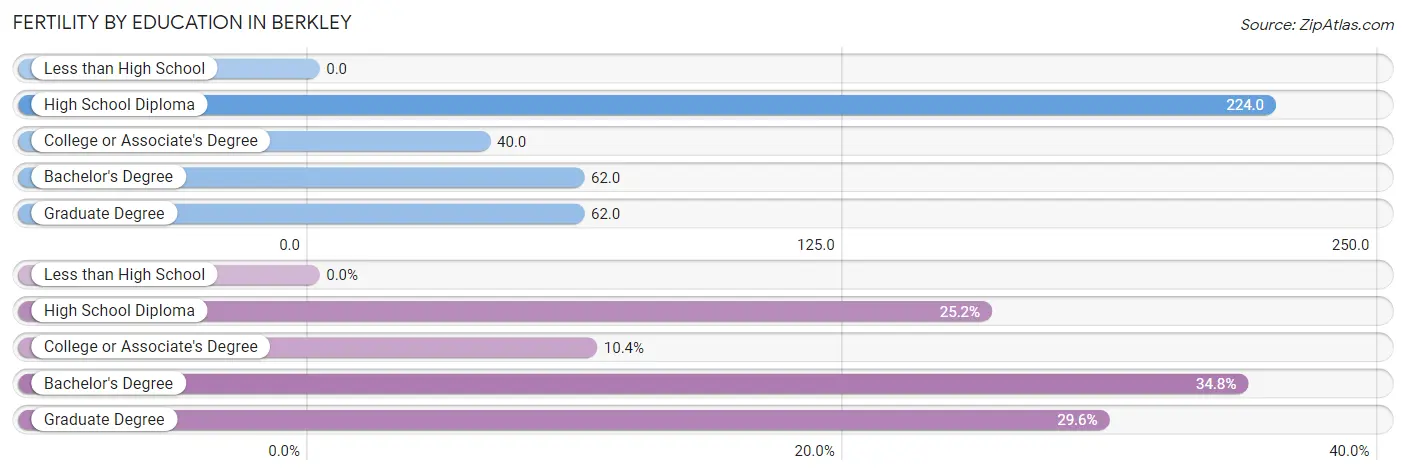
| Educational Attainment | Women with Births | Births / 1,000 Women |
| Less than High School | 0 (0.0%) | 0.0 |
| High School Diploma | 63 (25.2%) | 224.0 |
| College or Associate's Degree | 26 (10.4%) | 40.0 |
| Bachelor's Degree | 87 (34.8%) | 62.0 |
| Graduate Degree | 74 (29.6%) | 62.0 |
| Total | 250 (100.0%) | 64.0 |
Fertility by Education by Marriage Status in Berkley
30.8% of women with births in Berkley are unmarried. Women with the educational attainment of college or associate's degree are most likely to be married with 100.0% of them married at childbirth, while women with the educational attainment of high school diploma are least likely to be married with 90.5% of them unmarried at childbirth.
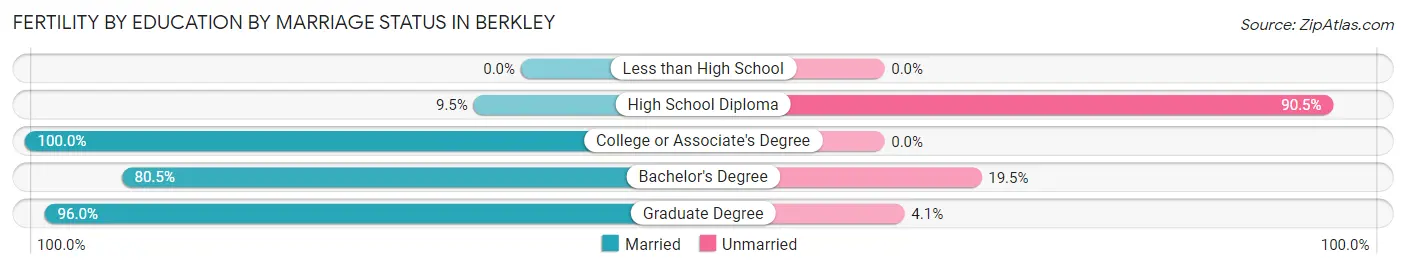
| Educational Attainment | Married | Unmarried |
| Less than High School | 0 (0.0%) | 0 (0.0%) |
| High School Diploma | 6 (9.5%) | 57 (90.5%) |
| College or Associate's Degree | 26 (100.0%) | 0 (0.0%) |
| Bachelor's Degree | 70 (80.5%) | 17 (19.5%) |
| Graduate Degree | 71 (96.0%) | 3 (4.1%) |
| Total | 173 (69.2%) | 77 (30.8%) |
Employment Characteristics in Berkley
Employment by Class of Employer in Berkley
Among the 9,099 employed individuals in Berkley, private company employees (6,525 | 71.7%), not-for-profit organizations (1,135 | 12.5%), and local government employees (566 | 6.2%) make up the most common classes of employment.
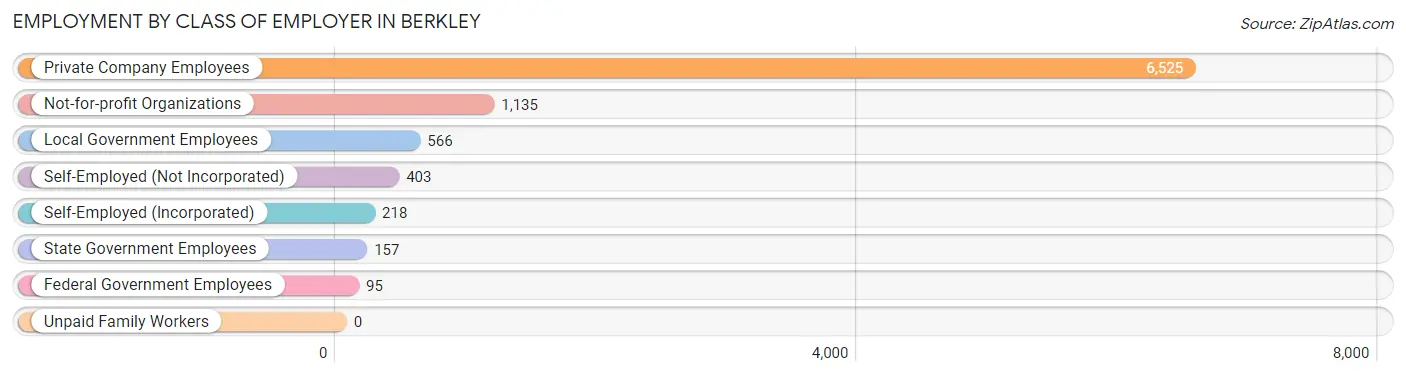
| Employer Class | # Employees | % Employees |
| Private Company Employees | 6,525 | 71.7% |
| Self-Employed (Incorporated) | 218 | 2.4% |
| Self-Employed (Not Incorporated) | 403 | 4.4% |
| Not-for-profit Organizations | 1,135 | 12.5% |
| Local Government Employees | 566 | 6.2% |
| State Government Employees | 157 | 1.7% |
| Federal Government Employees | 95 | 1.0% |
| Unpaid Family Workers | 0 | 0.0% |
| Total | 9,099 | 100.0% |
Employment Status by Age in Berkley
According to the labor force statistics for Berkley, out of the total population over 16 years of age (12,481), 76.1% or 9,498 individuals are in the labor force, with 3.0% or 285 of them unemployed. The age group with the highest labor force participation rate is 30 to 34 years, with 94.9% or 1,573 individuals in the labor force. Within the labor force, the 16 to 19 years age range has the highest percentage of unemployed individuals, with 11.7% or 21 of them being unemployed.
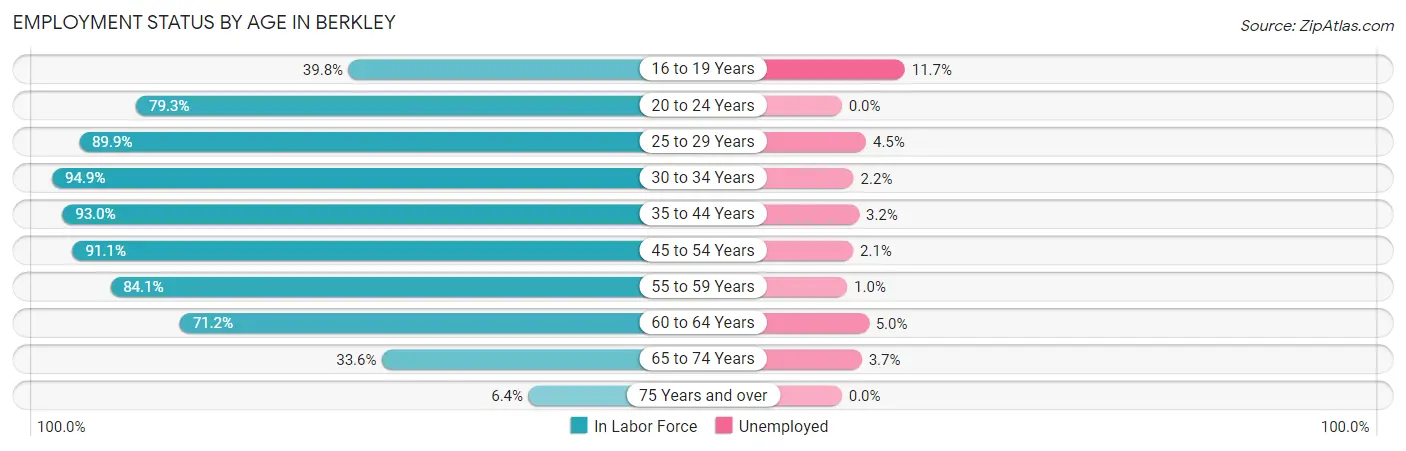
| Age Bracket | In Labor Force | Unemployed |
| 16 to 19 Years | 180 (39.8%) | 21 (11.7%) |
| 20 to 24 Years | 390 (79.3%) | 0 (0.0%) |
| 25 to 29 Years | 1,544 (89.9%) | 69 (4.5%) |
| 30 to 34 Years | 1,573 (94.9%) | 35 (2.2%) |
| 35 to 44 Years | 1,973 (93.0%) | 63 (3.2%) |
| 45 to 54 Years | 1,662 (91.1%) | 35 (2.1%) |
| 55 to 59 Years | 907 (84.1%) | 9 (1.0%) |
| 60 to 64 Years | 787 (71.2%) | 39 (5.0%) |
| 65 to 74 Years | 437 (33.6%) | 16 (3.7%) |
| 75 Years and over | 47 (6.4%) | 0 (0.0%) |
| Total | 9,498 (76.1%) | 285 (3.0%) |
Employment Status by Educational Attainment in Berkley
According to labor force statistics for Berkley, 88.8% of individuals (8,441) out of the total population between 25 and 64 years of age (9,506) are in the labor force, with 3.0% or 253 of them being unemployed. The group with the highest labor force participation rate are those with the educational attainment of less than high school, with 98.5% or 64 individuals in the labor force. Within the labor force, individuals with high school diploma education have the highest percentage of unemployment, with 8.7% or 71 of them being unemployed.
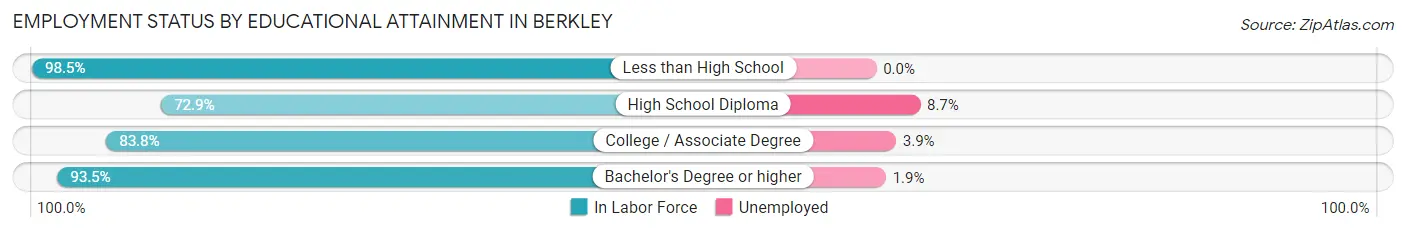
| Educational Attainment | In Labor Force | Unemployed |
| Less than High School | 64 (98.5%) | 0 (0.0%) |
| High School Diploma | 816 (72.9%) | 97 (8.7%) |
| College / Associate Degree | 1,880 (83.8%) | 88 (3.9%) |
| Bachelor's Degree or higher | 5,682 (93.5%) | 115 (1.9%) |
| Total | 8,441 (88.8%) | 285 (3.0%) |
Employment Occupations by Sex in Berkley
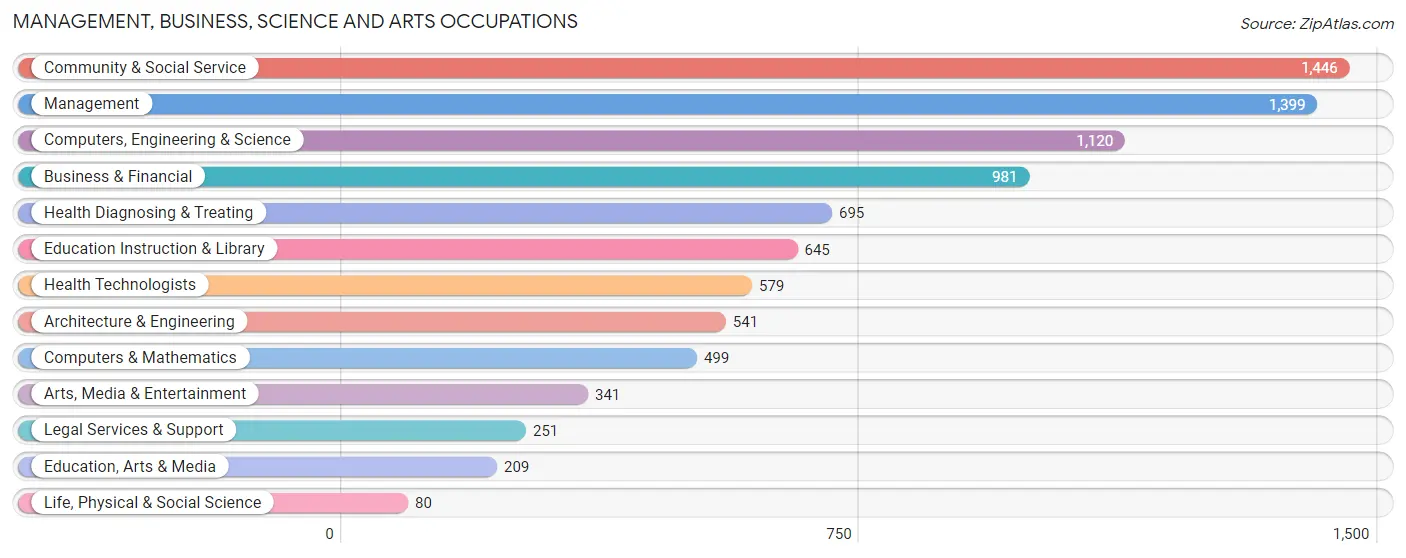
Management, Business, Science and Arts Occupations
The most common Management, Business, Science and Arts occupations in Berkley are Community & Social Service (1,446 | 15.7%), Management (1,399 | 15.2%), Computers, Engineering & Science (1,120 | 12.2%), Business & Financial (981 | 10.7%), and Health Diagnosing & Treating (695 | 7.5%).
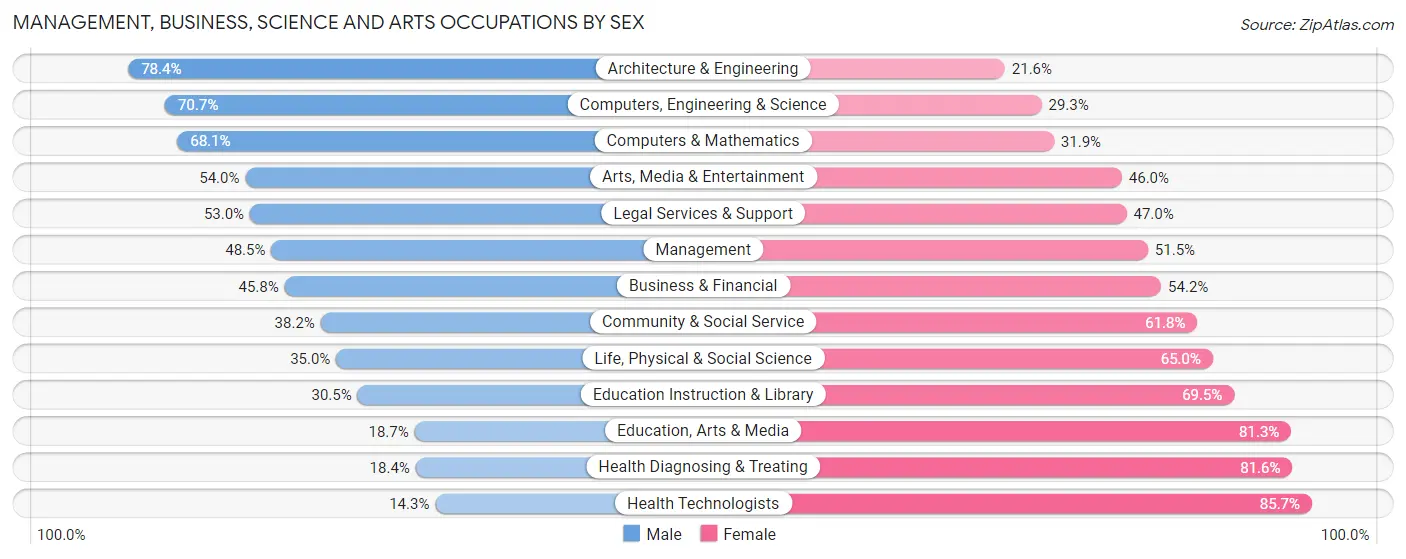
Management, Business, Science and Arts Occupations by Sex
Within the Management, Business, Science and Arts occupations in Berkley, the most male-oriented occupations are Architecture & Engineering (78.4%), Computers, Engineering & Science (70.7%), and Computers & Mathematics (68.1%), while the most female-oriented occupations are Health Technologists (85.7%), Health Diagnosing & Treating (81.6%), and Education, Arts & Media (81.3%).
| Occupation | Male | Female |
| Management | 679 (48.5%) | 720 (51.5%) |
| Business & Financial | 449 (45.8%) | 532 (54.2%) |
| Computers, Engineering & Science | 792 (70.7%) | 328 (29.3%) |
| Computers & Mathematics | 340 (68.1%) | 159 (31.9%) |
| Architecture & Engineering | 424 (78.4%) | 117 (21.6%) |
| Life, Physical & Social Science | 28 (35.0%) | 52 (65.0%) |
| Community & Social Service | 553 (38.2%) | 893 (61.8%) |
| Education, Arts & Media | 39 (18.7%) | 170 (81.3%) |
| Legal Services & Support | 133 (53.0%) | 118 (47.0%) |
| Education Instruction & Library | 197 (30.5%) | 448 (69.5%) |
| Arts, Media & Entertainment | 184 (54.0%) | 157 (46.0%) |
| Health Diagnosing & Treating | 128 (18.4%) | 567 (81.6%) |
| Health Technologists | 83 (14.3%) | 496 (85.7%) |
| Total (Category) | 2,601 (46.1%) | 3,040 (53.9%) |
| Total (Overall) | 4,770 (51.8%) | 4,433 (48.2%) |
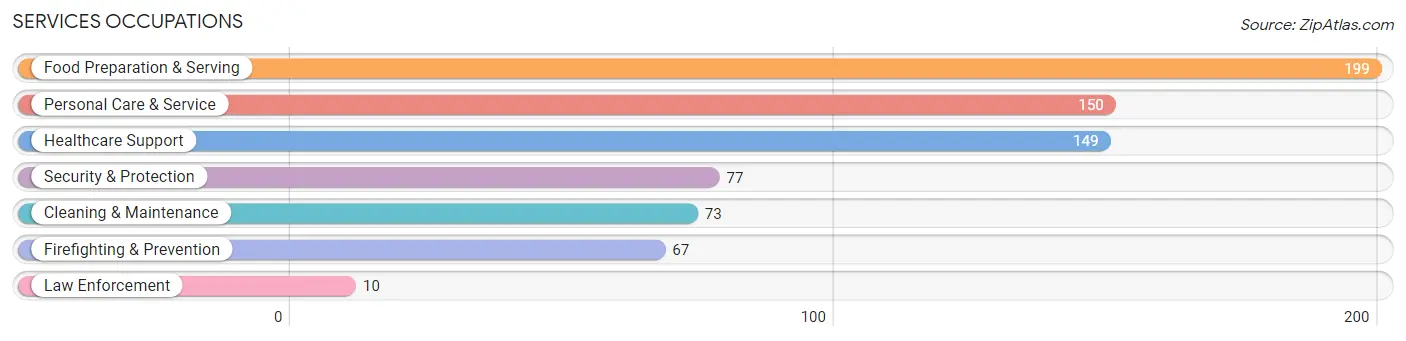
Services Occupations
The most common Services occupations in Berkley are Food Preparation & Serving (199 | 2.2%), Personal Care & Service (150 | 1.6%), Healthcare Support (149 | 1.6%), Security & Protection (77 | 0.8%), and Cleaning & Maintenance (73 | 0.8%).
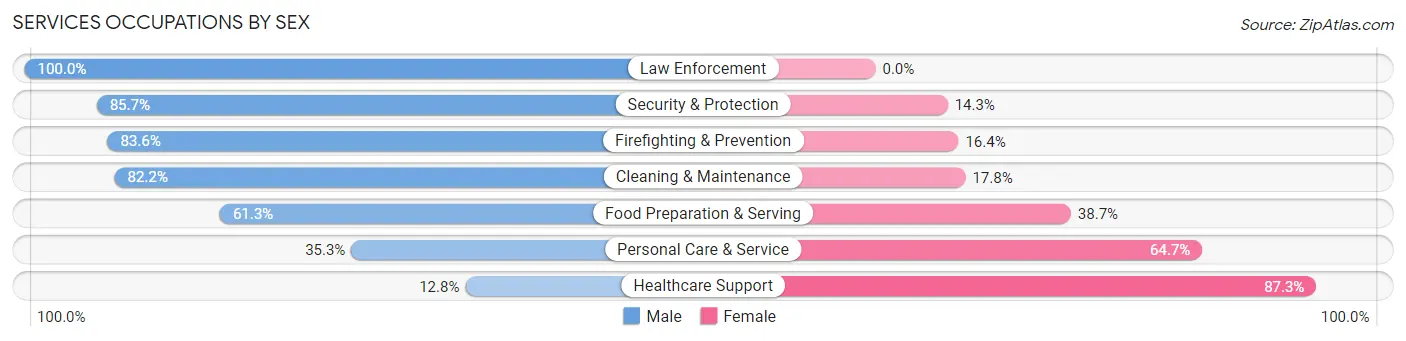
Services Occupations by Sex
Within the Services occupations in Berkley, the most male-oriented occupations are Law Enforcement (100.0%), Security & Protection (85.7%), and Firefighting & Prevention (83.6%), while the most female-oriented occupations are Healthcare Support (87.3%), Personal Care & Service (64.7%), and Food Preparation & Serving (38.7%).
| Occupation | Male | Female |
| Healthcare Support | 19 (12.8%) | 130 (87.3%) |
| Security & Protection | 66 (85.7%) | 11 (14.3%) |
| Firefighting & Prevention | 56 (83.6%) | 11 (16.4%) |
| Law Enforcement | 10 (100.0%) | 0 (0.0%) |
| Food Preparation & Serving | 122 (61.3%) | 77 (38.7%) |
| Cleaning & Maintenance | 60 (82.2%) | 13 (17.8%) |
| Personal Care & Service | 53 (35.3%) | 97 (64.7%) |
| Total (Category) | 320 (49.4%) | 328 (50.6%) |
| Total (Overall) | 4,770 (51.8%) | 4,433 (48.2%) |
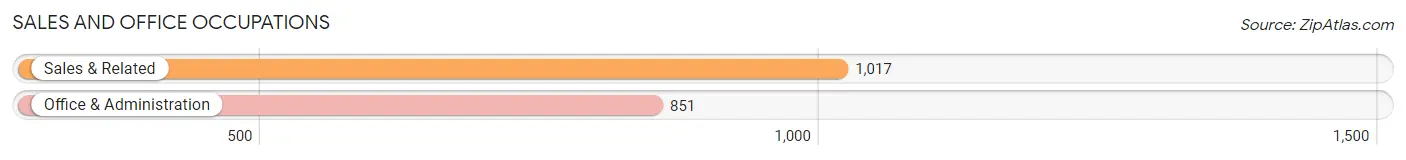
Sales and Office Occupations
The most common Sales and Office occupations in Berkley are Sales & Related (1,017 | 11.1%), and Office & Administration (851 | 9.2%).
Sales and Office Occupations by Sex
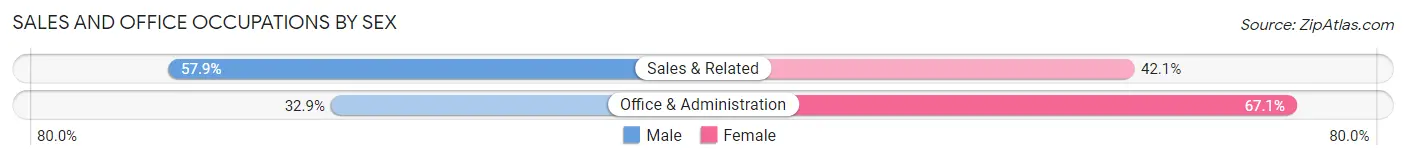
| Occupation | Male | Female |
| Sales & Related | 589 (57.9%) | 428 (42.1%) |
| Office & Administration | 280 (32.9%) | 571 (67.1%) |
| Total (Category) | 869 (46.5%) | 999 (53.5%) |
| Total (Overall) | 4,770 (51.8%) | 4,433 (48.2%) |
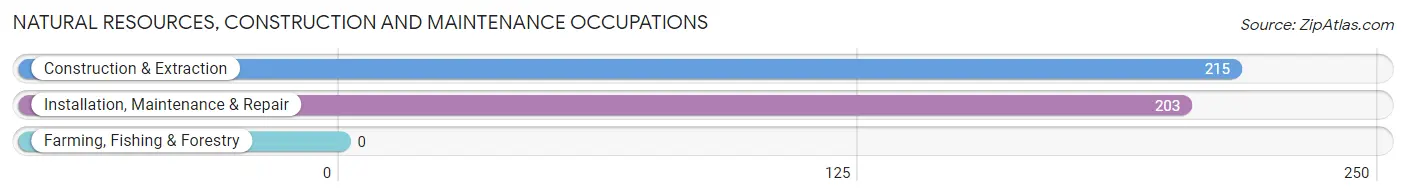
Natural Resources, Construction and Maintenance Occupations
The most common Natural Resources, Construction and Maintenance occupations in Berkley are Construction & Extraction (215 | 2.3%), and Installation, Maintenance & Repair (203 | 2.2%).
Natural Resources, Construction and Maintenance Occupations by Sex
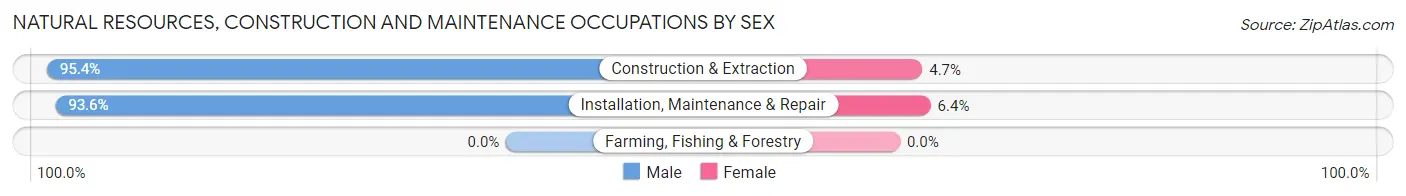
| Occupation | Male | Female |
| Farming, Fishing & Forestry | 0 (0.0%) | 0 (0.0%) |
| Construction & Extraction | 205 (95.4%) | 10 (4.6%) |
| Installation, Maintenance & Repair | 190 (93.6%) | 13 (6.4%) |
| Total (Category) | 395 (94.5%) | 23 (5.5%) |
| Total (Overall) | 4,770 (51.8%) | 4,433 (48.2%) |
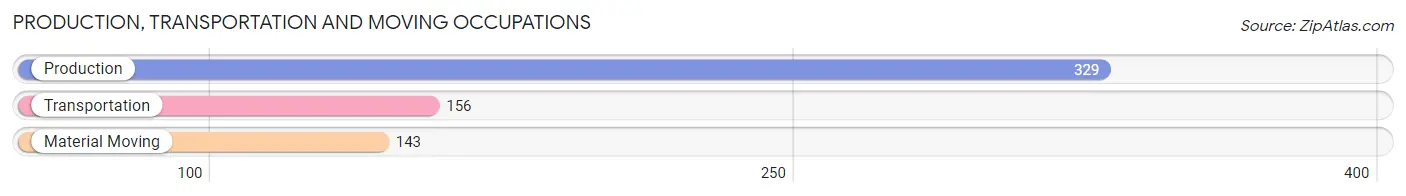
Production, Transportation and Moving Occupations
The most common Production, Transportation and Moving occupations in Berkley are Production (329 | 3.6%), Transportation (156 | 1.7%), and Material Moving (143 | 1.5%).
Production, Transportation and Moving Occupations by Sex
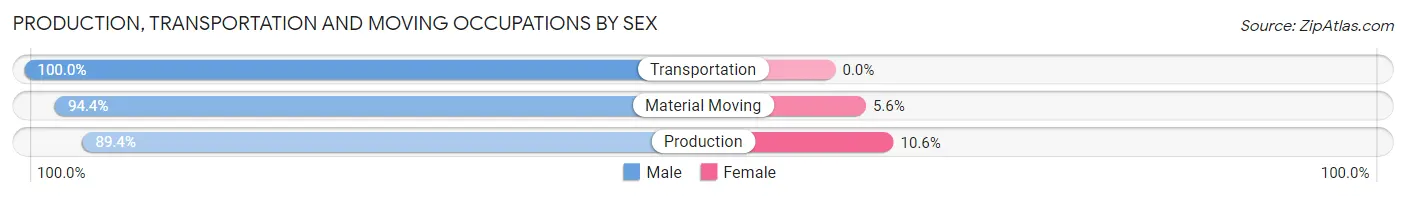
| Occupation | Male | Female |
| Production | 294 (89.4%) | 35 (10.6%) |
| Transportation | 156 (100.0%) | 0 (0.0%) |
| Material Moving | 135 (94.4%) | 8 (5.6%) |
| Total (Category) | 585 (93.1%) | 43 (6.9%) |
| Total (Overall) | 4,770 (51.8%) | 4,433 (48.2%) |
Employment Industries by Sex in Berkley
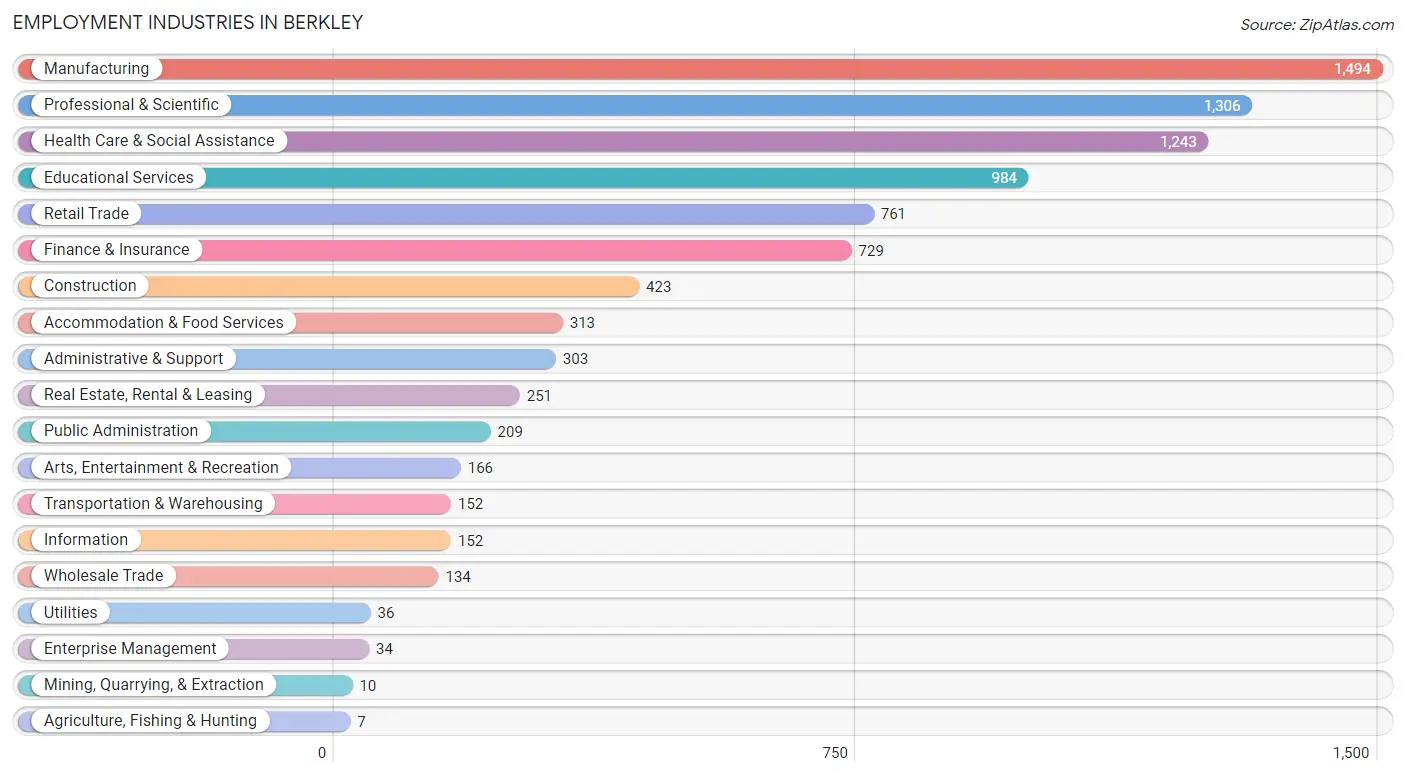
Employment Industries in Berkley
The major employment industries in Berkley include Manufacturing (1,494 | 16.2%), Professional & Scientific (1,306 | 14.2%), Health Care & Social Assistance (1,243 | 13.5%), Educational Services (984 | 10.7%), and Retail Trade (761 | 8.3%).
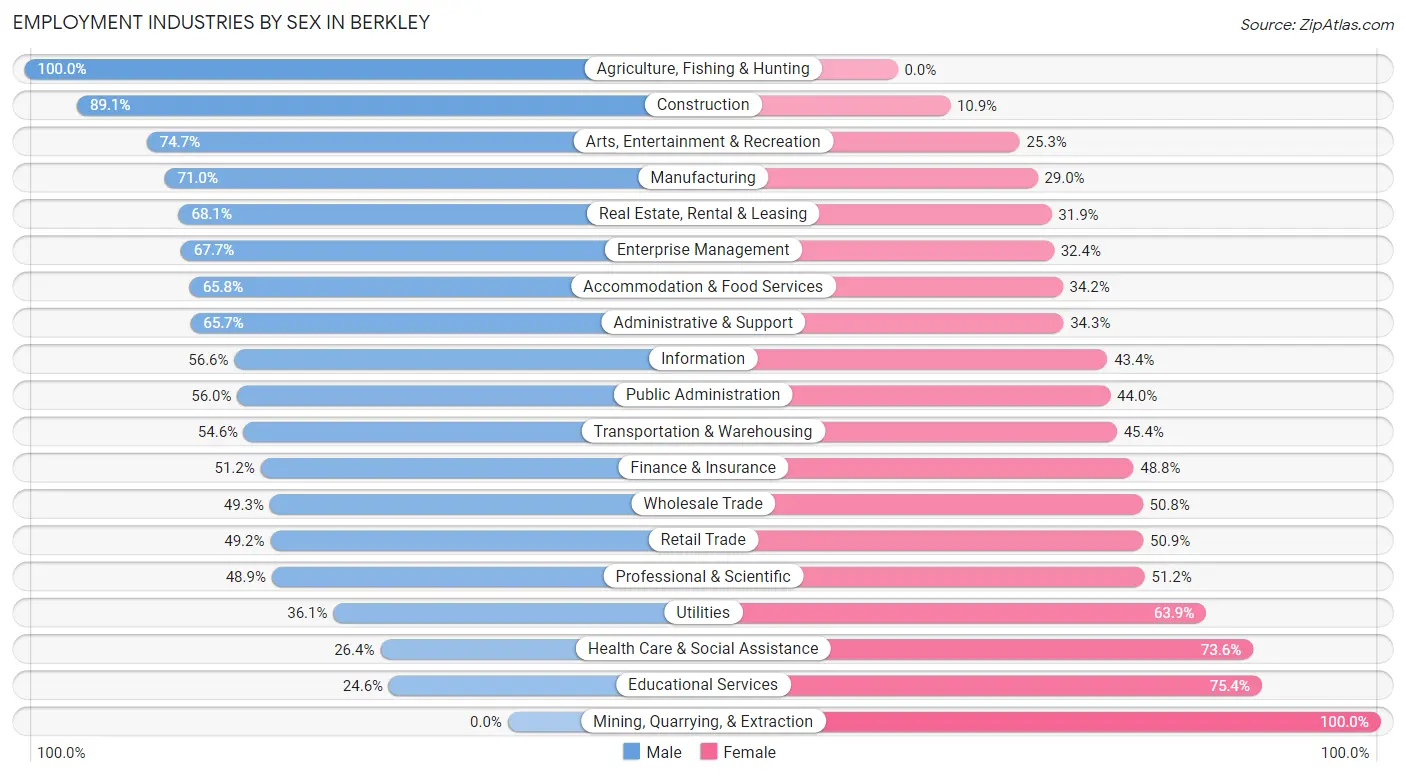
Employment Industries by Sex in Berkley
The Berkley industries that see more men than women are Agriculture, Fishing & Hunting (100.0%), Construction (89.1%), and Arts, Entertainment & Recreation (74.7%), whereas the industries that tend to have a higher number of women are Mining, Quarrying, & Extraction (100.0%), Educational Services (75.4%), and Health Care & Social Assistance (73.6%).
| Industry | Male | Female |
| Agriculture, Fishing & Hunting | 7 (100.0%) | 0 (0.0%) |
| Mining, Quarrying, & Extraction | 0 (0.0%) | 10 (100.0%) |
| Construction | 377 (89.1%) | 46 (10.9%) |
| Manufacturing | 1,061 (71.0%) | 433 (29.0%) |
| Wholesale Trade | 66 (49.2%) | 68 (50.7%) |
| Retail Trade | 374 (49.1%) | 387 (50.8%) |
| Transportation & Warehousing | 83 (54.6%) | 69 (45.4%) |
| Utilities | 13 (36.1%) | 23 (63.9%) |
| Information | 86 (56.6%) | 66 (43.4%) |
| Finance & Insurance | 373 (51.2%) | 356 (48.8%) |
| Real Estate, Rental & Leasing | 171 (68.1%) | 80 (31.9%) |
| Professional & Scientific | 638 (48.8%) | 668 (51.1%) |
| Enterprise Management | 23 (67.6%) | 11 (32.4%) |
| Administrative & Support | 199 (65.7%) | 104 (34.3%) |
| Educational Services | 242 (24.6%) | 742 (75.4%) |
| Health Care & Social Assistance | 328 (26.4%) | 915 (73.6%) |
| Arts, Entertainment & Recreation | 124 (74.7%) | 42 (25.3%) |
| Accommodation & Food Services | 206 (65.8%) | 107 (34.2%) |
| Public Administration | 117 (56.0%) | 92 (44.0%) |
| Total | 4,770 (51.8%) | 4,433 (48.2%) |
Education in Berkley
School Enrollment in Berkley
The most common levels of schooling among the 2,866 students in Berkley are high school (641 | 22.4%), middle school (525 | 18.3%), and elementary school (460 | 16.1%).
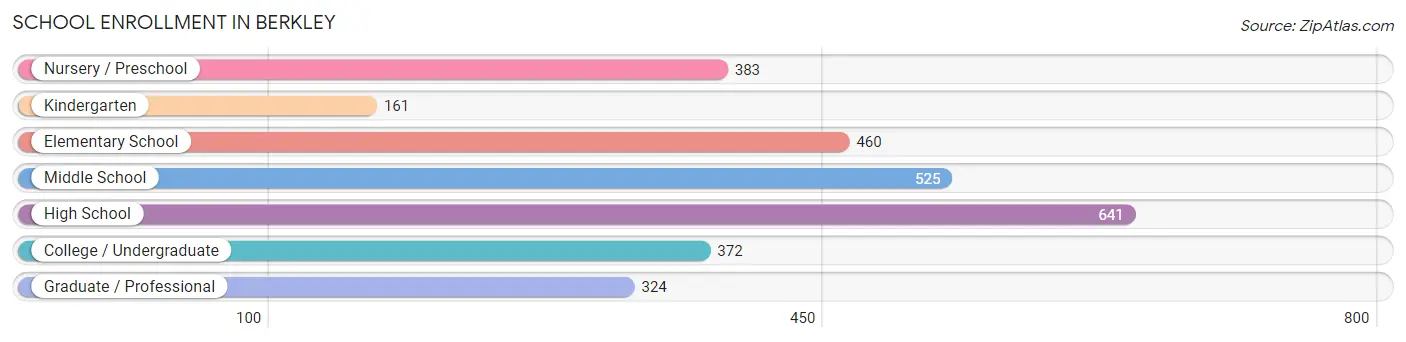
| School Level | # Students | % Students |
| Nursery / Preschool | 383 | 13.4% |
| Kindergarten | 161 | 5.6% |
| Elementary School | 460 | 16.1% |
| Middle School | 525 | 18.3% |
| High School | 641 | 22.4% |
| College / Undergraduate | 372 | 13.0% |
| Graduate / Professional | 324 | 11.3% |
| Total | 2,866 | 100.0% |
School Enrollment by Age by Funding Source in Berkley
Out of a total of 2,866 students who are enrolled in schools in Berkley, 504 (17.6%) attend a private institution, while the remaining 2,362 (82.4%) are enrolled in public schools. The age group of 20 to 24 year olds has the highest likelihood of being enrolled in private schools, with 80 (38.8% in the age bracket) enrolled. Conversely, the age group of 5 to 9 year old has the lowest likelihood of being enrolled in a private school, with 555 (94.1% in the age bracket) attending a public institution.
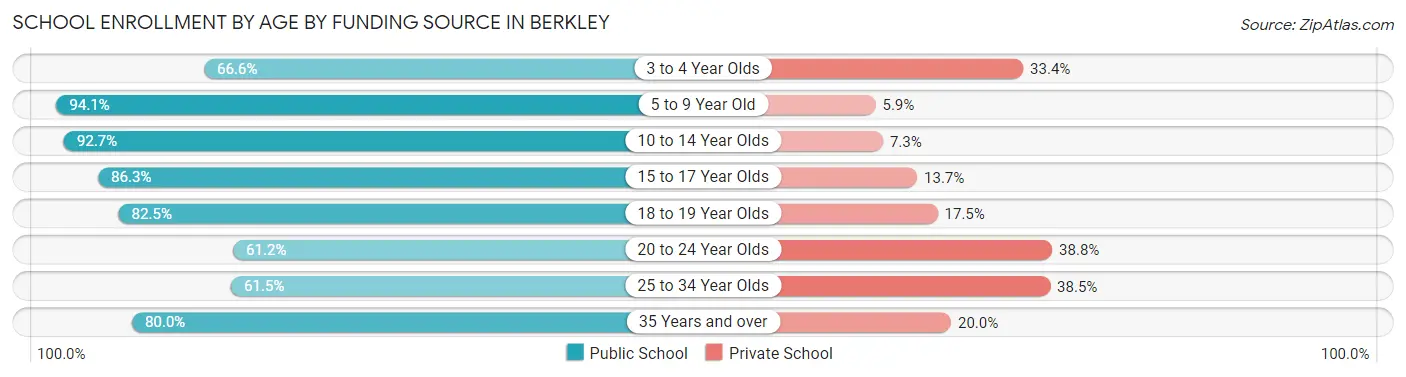
| Age Bracket | Public School | Private School |
| 3 to 4 Year Olds | 225 (66.6%) | 113 (33.4%) |
| 5 to 9 Year Old | 555 (94.1%) | 35 (5.9%) |
| 10 to 14 Year Olds | 633 (92.7%) | 50 (7.3%) |
| 15 to 17 Year Olds | 366 (86.3%) | 58 (13.7%) |
| 18 to 19 Year Olds | 132 (82.5%) | 28 (17.5%) |
| 20 to 24 Year Olds | 126 (61.2%) | 80 (38.8%) |
| 25 to 34 Year Olds | 160 (61.5%) | 100 (38.5%) |
| 35 Years and over | 164 (80.0%) | 41 (20.0%) |
| Total | 2,362 (82.4%) | 504 (17.6%) |
Educational Attainment by Field of Study in Berkley
Business (1,634 | 22.6%), science & technology (781 | 10.8%), education (713 | 9.9%), engineering (709 | 9.8%), and communications (611 | 8.4%) are the most common fields of study among 7,241 individuals in Berkley who have obtained a bachelor's degree or higher.
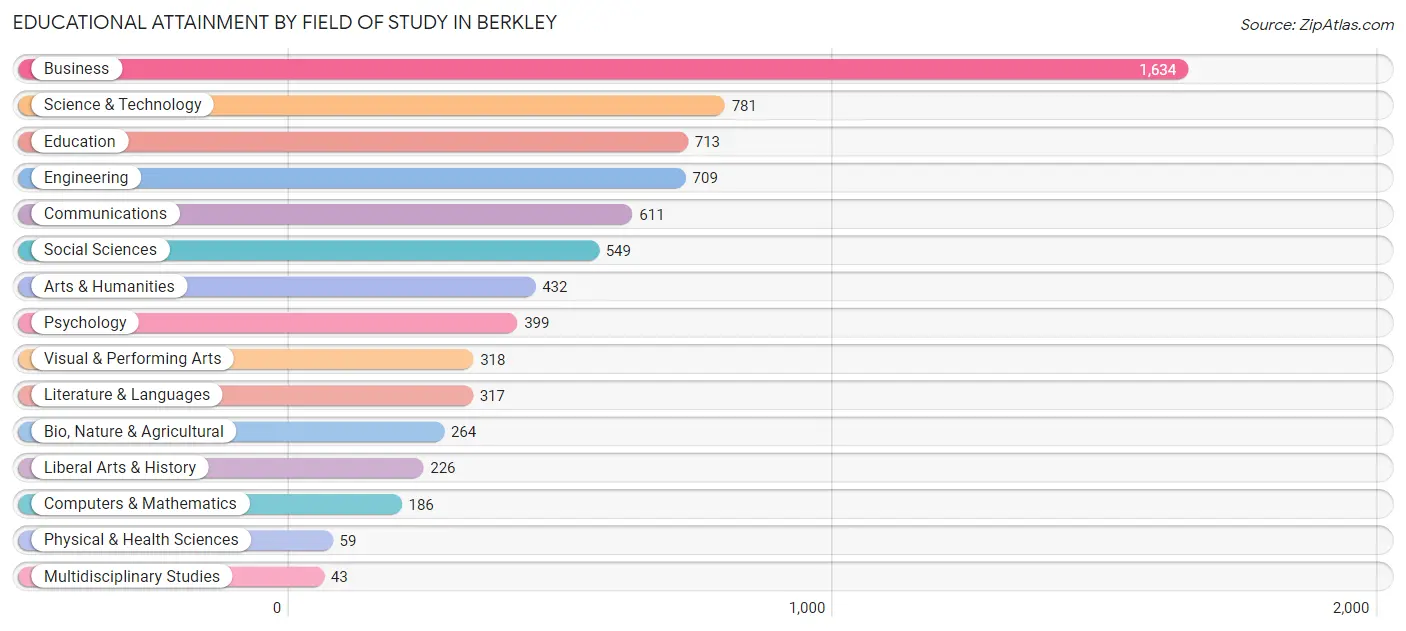
| Field of Study | # Graduates | % Graduates |
| Computers & Mathematics | 186 | 2.6% |
| Bio, Nature & Agricultural | 264 | 3.6% |
| Physical & Health Sciences | 59 | 0.8% |
| Psychology | 399 | 5.5% |
| Social Sciences | 549 | 7.6% |
| Engineering | 709 | 9.8% |
| Multidisciplinary Studies | 43 | 0.6% |
| Science & Technology | 781 | 10.8% |
| Business | 1,634 | 22.6% |
| Education | 713 | 9.9% |
| Literature & Languages | 317 | 4.4% |
| Liberal Arts & History | 226 | 3.1% |
| Visual & Performing Arts | 318 | 4.4% |
| Communications | 611 | 8.4% |
| Arts & Humanities | 432 | 6.0% |
| Total | 7,241 | 100.0% |
Transportation & Commute in Berkley
Vehicle Availability by Sex in Berkley
The most prevalent vehicle ownership categories in Berkley are males with 2 vehicles (3,023, accounting for 63.6%) and females with 2 vehicles (2,458, making up 69.7%).
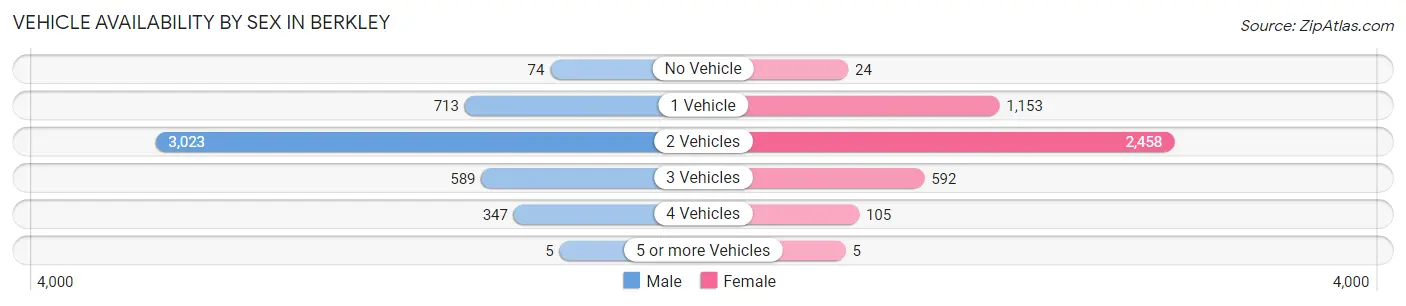
| Vehicles Available | Male | Female |
| No Vehicle | 74 (1.6%) | 24 (0.5%) |
| 1 Vehicle | 713 (15.0%) | 1,153 (26.6%) |
| 2 Vehicles | 3,023 (63.6%) | 2,458 (56.7%) |
| 3 Vehicles | 589 (12.4%) | 592 (13.7%) |
| 4 Vehicles | 347 (7.3%) | 105 (2.4%) |
| 5 or more Vehicles | 5 (0.1%) | 5 (0.1%) |
| Total | 4,751 (100.0%) | 4,337 (100.0%) |
Commute Time in Berkley
The most frequently occuring commute durations in Berkley are 30 to 34 minutes (1,438 commuters, 19.3%), 15 to 19 minutes (1,221 commuters, 16.4%), and 20 to 24 minutes (1,189 commuters, 16.0%).
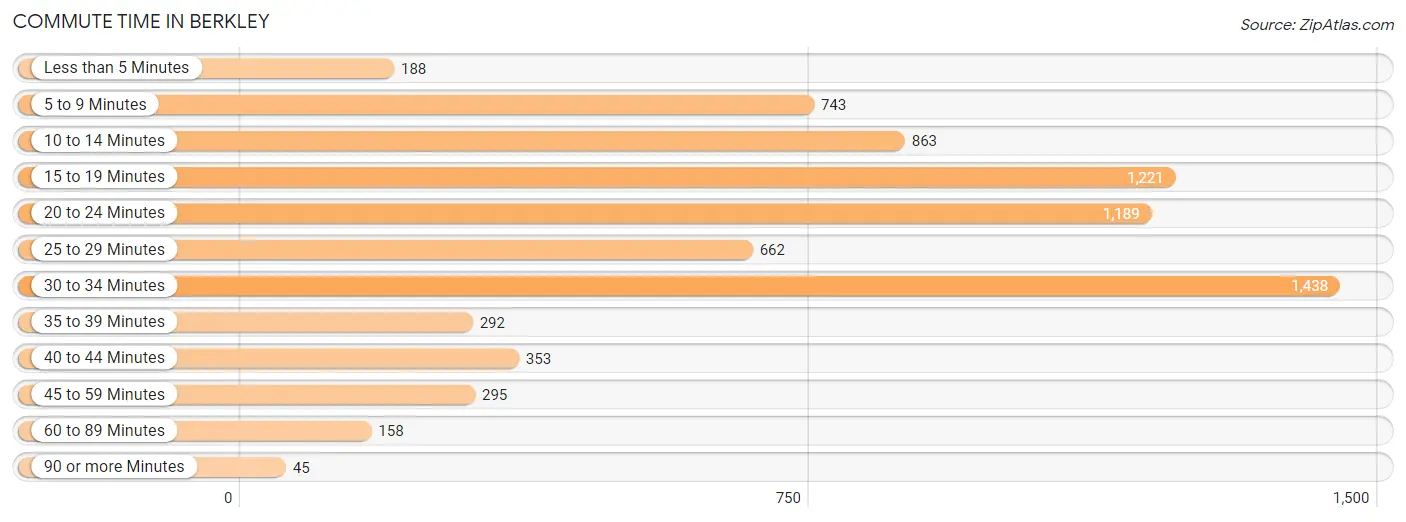
| Commute Time | # Commuters | % Commuters |
| Less than 5 Minutes | 188 | 2.5% |
| 5 to 9 Minutes | 743 | 10.0% |
| 10 to 14 Minutes | 863 | 11.6% |
| 15 to 19 Minutes | 1,221 | 16.4% |
| 20 to 24 Minutes | 1,189 | 16.0% |
| 25 to 29 Minutes | 662 | 8.9% |
| 30 to 34 Minutes | 1,438 | 19.3% |
| 35 to 39 Minutes | 292 | 3.9% |
| 40 to 44 Minutes | 353 | 4.7% |
| 45 to 59 Minutes | 295 | 4.0% |
| 60 to 89 Minutes | 158 | 2.1% |
| 90 or more Minutes | 45 | 0.6% |
Commute Time by Sex in Berkley
The most common commute times in Berkley are 30 to 34 minutes (932 commuters, 23.5%) for males and 15 to 19 minutes (726 commuters, 20.8%) for females.
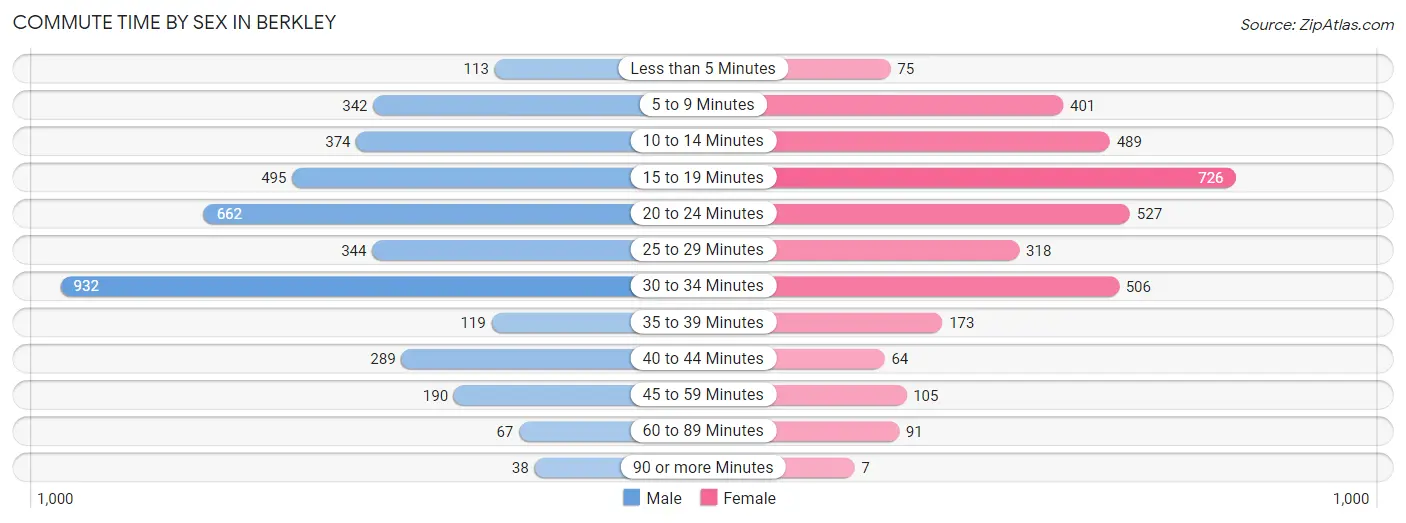
| Commute Time | Male | Female |
| Less than 5 Minutes | 113 (2.9%) | 75 (2.1%) |
| 5 to 9 Minutes | 342 (8.6%) | 401 (11.5%) |
| 10 to 14 Minutes | 374 (9.4%) | 489 (14.0%) |
| 15 to 19 Minutes | 495 (12.5%) | 726 (20.8%) |
| 20 to 24 Minutes | 662 (16.7%) | 527 (15.1%) |
| 25 to 29 Minutes | 344 (8.7%) | 318 (9.1%) |
| 30 to 34 Minutes | 932 (23.5%) | 506 (14.5%) |
| 35 to 39 Minutes | 119 (3.0%) | 173 (5.0%) |
| 40 to 44 Minutes | 289 (7.3%) | 64 (1.8%) |
| 45 to 59 Minutes | 190 (4.8%) | 105 (3.0%) |
| 60 to 89 Minutes | 67 (1.7%) | 91 (2.6%) |
| 90 or more Minutes | 38 (1.0%) | 7 (0.2%) |
Time of Departure to Work by Sex in Berkley
The most frequent times of departure to work in Berkley are 7:30 AM to 7:59 AM (766, 19.3%) for males and 7:30 AM to 7:59 AM (836, 24.0%) for females.
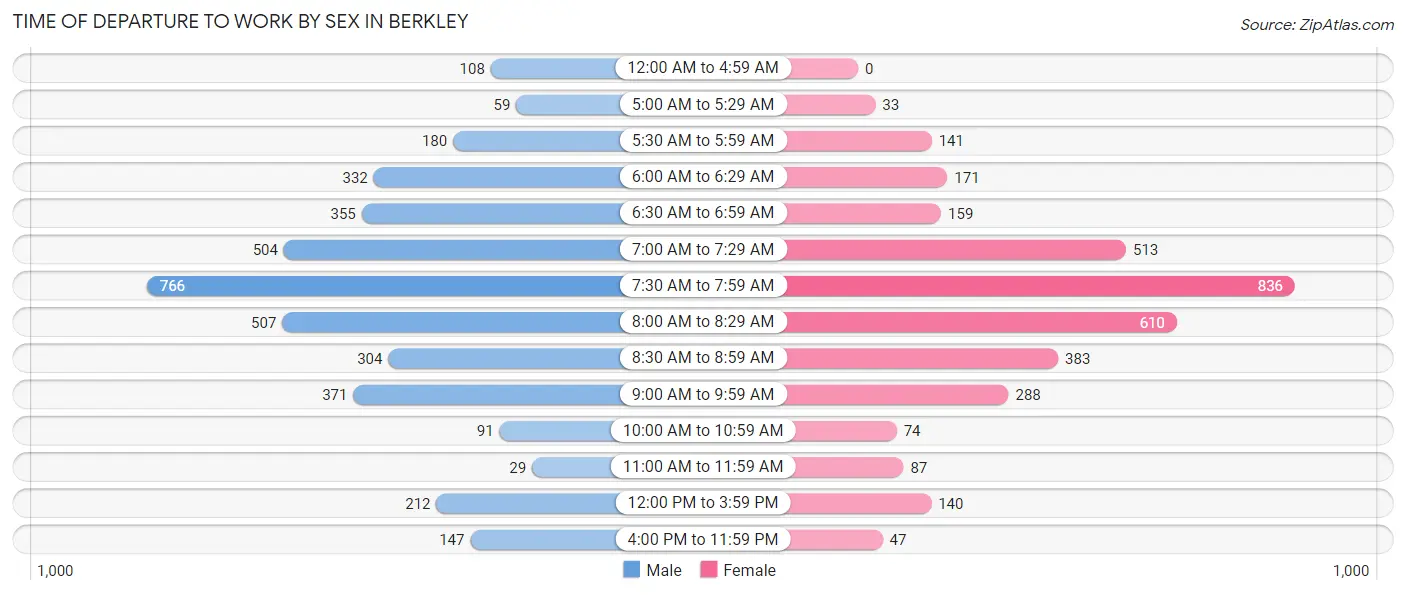
| Time of Departure | Male | Female |
| 12:00 AM to 4:59 AM | 108 (2.7%) | 0 (0.0%) |
| 5:00 AM to 5:29 AM | 59 (1.5%) | 33 (0.9%) |
| 5:30 AM to 5:59 AM | 180 (4.5%) | 141 (4.1%) |
| 6:00 AM to 6:29 AM | 332 (8.4%) | 171 (4.9%) |
| 6:30 AM to 6:59 AM | 355 (8.9%) | 159 (4.6%) |
| 7:00 AM to 7:29 AM | 504 (12.7%) | 513 (14.7%) |
| 7:30 AM to 7:59 AM | 766 (19.3%) | 836 (24.0%) |
| 8:00 AM to 8:29 AM | 507 (12.8%) | 610 (17.5%) |
| 8:30 AM to 8:59 AM | 304 (7.7%) | 383 (11.0%) |
| 9:00 AM to 9:59 AM | 371 (9.4%) | 288 (8.3%) |
| 10:00 AM to 10:59 AM | 91 (2.3%) | 74 (2.1%) |
| 11:00 AM to 11:59 AM | 29 (0.7%) | 87 (2.5%) |
| 12:00 PM to 3:59 PM | 212 (5.3%) | 140 (4.0%) |
| 4:00 PM to 11:59 PM | 147 (3.7%) | 47 (1.3%) |
| Total | 3,965 (100.0%) | 3,482 (100.0%) |
Housing Occupancy in Berkley
Occupancy by Ownership in Berkley
Of the total 6,954 dwellings in Berkley, owner-occupied units account for 5,912 (85.0%), while renter-occupied units make up 1,042 (15.0%).
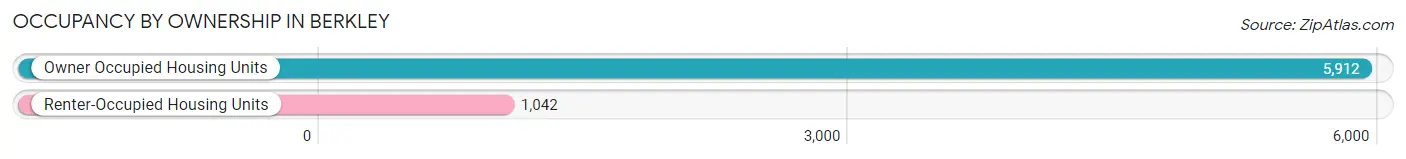
| Occupancy | # Housing Units | % Housing Units |
| Owner Occupied Housing Units | 5,912 | 85.0% |
| Renter-Occupied Housing Units | 1,042 | 15.0% |
| Total Occupied Housing Units | 6,954 | 100.0% |
Occupancy by Household Size in Berkley
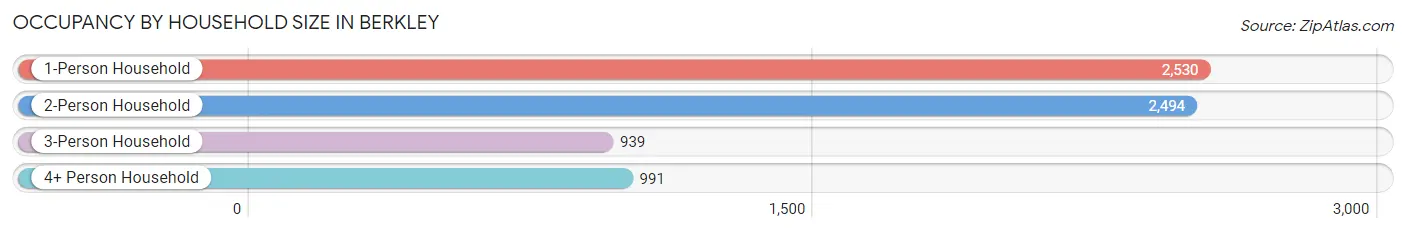
| Household Size | # Housing Units | % Housing Units |
| 1-Person Household | 2,530 | 36.4% |
| 2-Person Household | 2,494 | 35.9% |
| 3-Person Household | 939 | 13.5% |
| 4+ Person Household | 991 | 14.2% |
| Total Housing Units | 6,954 | 100.0% |
Occupancy by Ownership by Household Size in Berkley
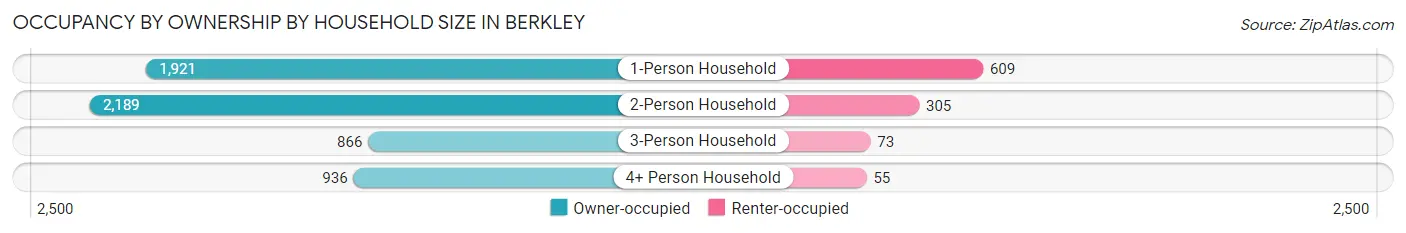
| Household Size | Owner-occupied | Renter-occupied |
| 1-Person Household | 1,921 (75.9%) | 609 (24.1%) |
| 2-Person Household | 2,189 (87.8%) | 305 (12.2%) |
| 3-Person Household | 866 (92.2%) | 73 (7.8%) |
| 4+ Person Household | 936 (94.5%) | 55 (5.6%) |
| Total Housing Units | 5,912 (85.0%) | 1,042 (15.0%) |
Occupancy by Educational Attainment in Berkley
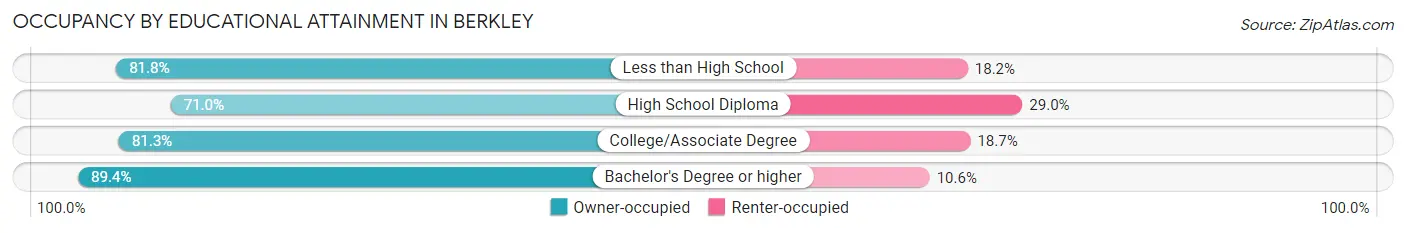
| Household Size | Owner-occupied | Renter-occupied |
| Less than High School | 54 (81.8%) | 12 (18.2%) |
| High School Diploma | 539 (71.0%) | 220 (29.0%) |
| College/Associate Degree | 1,600 (81.3%) | 368 (18.7%) |
| Bachelor's Degree or higher | 3,719 (89.4%) | 442 (10.6%) |
Occupancy by Age of Householder in Berkley
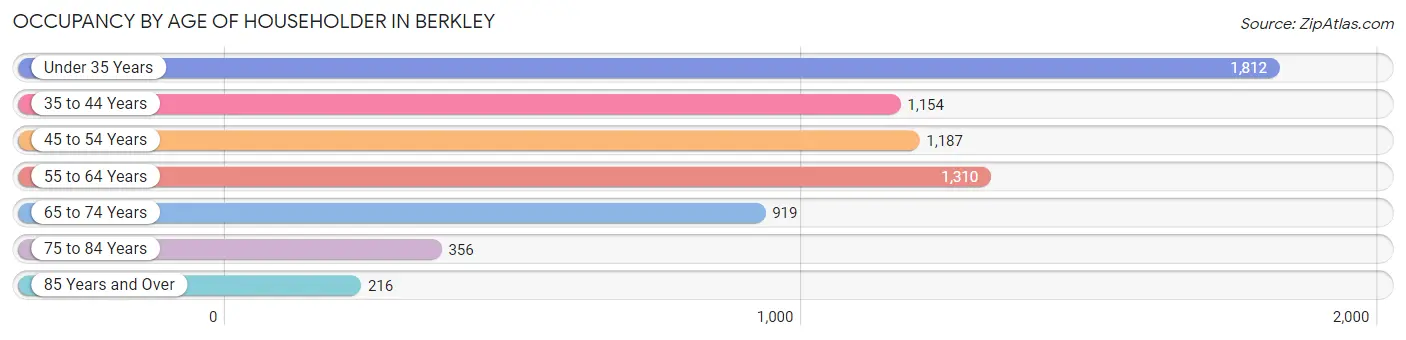
| Age Bracket | # Households | % Households |
| Under 35 Years | 1,812 | 26.1% |
| 35 to 44 Years | 1,154 | 16.6% |
| 45 to 54 Years | 1,187 | 17.1% |
| 55 to 64 Years | 1,310 | 18.8% |
| 65 to 74 Years | 919 | 13.2% |
| 75 to 84 Years | 356 | 5.1% |
| 85 Years and Over | 216 | 3.1% |
| Total | 6,954 | 100.0% |
Housing Finances in Berkley
Median Income by Occupancy in Berkley
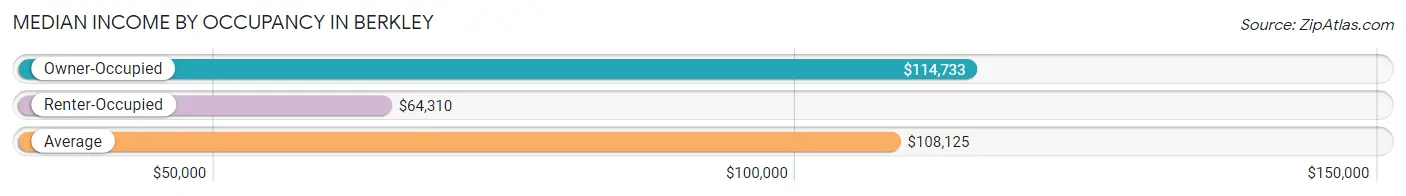
| Occupancy Type | # Households | Median Income |
| Owner-Occupied | 5,912 (85.0%) | $114,733 |
| Renter-Occupied | 1,042 (15.0%) | $64,310 |
| Average | 6,954 (100.0%) | $108,125 |
Occupancy by Householder Income Bracket in Berkley
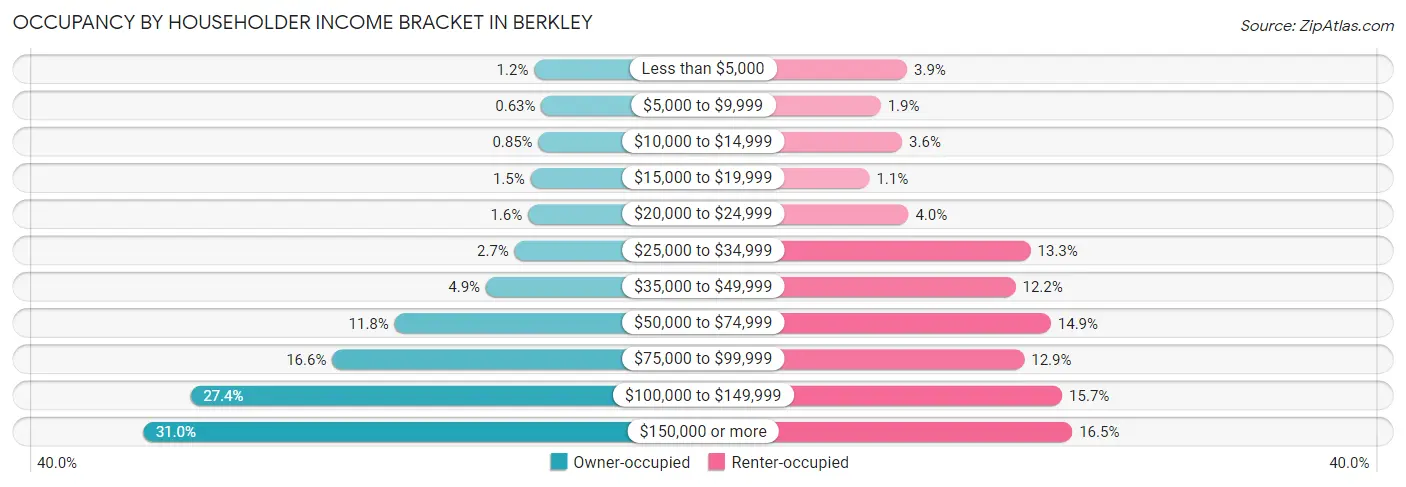
| Income Bracket | Owner-occupied | Renter-occupied |
| Less than $5,000 | 69 (1.2%) | 41 (3.9%) |
| $5,000 to $9,999 | 37 (0.6%) | 20 (1.9%) |
| $10,000 to $14,999 | 50 (0.9%) | 37 (3.5%) |
| $15,000 to $19,999 | 86 (1.5%) | 11 (1.1%) |
| $20,000 to $24,999 | 97 (1.6%) | 42 (4.0%) |
| $25,000 to $34,999 | 157 (2.7%) | 139 (13.3%) |
| $35,000 to $49,999 | 287 (4.9%) | 127 (12.2%) |
| $50,000 to $74,999 | 698 (11.8%) | 155 (14.9%) |
| $75,000 to $99,999 | 979 (16.6%) | 134 (12.9%) |
| $100,000 to $149,999 | 1,619 (27.4%) | 164 (15.7%) |
| $150,000 or more | 1,833 (31.0%) | 172 (16.5%) |
| Total | 5,912 (100.0%) | 1,042 (100.0%) |
Monthly Housing Cost Tiers in Berkley
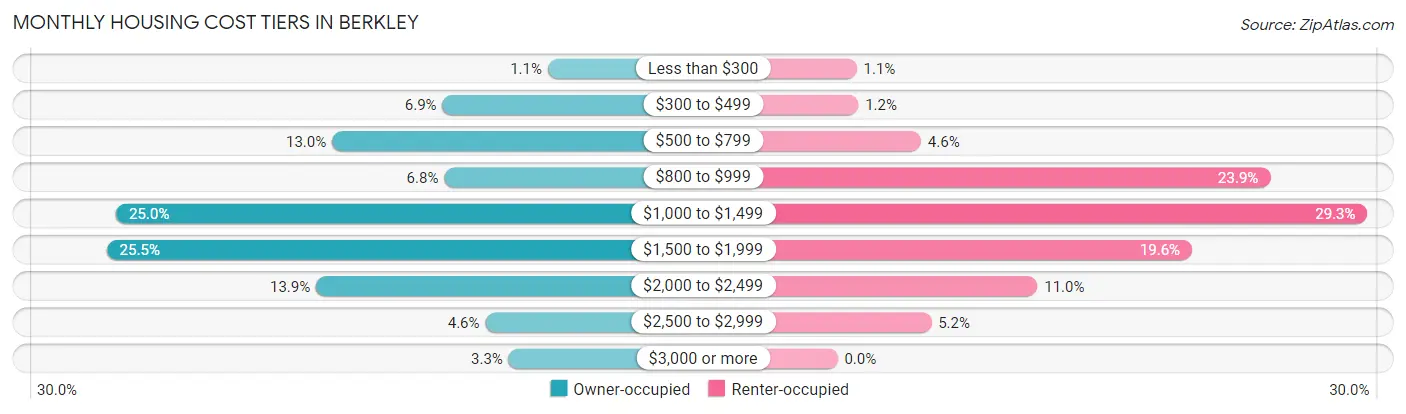
| Monthly Cost | Owner-occupied | Renter-occupied |
| Less than $300 | 65 (1.1%) | 11 (1.1%) |
| $300 to $499 | 409 (6.9%) | 12 (1.1%) |
| $500 to $799 | 770 (13.0%) | 48 (4.6%) |
| $800 to $999 | 403 (6.8%) | 249 (23.9%) |
| $1,000 to $1,499 | 1,475 (24.9%) | 305 (29.3%) |
| $1,500 to $1,999 | 1,506 (25.5%) | 204 (19.6%) |
| $2,000 to $2,499 | 822 (13.9%) | 115 (11.0%) |
| $2,500 to $2,999 | 269 (4.5%) | 54 (5.2%) |
| $3,000 or more | 193 (3.3%) | 0 (0.0%) |
| Total | 5,912 (100.0%) | 1,042 (100.0%) |
Physical Housing Characteristics in Berkley
Housing Structures in Berkley
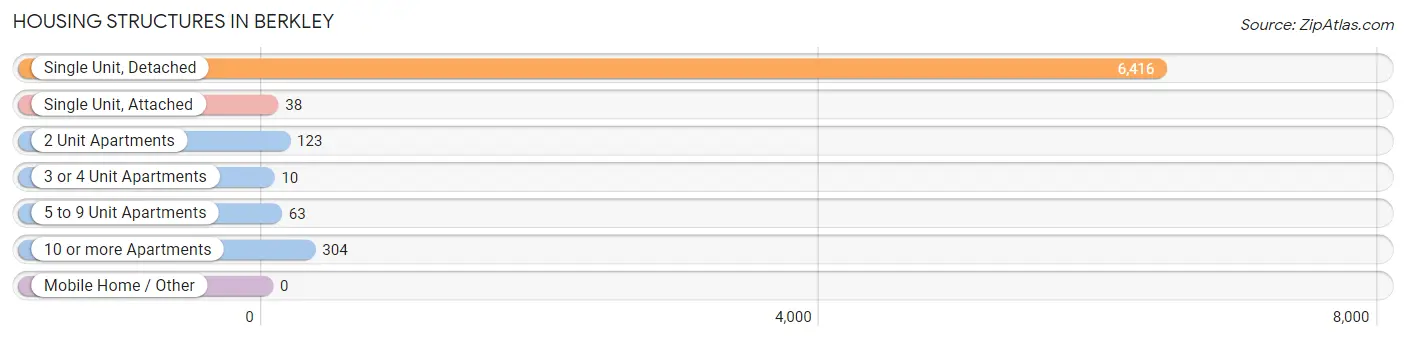
| Structure Type | # Housing Units | % Housing Units |
| Single Unit, Detached | 6,416 | 92.3% |
| Single Unit, Attached | 38 | 0.5% |
| 2 Unit Apartments | 123 | 1.8% |
| 3 or 4 Unit Apartments | 10 | 0.1% |
| 5 to 9 Unit Apartments | 63 | 0.9% |
| 10 or more Apartments | 304 | 4.4% |
| Mobile Home / Other | 0 | 0.0% |
| Total | 6,954 | 100.0% |
Housing Structures by Occupancy in Berkley
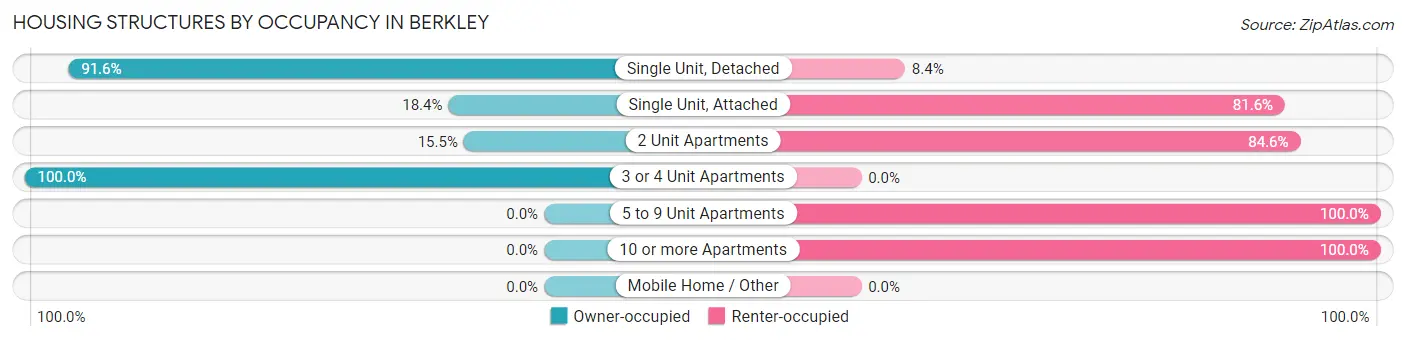
| Structure Type | Owner-occupied | Renter-occupied |
| Single Unit, Detached | 5,876 (91.6%) | 540 (8.4%) |
| Single Unit, Attached | 7 (18.4%) | 31 (81.6%) |
| 2 Unit Apartments | 19 (15.4%) | 104 (84.6%) |
| 3 or 4 Unit Apartments | 10 (100.0%) | 0 (0.0%) |
| 5 to 9 Unit Apartments | 0 (0.0%) | 63 (100.0%) |
| 10 or more Apartments | 0 (0.0%) | 304 (100.0%) |
| Mobile Home / Other | 0 (0.0%) | 0 (0.0%) |
| Total | 5,912 (85.0%) | 1,042 (15.0%) |
Housing Structures by Number of Rooms in Berkley
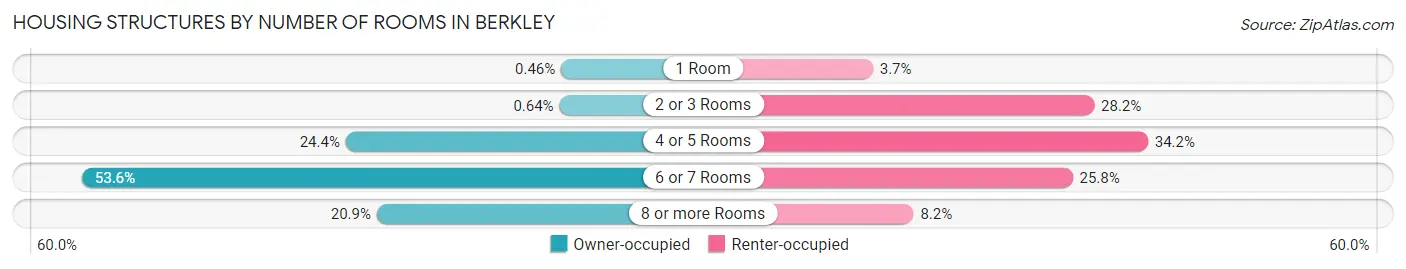
| Number of Rooms | Owner-occupied | Renter-occupied |
| 1 Room | 27 (0.5%) | 38 (3.6%) |
| 2 or 3 Rooms | 38 (0.6%) | 294 (28.2%) |
| 4 or 5 Rooms | 1,440 (24.4%) | 356 (34.2%) |
| 6 or 7 Rooms | 3,171 (53.6%) | 269 (25.8%) |
| 8 or more Rooms | 1,236 (20.9%) | 85 (8.2%) |
| Total | 5,912 (100.0%) | 1,042 (100.0%) |
Housing Structure by Heating Type in Berkley
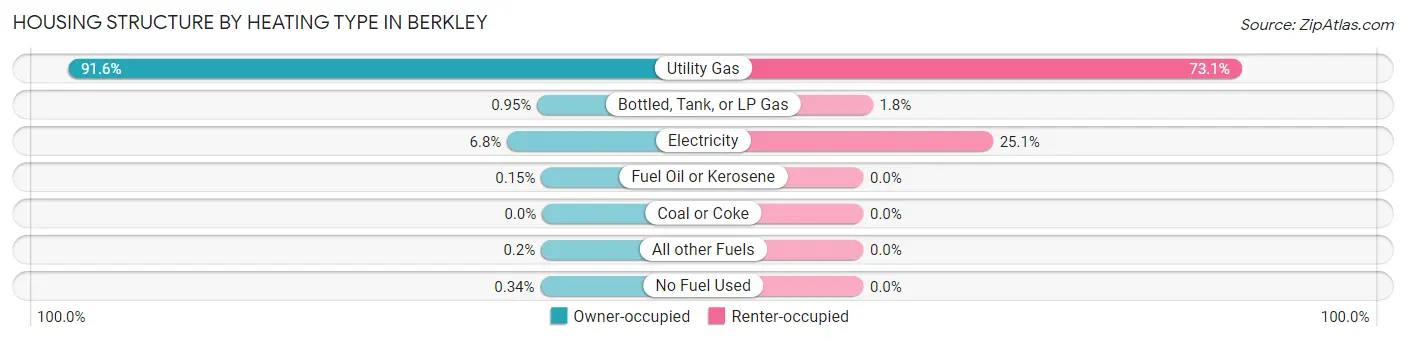
| Heating Type | Owner-occupied | Renter-occupied |
| Utility Gas | 5,416 (91.6%) | 762 (73.1%) |
| Bottled, Tank, or LP Gas | 56 (0.9%) | 19 (1.8%) |
| Electricity | 399 (6.8%) | 261 (25.1%) |
| Fuel Oil or Kerosene | 9 (0.2%) | 0 (0.0%) |
| Coal or Coke | 0 (0.0%) | 0 (0.0%) |
| All other Fuels | 12 (0.2%) | 0 (0.0%) |
| No Fuel Used | 20 (0.3%) | 0 (0.0%) |
| Total | 5,912 (100.0%) | 1,042 (100.0%) |
Household Vehicle Usage in Berkley
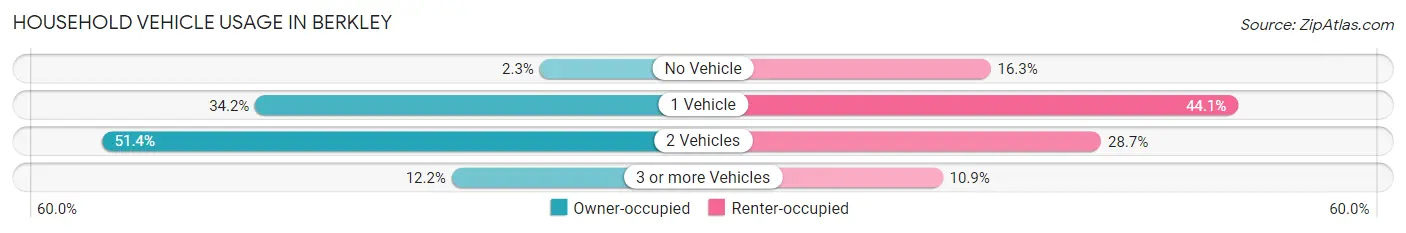
| Vehicles per Household | Owner-occupied | Renter-occupied |
| No Vehicle | 136 (2.3%) | 170 (16.3%) |
| 1 Vehicle | 2,020 (34.2%) | 459 (44.1%) |
| 2 Vehicles | 3,037 (51.4%) | 299 (28.7%) |
| 3 or more Vehicles | 719 (12.2%) | 114 (10.9%) |
| Total | 5,912 (100.0%) | 1,042 (100.0%) |
Real Estate & Mortgages in Berkley
Real Estate and Mortgage Overview in Berkley
| Characteristic | Without Mortgage | With Mortgage |
| Housing Units | 1,477 | 4,435 |
| Median Property Value | $241,000 | $286,900 |
| Median Household Income | $81,625 | $1,542 |
| Monthly Housing Costs | $589 | $193 |
| Real Estate Taxes | $3,379 | $93 |
Property Value by Mortgage Status in Berkley
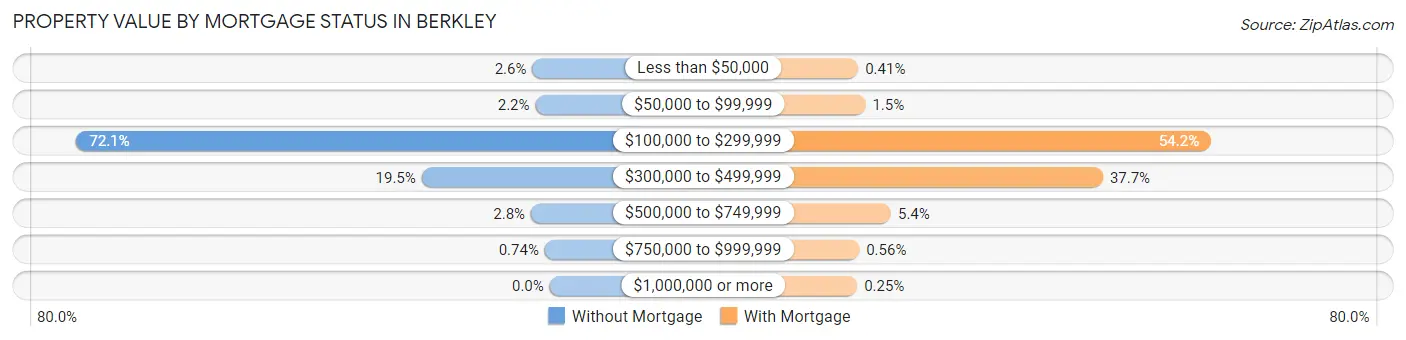
| Property Value | Without Mortgage | With Mortgage |
| Less than $50,000 | 39 (2.6%) | 18 (0.4%) |
| $50,000 to $99,999 | 32 (2.2%) | 67 (1.5%) |
| $100,000 to $299,999 | 1,065 (72.1%) | 2,402 (54.2%) |
| $300,000 to $499,999 | 288 (19.5%) | 1,672 (37.7%) |
| $500,000 to $749,999 | 42 (2.8%) | 240 (5.4%) |
| $750,000 to $999,999 | 11 (0.7%) | 25 (0.6%) |
| $1,000,000 or more | 0 (0.0%) | 11 (0.3%) |
| Total | 1,477 (100.0%) | 4,435 (100.0%) |
Household Income by Mortgage Status in Berkley
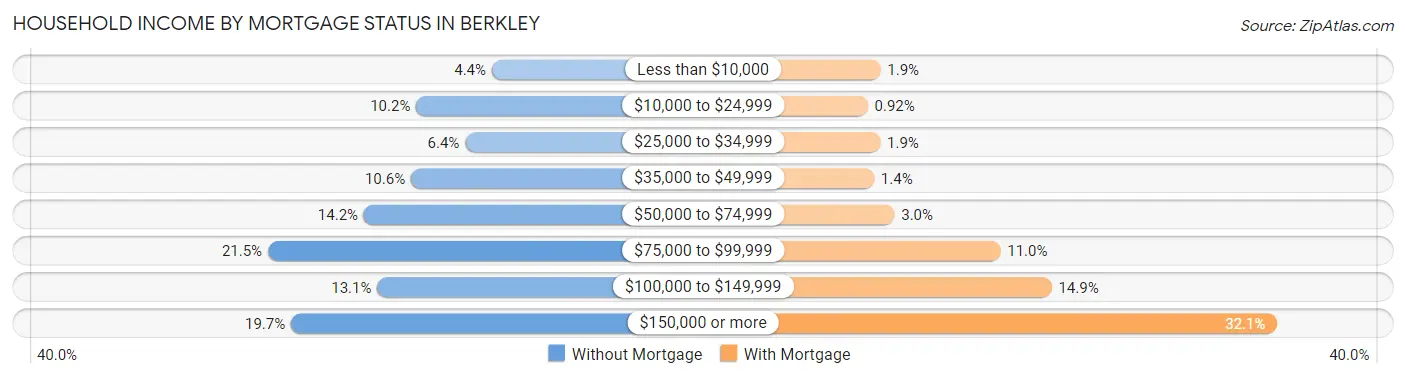
| Household Income | Without Mortgage | With Mortgage |
| Less than $10,000 | 65 (4.4%) | 84 (1.9%) |
| $10,000 to $24,999 | 150 (10.2%) | 41 (0.9%) |
| $25,000 to $34,999 | 95 (6.4%) | 83 (1.9%) |
| $35,000 to $49,999 | 156 (10.6%) | 62 (1.4%) |
| $50,000 to $74,999 | 209 (14.1%) | 131 (2.9%) |
| $75,000 to $99,999 | 317 (21.5%) | 489 (11.0%) |
| $100,000 to $149,999 | 194 (13.1%) | 662 (14.9%) |
| $150,000 or more | 291 (19.7%) | 1,425 (32.1%) |
| Total | 1,477 (100.0%) | 4,435 (100.0%) |
Property Value to Household Income Ratio in Berkley
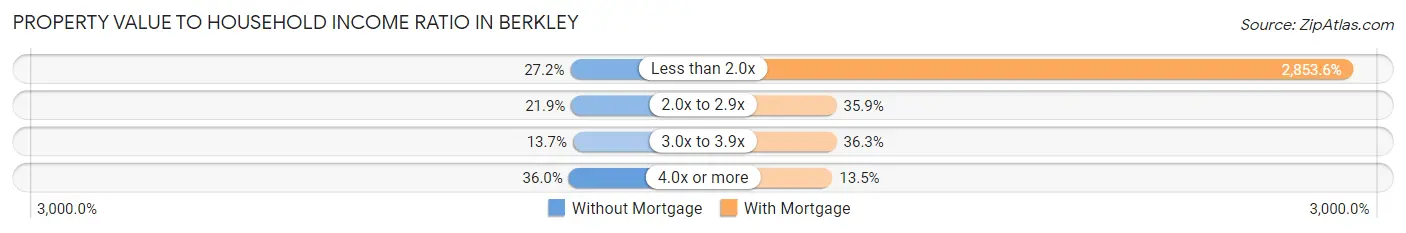
| Value-to-Income Ratio | Without Mortgage | With Mortgage |
| Less than 2.0x | 401 (27.2%) | 126,555 (2,853.5%) |
| 2.0x to 2.9x | 324 (21.9%) | 1,593 (35.9%) |
| 3.0x to 3.9x | 202 (13.7%) | 1,611 (36.3%) |
| 4.0x or more | 531 (35.9%) | 600 (13.5%) |
| Total | 1,477 (100.0%) | 4,435 (100.0%) |
Real Estate Taxes by Mortgage Status in Berkley
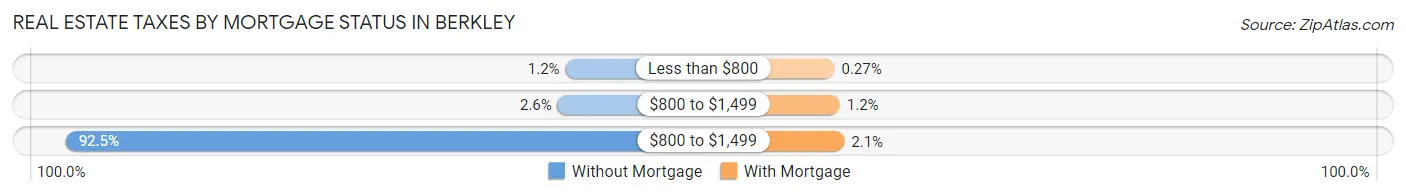
| Property Taxes | Without Mortgage | With Mortgage |
| Less than $800 | 18 (1.2%) | 12 (0.3%) |
| $800 to $1,499 | 39 (2.6%) | 55 (1.2%) |
| $800 to $1,499 | 1,366 (92.5%) | 92 (2.1%) |
| Total | 1,477 (100.0%) | 4,435 (100.0%) |
Health & Disability in Berkley
Health Insurance Coverage by Age in Berkley
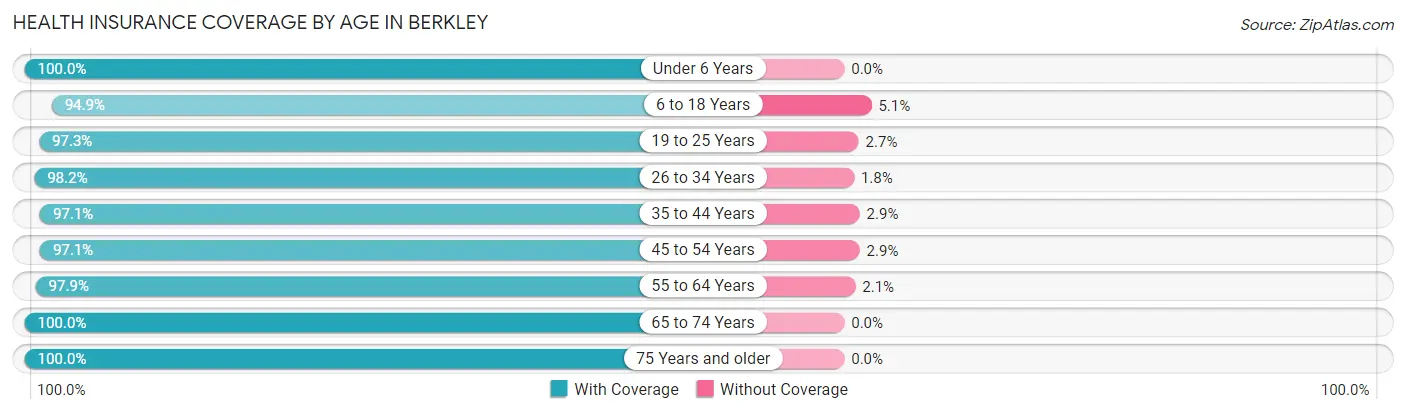
| Age Bracket | With Coverage | Without Coverage |
| Under 6 Years | 1,245 (100.0%) | 0 (0.0%) |
| 6 to 18 Years | 1,764 (94.9%) | 94 (5.1%) |
| 19 to 25 Years | 908 (97.3%) | 25 (2.7%) |
| 26 to 34 Years | 2,899 (98.2%) | 53 (1.8%) |
| 35 to 44 Years | 2,061 (97.1%) | 61 (2.9%) |
| 45 to 54 Years | 1,762 (97.1%) | 52 (2.9%) |
| 55 to 64 Years | 2,140 (97.9%) | 45 (2.1%) |
| 65 to 74 Years | 1,302 (100.0%) | 0 (0.0%) |
| 75 Years and older | 729 (100.0%) | 0 (0.0%) |
| Total | 14,810 (97.8%) | 330 (2.2%) |
Health Insurance Coverage by Citizenship Status in Berkley
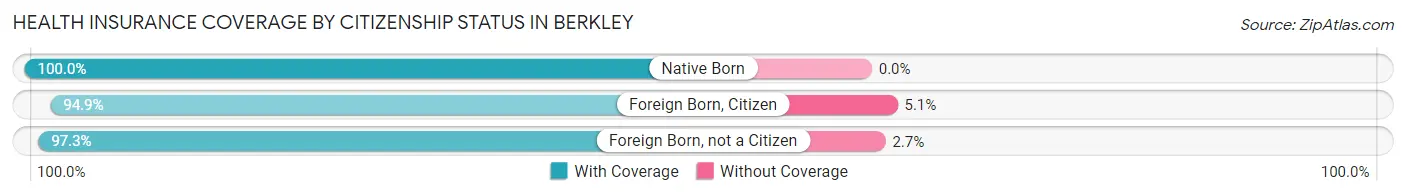
| Citizenship Status | With Coverage | Without Coverage |
| Native Born | 1,245 (100.0%) | 0 (0.0%) |
| Foreign Born, Citizen | 1,764 (94.9%) | 94 (5.1%) |
| Foreign Born, not a Citizen | 908 (97.3%) | 25 (2.7%) |
Health Insurance Coverage by Household Income in Berkley
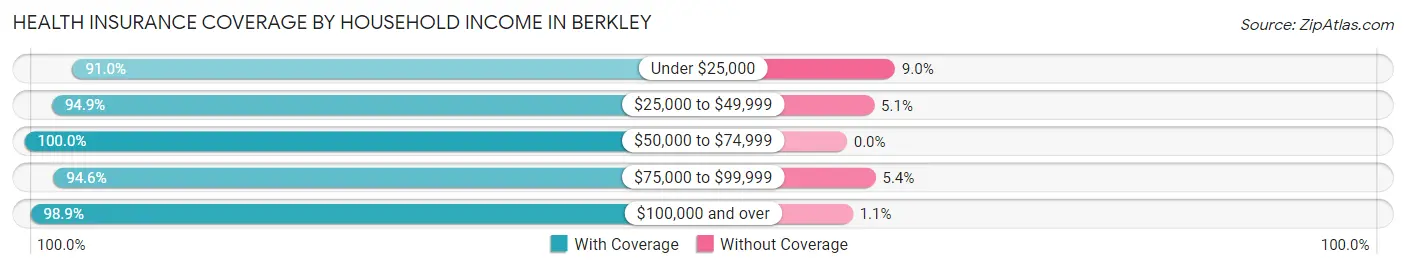
| Household Income | With Coverage | Without Coverage |
| Under $25,000 | 586 (91.0%) | 58 (9.0%) |
| $25,000 to $49,999 | 870 (94.9%) | 47 (5.1%) |
| $50,000 to $74,999 | 1,491 (100.0%) | 0 (0.0%) |
| $75,000 to $99,999 | 2,022 (94.6%) | 115 (5.4%) |
| $100,000 and over | 9,819 (98.9%) | 110 (1.1%) |
Public vs Private Health Insurance Coverage by Age in Berkley
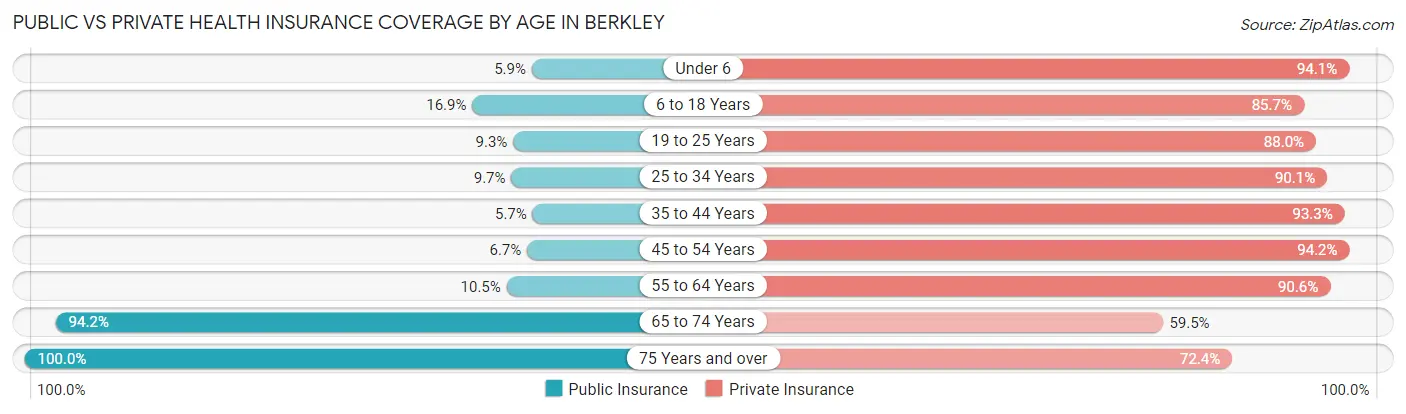
| Age Bracket | Public Insurance | Private Insurance |
| Under 6 | 73 (5.9%) | 1,172 (94.1%) |
| 6 to 18 Years | 314 (16.9%) | 1,593 (85.7%) |
| 19 to 25 Years | 87 (9.3%) | 821 (88.0%) |
| 25 to 34 Years | 285 (9.7%) | 2,659 (90.1%) |
| 35 to 44 Years | 121 (5.7%) | 1,980 (93.3%) |
| 45 to 54 Years | 122 (6.7%) | 1,709 (94.2%) |
| 55 to 64 Years | 230 (10.5%) | 1,980 (90.6%) |
| 65 to 74 Years | 1,227 (94.2%) | 775 (59.5%) |
| 75 Years and over | 729 (100.0%) | 528 (72.4%) |
| Total | 3,188 (21.1%) | 13,217 (87.3%) |
Disability Status by Sex by Age in Berkley
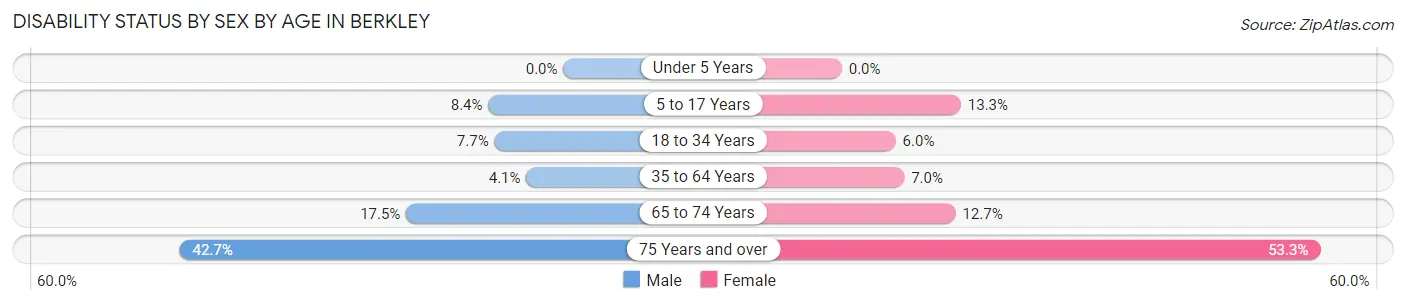
| Age Bracket | Male | Female |
| Under 5 Years | 0 (0.0%) | 0 (0.0%) |
| 5 to 17 Years | 74 (8.4%) | 129 (13.3%) |
| 18 to 34 Years | 159 (7.7%) | 118 (6.0%) |
| 35 to 64 Years | 126 (4.1%) | 213 (7.0%) |
| 65 to 74 Years | 91 (17.5%) | 99 (12.7%) |
| 75 Years and over | 103 (42.7%) | 260 (53.3%) |
Disability Class by Sex by Age in Berkley
Disability Class: Hearing Difficulty
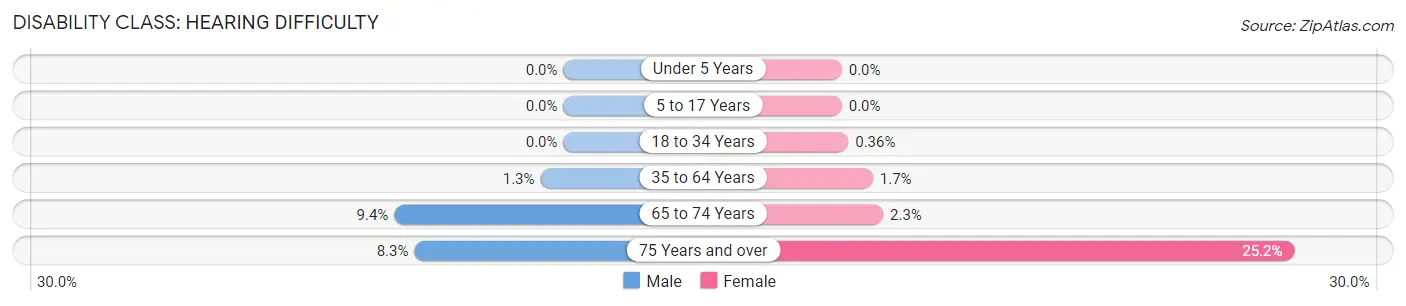
| Age Bracket | Male | Female |
| Under 5 Years | 0 (0.0%) | 0 (0.0%) |
| 5 to 17 Years | 0 (0.0%) | 0 (0.0%) |
| 18 to 34 Years | 0 (0.0%) | 7 (0.4%) |
| 35 to 64 Years | 39 (1.3%) | 53 (1.7%) |
| 65 to 74 Years | 49 (9.4%) | 18 (2.3%) |
| 75 Years and over | 20 (8.3%) | 123 (25.2%) |
Disability Class: Vision Difficulty
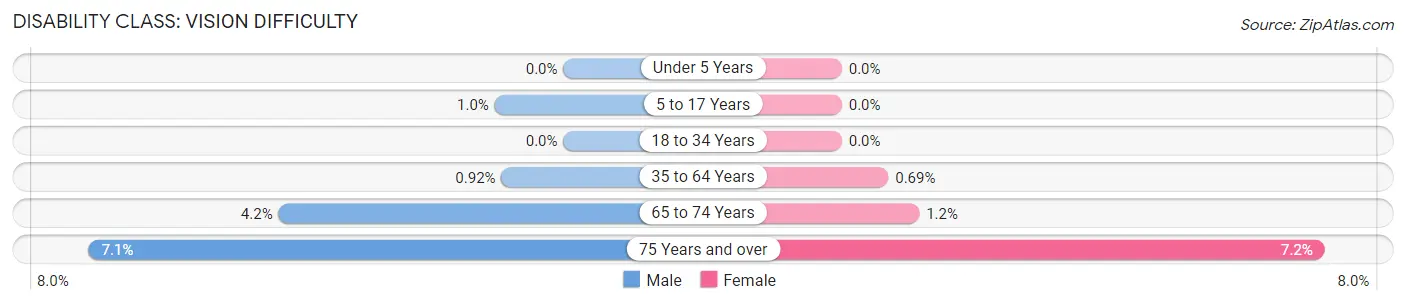
| Age Bracket | Male | Female |
| Under 5 Years | 0 (0.0%) | 0 (0.0%) |
| 5 to 17 Years | 9 (1.0%) | 0 (0.0%) |
| 18 to 34 Years | 0 (0.0%) | 0 (0.0%) |
| 35 to 64 Years | 28 (0.9%) | 21 (0.7%) |
| 65 to 74 Years | 22 (4.2%) | 9 (1.1%) |
| 75 Years and over | 17 (7.0%) | 35 (7.2%) |
Disability Class: Cognitive Difficulty
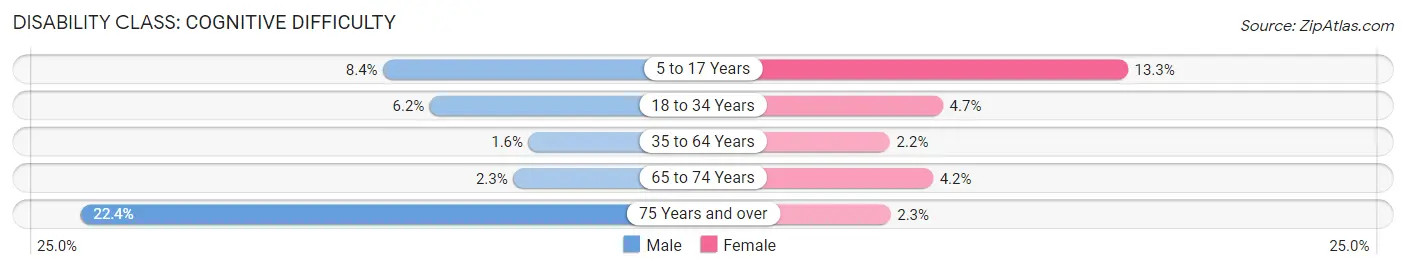
| Age Bracket | Male | Female |
| 5 to 17 Years | 74 (8.4%) | 129 (13.3%) |
| 18 to 34 Years | 128 (6.2%) | 92 (4.7%) |
| 35 to 64 Years | 49 (1.6%) | 68 (2.2%) |
| 65 to 74 Years | 12 (2.3%) | 33 (4.2%) |
| 75 Years and over | 54 (22.4%) | 11 (2.2%) |
Disability Class: Ambulatory Difficulty
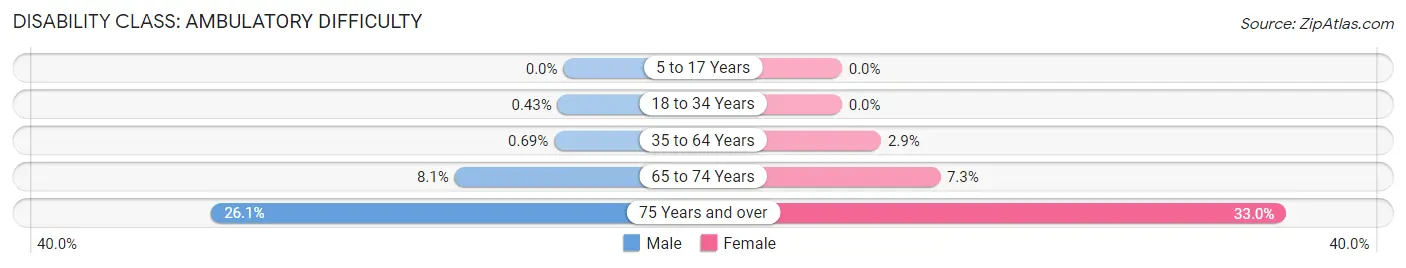
| Age Bracket | Male | Female |
| 5 to 17 Years | 0 (0.0%) | 0 (0.0%) |
| 18 to 34 Years | 9 (0.4%) | 0 (0.0%) |
| 35 to 64 Years | 21 (0.7%) | 89 (2.9%) |
| 65 to 74 Years | 42 (8.1%) | 57 (7.3%) |
| 75 Years and over | 63 (26.1%) | 161 (33.0%) |
Disability Class: Self-Care Difficulty
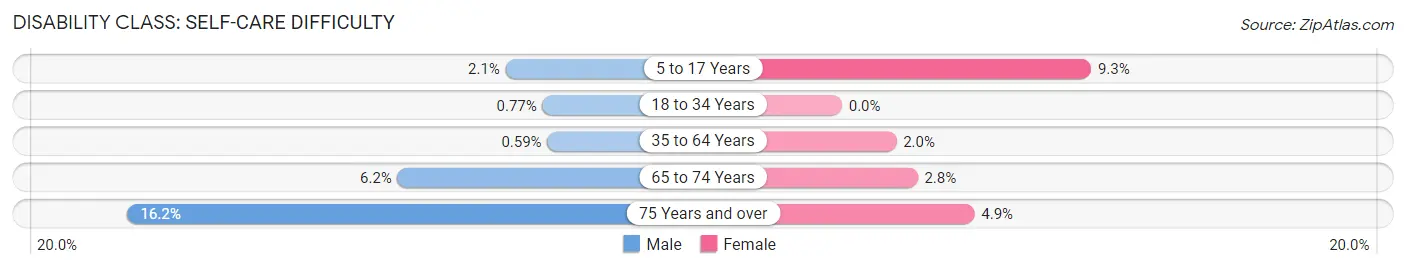
| Age Bracket | Male | Female |
| 5 to 17 Years | 19 (2.1%) | 90 (9.2%) |
| 18 to 34 Years | 16 (0.8%) | 0 (0.0%) |
| 35 to 64 Years | 18 (0.6%) | 62 (2.0%) |
| 65 to 74 Years | 32 (6.1%) | 22 (2.8%) |
| 75 Years and over | 39 (16.2%) | 24 (4.9%) |
Technology Access in Berkley
Computing Device Access in Berkley
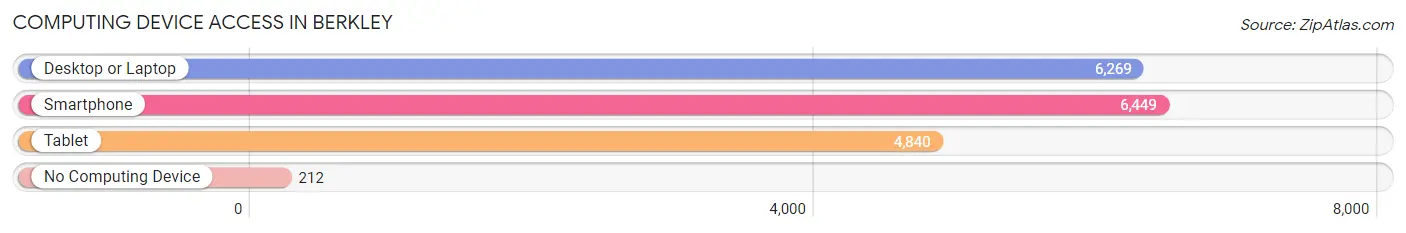
| Device Type | # Households | % Households |
| Desktop or Laptop | 6,269 | 90.1% |
| Smartphone | 6,449 | 92.7% |
| Tablet | 4,840 | 69.6% |
| No Computing Device | 212 | 3.0% |
| Total | 6,954 | 100.0% |
Internet Access in Berkley
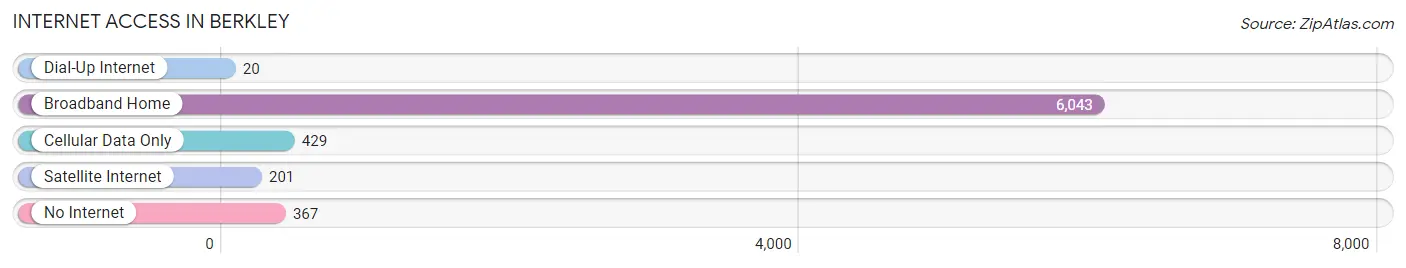
| Internet Type | # Households | % Households |
| Dial-Up Internet | 20 | 0.3% |
| Broadband Home | 6,043 | 86.9% |
| Cellular Data Only | 429 | 6.2% |
| Satellite Internet | 201 | 2.9% |
| No Internet | 367 | 5.3% |
| Total | 6,954 | 100.0% |
Berkley Summary
Berkley, Michigan is a small city located in Oakland County, Michigan. It is a suburb of Detroit and is located about 10 miles north of the city. The city has a population of about 15,000 people and is known for its small-town charm and close-knit community.
History
Berkley was first settled in 1832 by a group of settlers from New York. The city was originally known as “Berkley Corners” and was named after the town of Berkley, Massachusetts. The city was incorporated in 1891 and was originally a farming community. In the early 1900s, the city began to grow and develop as a residential suburb of Detroit.
Geography
Berkley is located in Oakland County, Michigan. It is situated about 10 miles north of Detroit and is bordered by Huntington Woods to the north, Royal Oak to the east, Southfield to the south, and Ferndale to the west. The city covers an area of about 2.5 square miles and is located at an elevation of about 690 feet.
Economy
Berkley’s economy is largely based on retail and services. The city is home to several large retail stores, including Target, Walmart, and Home Depot. The city also has a number of restaurants, bars, and other businesses. The city is also home to several corporate offices, including those of the Detroit Free Press and the Detroit News.
Demographics
As of the 2010 census, the population of Berkley was 14,970. The racial makeup of the city was 87.3% White, 5.3% African American, 0.3% Native American, 2.7% Asian, and 4.4% from other races. The median household income was $50,945 and the median family income was $62,917.
Berkley is a small city with a close-knit community. It is known for its small-town charm and is a popular destination for those looking for a quiet place to live. The city has a diverse economy and is home to several large retail stores and corporate offices. The city also has a diverse population and is home to a variety of different cultures and backgrounds.
Common Questions
What is Per Capita Income in Berkley?
Per Capita income in Berkley is $58,286.
What is the Median Family Income in Berkley?
Median Family Income in Berkley is $134,891.
What is the Median Household income in Berkley?
Median Household Income in Berkley is $108,125.
What is Income or Wage Gap in Berkley?
Income or Wage Gap in Berkley is 9.7%.
Women in Berkley earn 90.3 cents for every dollar earned by a man.
What is Inequality or Gini Index in Berkley?
Inequality or Gini Index in Berkley is 0.37.
What is the Total Population of Berkley?
Total Population of Berkley is 15,150.
What is the Total Male Population of Berkley?
Total Male Population of Berkley is 7,382.
What is the Total Female Population of Berkley?
Total Female Population of Berkley is 7,768.
What is the Ratio of Males per 100 Females in Berkley?
There are 95.03 Males per 100 Females in Berkley.
What is the Ratio of Females per 100 Males in Berkley?
There are 105.23 Females per 100 Males in Berkley.
What is the Median Population Age in Berkley?
Median Population Age in Berkley is 37.6 Years.
What is the Average Family Size in Berkley
Average Family Size in Berkley is 2.9 People.
What is the Average Household Size in Berkley
Average Household Size in Berkley is 2.2 People.
How Large is the Labor Force in Berkley?
There are 9,498 People in the Labor Forcein in Berkley.
What is the Percentage of People in the Labor Force in Berkley?
76.1% of People are in the Labor Force in Berkley.
What is the Unemployment Rate in Berkley?
Unemployment Rate in Berkley is 3.0%.