Cities with the Highest Percentage of Immigrants from Germany in Michigan
RELATED REPORTS & OPTIONS
Germany
Michigan
Compare Cities
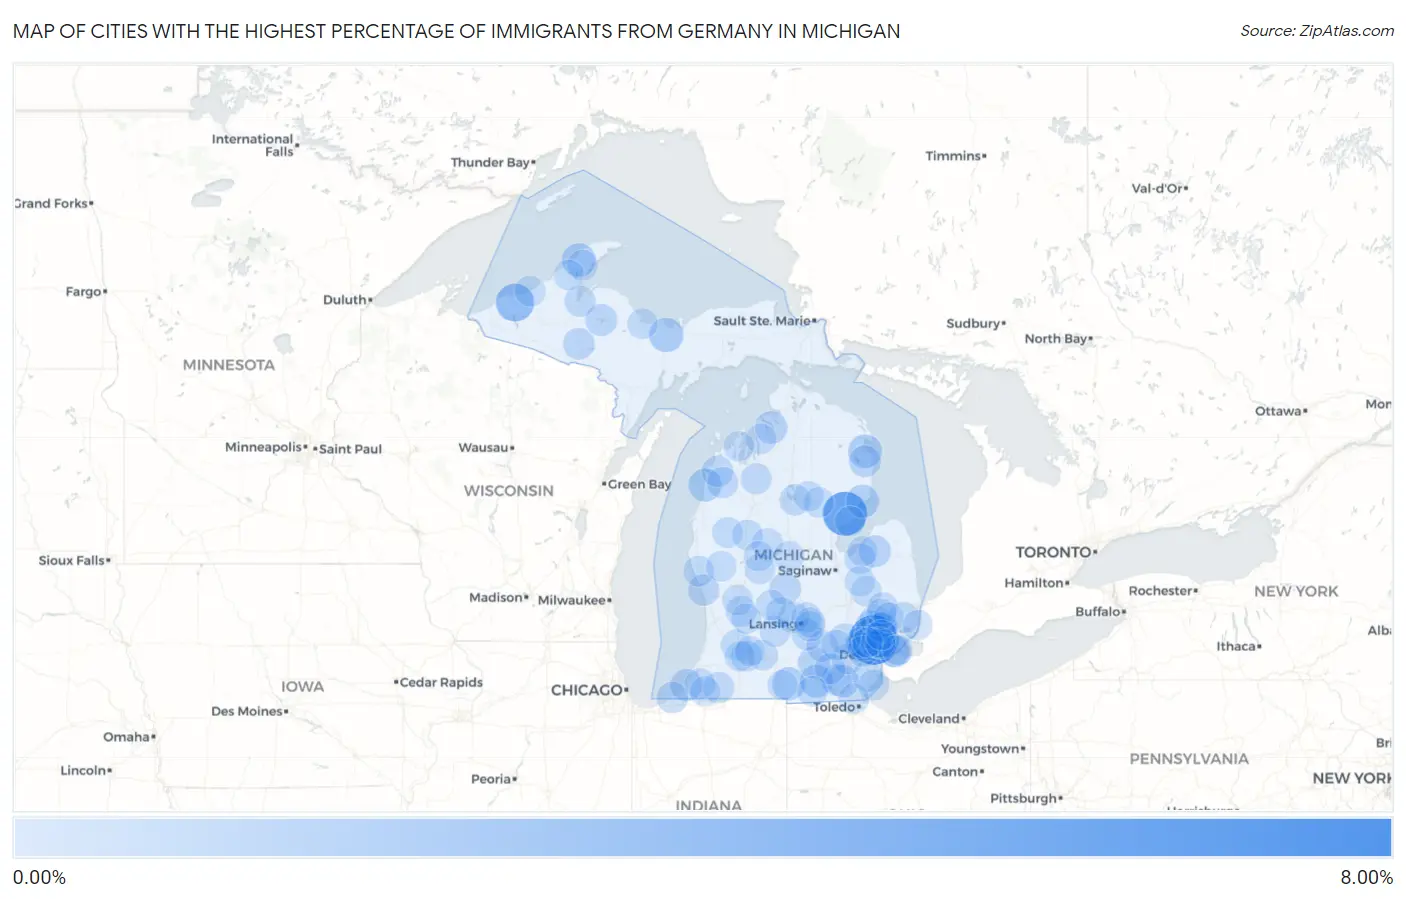
Map of Cities with the Highest Percentage of Immigrants from Germany in Michigan
0.00%
8.00%
Cities with the Highest Percentage of Immigrants from Germany in Michigan
| City | Germany | vs State | vs National | |
| 1. | Bingham Farms | 7.46% | 0.16%(+7.29)#1 | 0.16%(+7.29)#45 |
| 2. | Turner | 5.41% | 0.16%(+5.25)#2 | 0.16%(+5.24)#66 |
| 3. | White Pine | 3.13% | 0.16%(+2.97)#3 | 0.16%(+2.97)#151 |
| 4. | Chatham | 1.72% | 0.16%(+1.56)#4 | 0.16%(+1.56)#364 |
| 5. | Calumet | 1.53% | 0.16%(+1.37)#5 | 0.16%(+1.37)#451 |
| 6. | Ossineke | 1.53% | 0.16%(+1.37)#6 | 0.16%(+1.36)#452 |
| 7. | Allen | 1.41% | 0.16%(+1.25)#7 | 0.16%(+1.24)#508 |
| 8. | Arcadia | 1.34% | 0.16%(+1.18)#8 | 0.16%(+1.18)#544 |
| 9. | East Tawas | 1.31% | 0.16%(+1.15)#9 | 0.16%(+1.14)#564 |
| 10. | Manitou Beach Devils Lake | 1.22% | 0.16%(+1.06)#10 | 0.16%(+1.05)#623 |
| 11. | Britton | 1.10% | 0.16%(+0.937)#11 | 0.16%(+0.933)#717 |
| 12. | Advance | 1.08% | 0.16%(+0.918)#12 | 0.16%(+0.914)#739 |
| 13. | Grosse Pointe | 0.98% | 0.16%(+0.818)#13 | 0.16%(+0.814)#853 |
| 14. | Bridgman | 0.97% | 0.16%(+0.807)#14 | 0.16%(+0.803)#863 |
| 15. | Gagetown | 0.94% | 0.16%(+0.777)#15 | 0.16%(+0.773)#906 |
| 16. | Michigamme | 0.88% | 0.16%(+0.725)#16 | 0.16%(+0.721)#990 |
| 17. | Lost Lake Woods | 0.87% | 0.16%(+0.709)#17 | 0.16%(+0.706)#1,015 |
| 18. | Michigan Center | 0.86% | 0.16%(+0.696)#18 | 0.16%(+0.692)#1,040 |
| 19. | Carson City | 0.80% | 0.16%(+0.635)#19 | 0.16%(+0.631)#1,140 |
| 20. | Franklin | 0.79% | 0.16%(+0.631)#20 | 0.16%(+0.628)#1,152 |
| 21. | Amasa | 0.78% | 0.16%(+0.618)#21 | 0.16%(+0.614)#1,179 |
| 22. | Rochester Hills | 0.72% | 0.16%(+0.562)#22 | 0.16%(+0.558)#1,295 |
| 23. | Stockbridge | 0.71% | 0.16%(+0.555)#23 | 0.16%(+0.551)#1,307 |
| 24. | Michiana | 0.70% | 0.16%(+0.541)#24 | 0.16%(+0.538)#1,333 |
| 25. | Lake Angelus | 0.70% | 0.16%(+0.537)#25 | 0.16%(+0.533)#1,345 |
| 26. | Norton Shores | 0.68% | 0.16%(+0.524)#26 | 0.16%(+0.520)#1,366 |
| 27. | Tecumseh | 0.68% | 0.16%(+0.520)#27 | 0.16%(+0.516)#1,381 |
| 28. | Northville | 0.67% | 0.16%(+0.513)#28 | 0.16%(+0.509)#1,403 |
| 29. | Honor | 0.67% | 0.16%(+0.511)#29 | 0.16%(+0.507)#1,411 |
| 30. | Thompsonville | 0.66% | 0.16%(+0.503)#30 | 0.16%(+0.500)#1,437 |
| 31. | Richmond | 0.65% | 0.16%(+0.489)#31 | 0.16%(+0.485)#1,469 |
| 32. | Cassopolis | 0.63% | 0.16%(+0.468)#32 | 0.16%(+0.465)#1,558 |
| 33. | L Anse | 0.62% | 0.16%(+0.458)#33 | 0.16%(+0.454)#1,596 |
| 34. | Mason | 0.62% | 0.16%(+0.455)#34 | 0.16%(+0.452)#1,605 |
| 35. | Wacousta | 0.62% | 0.16%(+0.455)#35 | 0.16%(+0.451)#1,606 |
| 36. | Akron | 0.61% | 0.16%(+0.446)#36 | 0.16%(+0.442)#1,644 |
| 37. | Fife Lake | 0.59% | 0.16%(+0.431)#37 | 0.16%(+0.428)#1,689 |
| 38. | Ann Arbor | 0.58% | 0.16%(+0.418)#38 | 0.16%(+0.414)#1,738 |
| 39. | Manchester | 0.57% | 0.16%(+0.415)#39 | 0.16%(+0.411)#1,749 |
| 40. | Prudenville | 0.57% | 0.16%(+0.406)#40 | 0.16%(+0.403)#1,778 |
| 41. | Carleton | 0.56% | 0.16%(+0.405)#41 | 0.16%(+0.401)#1,785 |
| 42. | Vermontville | 0.56% | 0.16%(+0.398)#42 | 0.16%(+0.394)#1,817 |
| 43. | Kentwood | 0.54% | 0.16%(+0.382)#43 | 0.16%(+0.378)#1,872 |
| 44. | Otsego | 0.54% | 0.16%(+0.378)#44 | 0.16%(+0.375)#1,887 |
| 45. | Grosse Pointe Park | 0.54% | 0.16%(+0.378)#45 | 0.16%(+0.375)#1,888 |
| 46. | Novi | 0.53% | 0.16%(+0.374)#46 | 0.16%(+0.370)#1,905 |
| 47. | Stony Point | 0.53% | 0.16%(+0.373)#47 | 0.16%(+0.369)#1,909 |
| 48. | Brighton | 0.52% | 0.16%(+0.361)#48 | 0.16%(+0.357)#1,953 |
| 49. | Barryton | 0.52% | 0.16%(+0.359)#49 | 0.16%(+0.355)#1,960 |
| 50. | Whitehall | 0.51% | 0.16%(+0.351)#50 | 0.16%(+0.347)#2,000 |
| 51. | Comstock Northwest | 0.51% | 0.16%(+0.346)#51 | 0.16%(+0.343)#2,028 |
| 52. | Portland | 0.50% | 0.16%(+0.338)#52 | 0.16%(+0.334)#2,065 |
| 53. | Lakeview | 0.49% | 0.16%(+0.327)#53 | 0.16%(+0.323)#2,116 |
| 54. | Baldwin | 0.49% | 0.16%(+0.325)#54 | 0.16%(+0.321)#2,122 |
| 55. | Keego Harbor | 0.47% | 0.16%(+0.309)#55 | 0.16%(+0.305)#2,191 |
| 56. | Springfield | 0.46% | 0.16%(+0.295)#56 | 0.16%(+0.292)#2,261 |
| 57. | Berrien Springs | 0.45% | 0.16%(+0.285)#57 | 0.16%(+0.281)#2,315 |
| 58. | Hudson | 0.44% | 0.16%(+0.283)#58 | 0.16%(+0.280)#2,318 |
| 59. | Reed City | 0.44% | 0.16%(+0.283)#59 | 0.16%(+0.279)#2,319 |
| 60. | Lambertville | 0.43% | 0.16%(+0.266)#60 | 0.16%(+0.263)#2,411 |
| 61. | Lake Linden | 0.42% | 0.16%(+0.262)#61 | 0.16%(+0.259)#2,432 |
| 62. | Fremont | 0.42% | 0.16%(+0.261)#62 | 0.16%(+0.257)#2,437 |
| 63. | Harvey | 0.42% | 0.16%(+0.259)#63 | 0.16%(+0.256)#2,443 |
| 64. | Bath | 0.41% | 0.16%(+0.255)#64 | 0.16%(+0.251)#2,475 |
| 65. | Birmingham | 0.41% | 0.16%(+0.254)#65 | 0.16%(+0.250)#2,482 |
| 66. | Lake Orion | 0.41% | 0.16%(+0.251)#66 | 0.16%(+0.248)#2,498 |
| 67. | Plymouth | 0.40% | 0.16%(+0.238)#67 | 0.16%(+0.234)#2,600 |
| 68. | Ionia | 0.40% | 0.16%(+0.237)#68 | 0.16%(+0.234)#2,603 |
| 69. | South Range | 0.39% | 0.16%(+0.233)#69 | 0.16%(+0.229)#2,647 |
| 70. | Lathrup Village | 0.39% | 0.16%(+0.232)#70 | 0.16%(+0.229)#2,656 |
| 71. | Mount Pleasant | 0.39% | 0.16%(+0.229)#71 | 0.16%(+0.225)#2,682 |
| 72. | Ontonagon | 0.39% | 0.16%(+0.227)#72 | 0.16%(+0.224)#2,694 |
| 73. | Columbiaville | 0.39% | 0.16%(+0.227)#73 | 0.16%(+0.224)#2,695 |
| 74. | Comstock Park | 0.39% | 0.16%(+0.225)#74 | 0.16%(+0.221)#2,710 |
| 75. | Pleasant Ridge | 0.38% | 0.16%(+0.223)#75 | 0.16%(+0.219)#2,731 |
| 76. | Okemos | 0.37% | 0.16%(+0.208)#76 | 0.16%(+0.204)#2,851 |
| 77. | Millington | 0.36% | 0.16%(+0.204)#77 | 0.16%(+0.201)#2,876 |
| 78. | West Branch | 0.36% | 0.16%(+0.204)#78 | 0.16%(+0.200)#2,883 |
| 79. | Pinckney | 0.36% | 0.16%(+0.199)#79 | 0.16%(+0.195)#2,917 |
| 80. | Westwood | 0.35% | 0.16%(+0.194)#80 | 0.16%(+0.191)#2,955 |
| 81. | St Helen | 0.35% | 0.16%(+0.194)#81 | 0.16%(+0.190)#2,960 |
| 82. | Canadian Lakes | 0.35% | 0.16%(+0.189)#82 | 0.16%(+0.185)#2,995 |
| 83. | Marine City | 0.34% | 0.16%(+0.184)#83 | 0.16%(+0.180)#3,039 |
| 84. | Rochester | 0.34% | 0.16%(+0.179)#84 | 0.16%(+0.175)#3,083 |
| 85. | Central Lake | 0.34% | 0.16%(+0.178)#85 | 0.16%(+0.174)#3,089 |
| 86. | Unionville | 0.34% | 0.16%(+0.176)#86 | 0.16%(+0.172)#3,113 |
| 87. | Caledonia | 0.33% | 0.16%(+0.172)#87 | 0.16%(+0.168)#3,146 |
| 88. | Huntington Woods | 0.33% | 0.16%(+0.170)#88 | 0.16%(+0.166)#3,158 |
| 89. | Grosse Pointe Farms | 0.33% | 0.16%(+0.169)#89 | 0.16%(+0.165)#3,161 |
| 90. | Dryden | 0.33% | 0.16%(+0.168)#90 | 0.16%(+0.164)#3,171 |
| 91. | Au Gres | 0.32% | 0.16%(+0.162)#91 | 0.16%(+0.159)#3,217 |
| 92. | Haslett | 0.31% | 0.16%(+0.154)#92 | 0.16%(+0.150)#3,291 |
| 93. | Farmington Hills | 0.31% | 0.16%(+0.152)#93 | 0.16%(+0.148)#3,313 |
| 94. | Suttons Bay | 0.31% | 0.16%(+0.151)#94 | 0.16%(+0.148)#3,316 |
| 95. | Leonard | 0.31% | 0.16%(+0.149)#95 | 0.16%(+0.146)#3,335 |
| 96. | Quincy | 0.31% | 0.16%(+0.147)#96 | 0.16%(+0.143)#3,357 |
| 97. | Richland | 0.31% | 0.16%(+0.146)#97 | 0.16%(+0.142)#3,359 |
| 98. | Niles | 0.30% | 0.16%(+0.143)#98 | 0.16%(+0.139)#3,383 |
| 99. | Romeo | 0.30% | 0.16%(+0.135)#99 | 0.16%(+0.131)#3,469 |
| 100. | Troy | 0.29% | 0.16%(+0.134)#100 | 0.16%(+0.131)#3,476 |
Common Questions
What are the Top 10 Cities with the Highest Percentage of Immigrants from Germany in Michigan?
Top 10 Cities with the Highest Percentage of Immigrants from Germany in Michigan are:
#1
7.46%
#2
5.41%
#3
3.13%
#4
1.72%
#5
1.53%
#6
1.53%
#7
1.41%
#8
1.34%
#9
1.31%
#10
1.22%
What city has the Highest Percentage of Immigrants from Germany in Michigan?
Bingham Farms has the Highest Percentage of Immigrants from Germany in Michigan with 7.46%.
What is the Percentage of Immigrants from Germany in the State of Michigan?
Percentage of Immigrants from Germany in Michigan is 0.16%.
What is the Percentage of Immigrants from Germany in the United States?
Percentage of Immigrants from Germany in the United States is 0.16%.