Cities with the Highest Percentage of Households with Income Above $200,000 in Tennessee
RELATED REPORTS & OPTIONS
Household Income | $200k+
Tennessee
Compare Cities
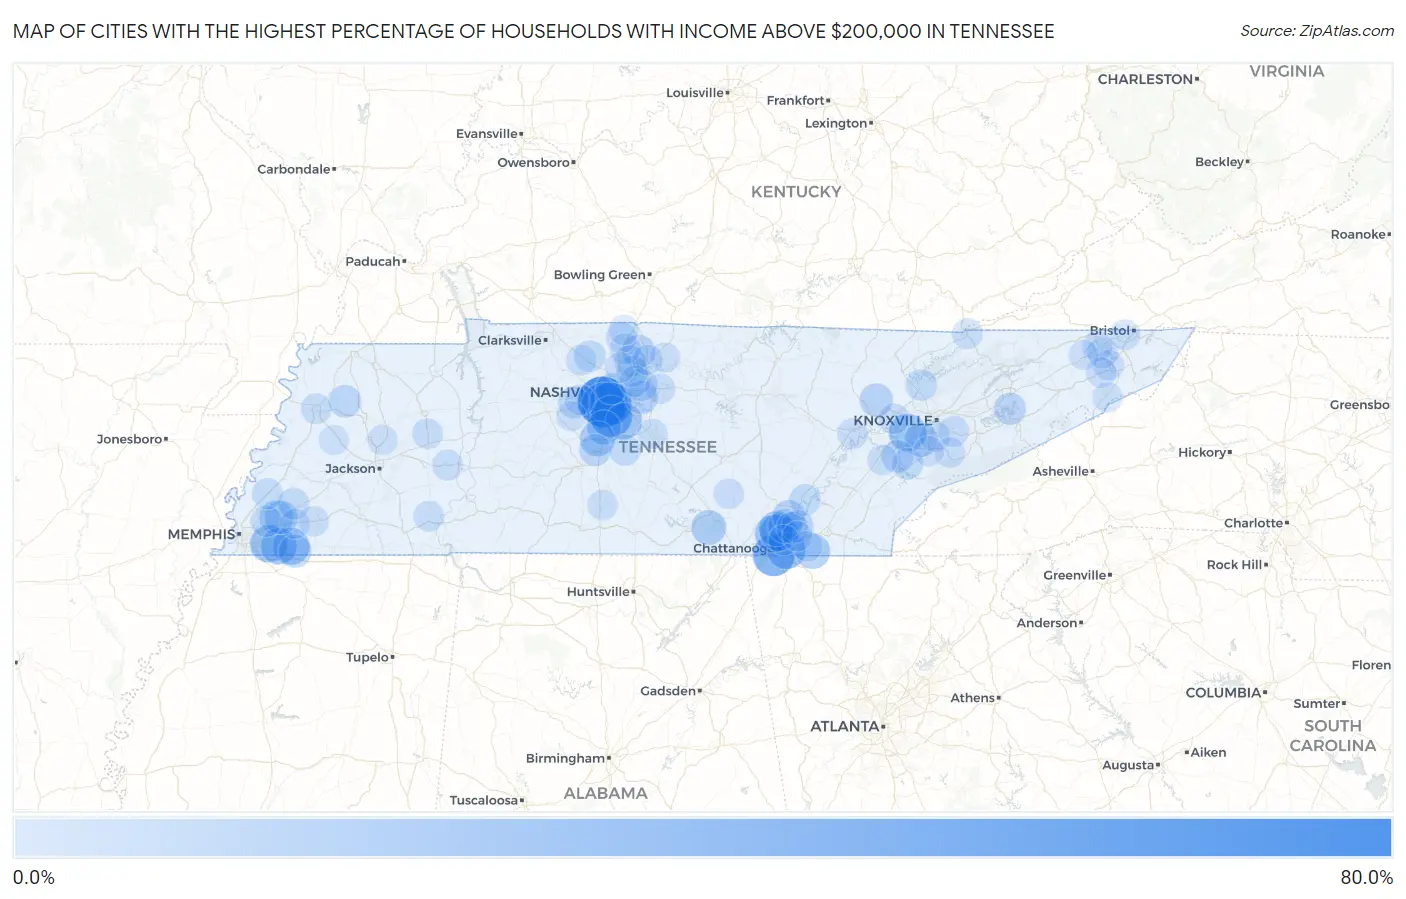
Map of Cities with the Highest Percentage of Households with Income Above $200,000 in Tennessee
0.0%
80.0%
Cities with the Highest Percentage of Households with Income Above $200,000 in Tennessee
| City | Households with Income > $200k | vs State | vs National | |
| 1. | Belle Meade | 74.0% | 7.3%(+66.7)#1 | 11.4%(+62.6)#53 |
| 2. | Forest Hills | 58.2% | 7.3%(+50.9)#2 | 11.4%(+46.8)#226 |
| 3. | Luray | 54.4% | 7.3%(+47.1)#3 | 11.4%(+43.0)#318 |
| 4. | Taft | 53.1% | 7.3%(+45.8)#4 | 11.4%(+41.7)#361 |
| 5. | Oak Hill | 50.9% | 7.3%(+43.6)#5 | 11.4%(+39.5)#421 |
| 6. | Lookout Mountain | 46.9% | 7.3%(+39.6)#6 | 11.4%(+35.5)#538 |
| 7. | Brentwood | 46.2% | 7.3%(+38.9)#7 | 11.4%(+34.8)#569 |
| 8. | Ridgeside | 34.5% | 7.3%(+27.2)#8 | 11.4%(+23.1)#1,213 |
| 9. | Signal Mountain | 31.3% | 7.3%(+24.0)#9 | 11.4%(+19.9)#1,489 |
| 10. | Farragut | 31.0% | 7.3%(+23.7)#10 | 11.4%(+19.6)#1,518 |
| 11. | Germantown | 30.8% | 7.3%(+23.5)#11 | 11.4%(+19.4)#1,528 |
| 12. | Walden | 30.7% | 7.3%(+23.4)#12 | 11.4%(+19.3)#1,550 |
| 13. | Dellrose | 30.2% | 7.3%(+22.9)#13 | 11.4%(+18.8)#1,600 |
| 14. | Piperton | 28.8% | 7.3%(+21.5)#14 | 11.4%(+17.4)#1,736 |
| 15. | Nolensville | 27.6% | 7.3%(+20.3)#15 | 11.4%(+16.2)#1,859 |
| 16. | Collierville | 27.3% | 7.3%(+20.0)#16 | 11.4%(+15.9)#1,886 |
| 17. | Fairmount | 23.2% | 7.3%(+15.9)#17 | 11.4%(+11.8)#2,452 |
| 18. | Apison | 23.1% | 7.3%(+15.8)#18 | 11.4%(+11.7)#2,468 |
| 19. | Thompson S Station | 22.6% | 7.3%(+15.3)#19 | 11.4%(+11.2)#2,543 |
| 20. | Sewanee | 21.6% | 7.3%(+14.3)#20 | 11.4%(+10.2)#2,733 |
| 21. | Franklin | 20.7% | 7.3%(+13.4)#21 | 11.4%(+9.30)#2,895 |
| 22. | Lakeland | 18.7% | 7.3%(+11.4)#22 | 11.4%(+7.30)#3,341 |
| 23. | Falling Water | 18.6% | 7.3%(+11.3)#23 | 11.4%(+7.20)#3,374 |
| 24. | Louisville | 17.7% | 7.3%(+10.4)#24 | 11.4%(+6.30)#3,575 |
| 25. | Arlington | 16.6% | 7.3%(+9.30)#25 | 11.4%(+5.20)#3,819 |
| 26. | Petros | 16.6% | 7.3%(+9.30)#26 | 11.4%(+5.20)#3,843 |
| 27. | Rural Hill | 16.5% | 7.3%(+9.20)#27 | 11.4%(+5.10)#3,867 |
| 28. | Cottontown | 15.8% | 7.3%(+8.50)#28 | 11.4%(+4.40)#4,045 |
| 29. | Rossville | 15.4% | 7.3%(+8.10)#29 | 11.4%(+4.00)#4,163 |
| 30. | Rarity Bay | 15.4% | 7.3%(+8.10)#30 | 11.4%(+4.00)#4,166 |
| 31. | Mowbray Mountain | 14.9% | 7.3%(+7.60)#31 | 11.4%(+3.50)#4,332 |
| 32. | Yorkville | 14.3% | 7.3%(+7.00)#32 | 11.4%(+2.90)#4,556 |
| 33. | Sullivan Gardens | 14.0% | 7.3%(+6.70)#33 | 11.4%(+2.60)#4,668 |
| 34. | Norene | 14.0% | 7.3%(+6.70)#34 | 11.4%(+2.60)#4,676 |
| 35. | Huron | 13.8% | 7.3%(+6.50)#35 | 11.4%(+2.40)#4,759 |
| 36. | Mount Juliet | 13.7% | 7.3%(+6.40)#36 | 11.4%(+2.30)#4,765 |
| 37. | Tellico Village | 13.6% | 7.3%(+6.30)#37 | 11.4%(+2.20)#4,820 |
| 38. | Lakesite | 12.8% | 7.3%(+5.50)#38 | 11.4%(+1.40)#5,169 |
| 39. | Baneberry | 12.6% | 7.3%(+5.30)#39 | 11.4%(+1.20)#5,260 |
| 40. | Spring Hill | 12.4% | 7.3%(+5.10)#40 | 11.4%(+1.000)#5,327 |
| 41. | Walnut Grove Cdp Sumner County | 12.3% | 7.3%(+5.00)#41 | 11.4%(+0.900)#5,402 |
| 42. | Middle Valley | 12.0% | 7.3%(+4.70)#42 | 11.4%(+0.600)#5,520 |
| 43. | Kingston Springs | 11.2% | 7.3%(+3.90)#43 | 11.4%(-0.200)#5,880 |
| 44. | Sale Creek | 11.0% | 7.3%(+3.70)#44 | 11.4%(-0.400)#5,971 |
| 45. | Coopertown | 10.8% | 7.3%(+3.50)#45 | 11.4%(-0.600)#6,079 |
| 46. | Greenback | 10.8% | 7.3%(+3.50)#46 | 11.4%(-0.600)#6,090 |
| 47. | Shackle Island | 10.7% | 7.3%(+3.40)#47 | 11.4%(-0.700)#6,124 |
| 48. | Norris | 10.6% | 7.3%(+3.30)#48 | 11.4%(-0.800)#6,194 |
| 49. | Nashville | 10.3% | 7.3%(+3.00)#49 | 11.4%(-1.10)#6,309 |
| 50. | Hendersonville | 10.3% | 7.3%(+3.00)#50 | 11.4%(-1.10)#6,316 |
| 51. | Braden | 10.3% | 7.3%(+3.00)#51 | 11.4%(-1.10)#6,366 |
| 52. | Eagleville | 10.2% | 7.3%(+2.90)#52 | 11.4%(-1.20)#6,421 |
| 53. | Bartlett | 10.0% | 7.3%(+2.70)#53 | 11.4%(-1.40)#6,491 |
| 54. | Kahite | 9.8% | 7.3%(+2.50)#54 | 11.4%(-1.60)#6,682 |
| 55. | Gladeville | 9.3% | 7.3%(+2.00)#55 | 11.4%(-2.10)#7,001 |
| 56. | Atoka | 9.1% | 7.3%(+1.80)#56 | 11.4%(-2.30)#7,105 |
| 57. | Green Hill | 9.1% | 7.3%(+1.80)#57 | 11.4%(-2.30)#7,111 |
| 58. | Mcdonald | 8.9% | 7.3%(+1.60)#58 | 11.4%(-2.50)#7,264 |
| 59. | Hickman | 8.9% | 7.3%(+1.60)#59 | 11.4%(-2.50)#7,274 |
| 60. | Seymour | 8.6% | 7.3%(+1.30)#60 | 11.4%(-2.80)#7,436 |
| 61. | Darden | 8.6% | 7.3%(+1.30)#61 | 11.4%(-2.80)#7,485 |
| 62. | Spurgeon | 8.5% | 7.3%(+1.20)#62 | 11.4%(-2.90)#7,524 |
| 63. | Cross Plains | 8.5% | 7.3%(+1.20)#63 | 11.4%(-2.90)#7,537 |
| 64. | White House | 8.3% | 7.3%(+1.00)#64 | 11.4%(-3.10)#7,666 |
| 65. | Rockford | 8.2% | 7.3%(+0.900)#65 | 11.4%(-3.20)#7,787 |
| 66. | Dyersburg | 8.1% | 7.3%(+0.800)#66 | 11.4%(-3.30)#7,826 |
| 67. | Pinson | 8.1% | 7.3%(+0.800)#67 | 11.4%(-3.30)#7,882 |
| 68. | Harrogate | 7.7% | 7.3%(+0.400)#68 | 11.4%(-3.70)#8,177 |
| 69. | Pegram | 7.7% | 7.3%(+0.400)#69 | 11.4%(-3.70)#8,186 |
| 70. | Clarksburg | 7.7% | 7.3%(+0.400)#70 | 11.4%(-3.70)#8,200 |
| 71. | Pleasant View | 7.6% | 7.3%(+0.300)#71 | 11.4%(-3.80)#8,263 |
| 72. | Adamsville | 7.6% | 7.3%(+0.300)#72 | 11.4%(-3.80)#8,275 |
| 73. | Goodlettsville | 7.5% | 7.3%(+0.200)#73 | 11.4%(-3.90)#8,326 |
| 74. | Rockwood | 7.5% | 7.3%(+0.200)#74 | 11.4%(-3.90)#8,342 |
| 75. | Chattanooga | 7.4% | 7.3%(+0.100)#75 | 11.4%(-4.00)#8,406 |
| 76. | Gallatin | 7.3% | 7.3%(=0.000)#76 | 11.4%(-4.10)#8,510 |
| 77. | Oak Ridge | 7.3% | 7.3%(=0.000)#77 | 11.4%(-4.10)#8,514 |
| 78. | Walnut Hill | 7.3% | 7.3%(=0.000)#78 | 11.4%(-4.10)#8,543 |
| 79. | Johnson City | 7.2% | 7.3%(-0.100)#79 | 11.4%(-4.20)#8,587 |
| 80. | Walland | 7.1% | 7.3%(-0.200)#80 | 11.4%(-4.30)#8,744 |
| 81. | Maryville | 7.0% | 7.3%(-0.300)#81 | 11.4%(-4.40)#8,768 |
| 82. | Altamont | 7.0% | 7.3%(-0.300)#82 | 11.4%(-4.40)#8,833 |
| 83. | Colonial Heights | 6.9% | 7.3%(-0.400)#83 | 11.4%(-4.50)#8,904 |
| 84. | Cornersville | 6.9% | 7.3%(-0.400)#84 | 11.4%(-4.50)#8,921 |
| 85. | Jonesborough | 6.8% | 7.3%(-0.500)#85 | 11.4%(-4.60)#9,006 |
| 86. | Somerville | 6.8% | 7.3%(-0.500)#86 | 11.4%(-4.60)#9,023 |
| 87. | Philadelphia | 6.8% | 7.3%(-0.500)#87 | 11.4%(-4.60)#9,057 |
| 88. | Lebanon | 6.7% | 7.3%(-0.600)#88 | 11.4%(-4.70)#9,097 |
| 89. | Collegedale | 6.7% | 7.3%(-0.600)#89 | 11.4%(-4.70)#9,114 |
| 90. | Murfreesboro | 6.6% | 7.3%(-0.700)#90 | 11.4%(-4.80)#9,215 |
| 91. | Oakland | 6.3% | 7.3%(-1.000)#91 | 11.4%(-5.10)#9,552 |
| 92. | Lynchburg | 6.3% | 7.3%(-1.000)#92 | 11.4%(-5.10)#9,559 |
| 93. | Maury City | 6.3% | 7.3%(-1.000)#93 | 11.4%(-5.10)#9,608 |
| 94. | Medina | 6.2% | 7.3%(-1.10)#94 | 11.4%(-5.20)#9,707 |
| 95. | Orlinda | 6.2% | 7.3%(-1.10)#95 | 11.4%(-5.20)#9,737 |
| 96. | Fairview | 6.1% | 7.3%(-1.20)#96 | 11.4%(-5.30)#9,806 |
| 97. | Harrison | 6.1% | 7.3%(-1.20)#97 | 11.4%(-5.30)#9,810 |
| 98. | Banner Hill | 6.1% | 7.3%(-1.20)#98 | 11.4%(-5.30)#9,845 |
| 99. | Castalian Springs | 6.0% | 7.3%(-1.30)#99 | 11.4%(-5.40)#10,003 |
| 100. | Fall Branch | 5.9% | 7.3%(-1.40)#100 | 11.4%(-5.50)#10,121 |
Common Questions
What are the Top 10 Cities with the Highest Percentage of Households with Income Above $200,000 in Tennessee?
Top 10 Cities with the Highest Percentage of Households with Income Above $200,000 in Tennessee are:
#1
74.0%
#2
58.2%
#3
50.9%
#4
46.9%
#5
46.2%
#6
34.5%
#7
31.3%
#8
31.0%
#9
30.8%
#10
30.7%
What city has the Highest Percentage of Households with Income Above $200,000 in Tennessee?
Belle Meade has the Highest Percentage of Households with Income Above $200,000 in Tennessee with 74.0%.
What is the Percentage of Households with Income Above $200,000 in the State of Tennessee?
Percentage of Households with Income Above $200,000 in Tennessee is 7.3%.
What is the Percentage of Households with Income Above $200,000 in the United States?
Percentage of Households with Income Above $200,000 in the United States is 11.4%.