Cities with the Highest Percentage of Households with Income Above $200,000 in Montana
RELATED REPORTS & OPTIONS
Household Income | $200k+
Montana
Compare Cities
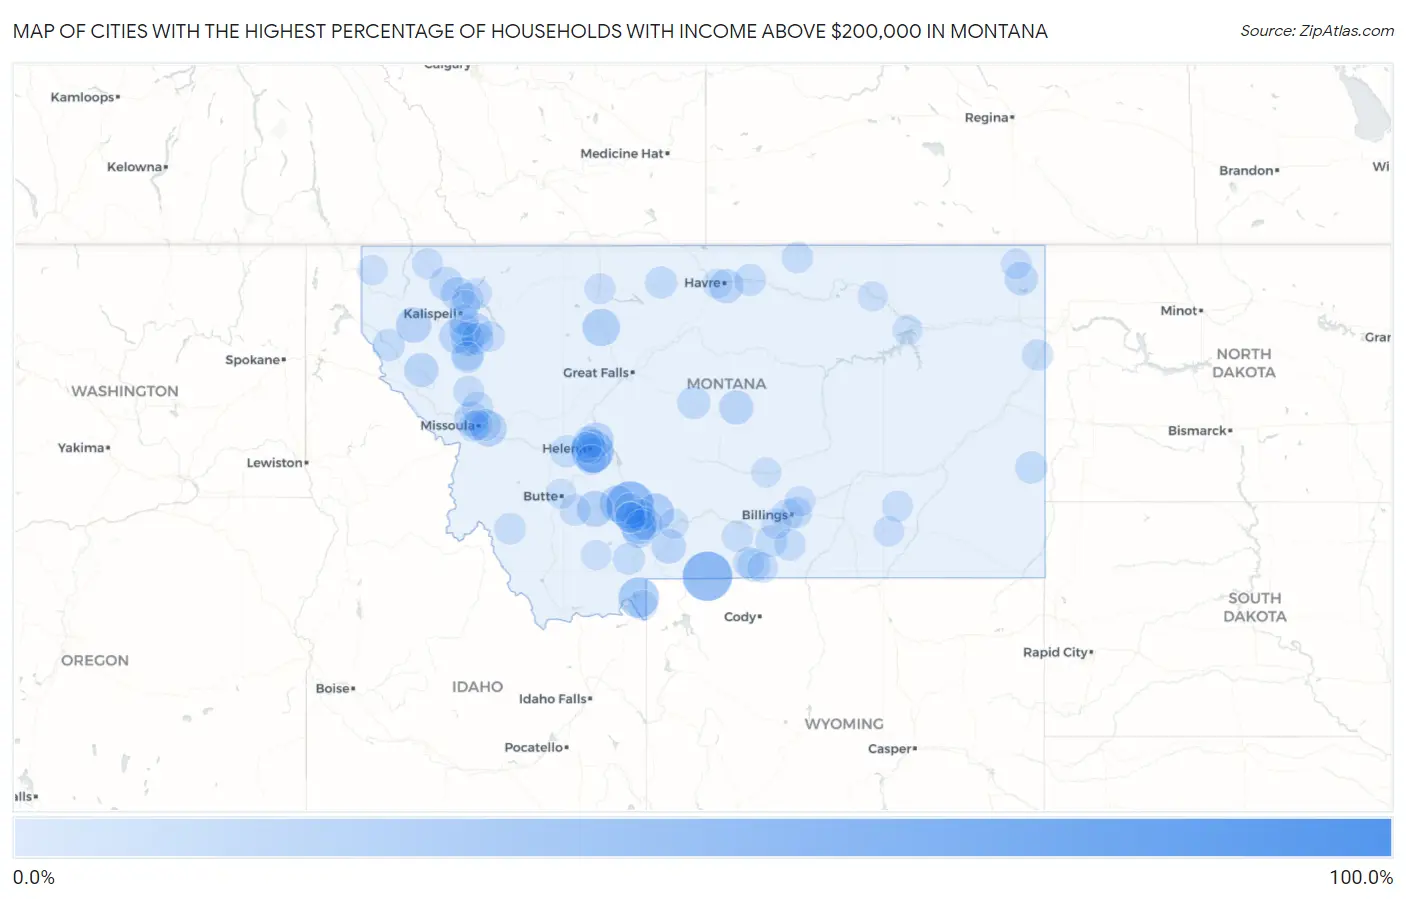
Map of Cities with the Highest Percentage of Households with Income Above $200,000 in Montana
0.0%
100.0%
Cities with the Highest Percentage of Households with Income Above $200,000 in Montana
| City | Households with Income > $200k | vs State | vs National | |
| 1. | Mammoth | 100.0% | 7.2%(+92.8)#1 | 11.4%(+88.6)#18 |
| 2. | Silver Gate | 50.9% | 7.2%(+43.7)#2 | 11.4%(+39.5)#424 |
| 3. | Fords Creek Colony | 50.0% | 7.2%(+42.8)#3 | 11.4%(+38.6)#453 |
| 4. | Ayers Ranch Colony | 50.0% | 7.2%(+42.8)#4 | 11.4%(+38.6)#454 |
| 5. | Gallatin River Ranch | 45.5% | 7.2%(+38.3)#5 | 11.4%(+34.1)#595 |
| 6. | Glacier Colony | 35.0% | 7.2%(+27.8)#6 | 11.4%(+23.6)#1,176 |
| 7. | South Hills | 34.6% | 7.2%(+27.4)#7 | 11.4%(+23.2)#1,205 |
| 8. | Rockvale | 31.4% | 7.2%(+24.2)#8 | 11.4%(+20.0)#1,486 |
| 9. | Hardy | 31.0% | 7.2%(+23.8)#9 | 11.4%(+19.6)#1,521 |
| 10. | Hebgen Lake Estates | 29.0% | 7.2%(+21.8)#10 | 11.4%(+17.6)#1,714 |
| 11. | Rapelje | 28.0% | 7.2%(+20.8)#11 | 11.4%(+16.6)#1,822 |
| 12. | Bridger | 23.5% | 7.2%(+16.3)#12 | 11.4%(+12.1)#2,398 |
| 13. | Four Corners | 23.3% | 7.2%(+16.1)#13 | 11.4%(+11.9)#2,426 |
| 14. | Brady | 22.0% | 7.2%(+14.8)#14 | 11.4%(+10.6)#2,672 |
| 15. | York | 20.7% | 7.2%(+13.5)#15 | 11.4%(+9.30)#2,910 |
| 16. | Wheatland | 19.9% | 7.2%(+12.7)#16 | 11.4%(+8.50)#3,082 |
| 17. | Twin Creeks | 18.8% | 7.2%(+11.6)#17 | 11.4%(+7.40)#3,333 |
| 18. | Cardwell | 18.8% | 7.2%(+11.6)#18 | 11.4%(+7.40)#3,335 |
| 19. | Montana City | 18.7% | 7.2%(+11.5)#19 | 11.4%(+7.30)#3,352 |
| 20. | Turah | 18.3% | 7.2%(+11.1)#20 | 11.4%(+6.90)#3,436 |
| 21. | Happys Inn | 17.6% | 7.2%(+10.4)#21 | 11.4%(+6.20)#3,606 |
| 22. | Helena Valley Northeast | 16.9% | 7.2%(+9.70)#22 | 11.4%(+5.50)#3,743 |
| 23. | Woods Bay | 16.0% | 7.2%(+8.80)#23 | 11.4%(+4.60)#3,984 |
| 24. | Pray | 15.4% | 7.2%(+8.20)#24 | 11.4%(+4.00)#4,164 |
| 25. | Wye | 15.0% | 7.2%(+7.80)#25 | 11.4%(+3.60)#4,300 |
| 26. | Lewistown Heights | 14.7% | 7.2%(+7.50)#26 | 11.4%(+3.30)#4,407 |
| 27. | Saddle Butte | 14.3% | 7.2%(+7.10)#27 | 11.4%(+2.90)#4,561 |
| 28. | Weeksville | 14.3% | 7.2%(+7.10)#28 | 11.4%(+2.90)#4,566 |
| 29. | Lake Mary Ronan | 14.3% | 7.2%(+7.10)#29 | 11.4%(+2.90)#4,568 |
| 30. | Olney | 13.7% | 7.2%(+6.50)#30 | 11.4%(+2.30)#4,809 |
| 31. | Whitefish | 13.4% | 7.2%(+6.20)#31 | 11.4%(+2.00)#4,897 |
| 32. | Rollins | 13.0% | 7.2%(+5.80)#32 | 11.4%(+1.60)#5,088 |
| 33. | Gallatin Gateway | 12.7% | 7.2%(+5.50)#33 | 11.4%(+1.30)#5,209 |
| 34. | Reserve | 12.5% | 7.2%(+5.30)#34 | 11.4%(+1.10)#5,320 |
| 35. | Bearcreek | 12.2% | 7.2%(+5.00)#35 | 11.4%(+0.800)#5,464 |
| 36. | Rocky Point | 12.0% | 7.2%(+4.80)#36 | 11.4%(+0.600)#5,555 |
| 37. | Stanford | 11.9% | 7.2%(+4.70)#37 | 11.4%(+0.500)#5,597 |
| 38. | Bozeman | 10.9% | 7.2%(+3.70)#38 | 11.4%(-0.500)#6,003 |
| 39. | Maverick Mountain | 10.7% | 7.2%(+3.50)#39 | 11.4%(-0.700)#6,156 |
| 40. | Helena Valley West Central | 10.3% | 7.2%(+3.10)#40 | 11.4%(-1.10)#6,333 |
| 41. | Lakeside | 10.3% | 7.2%(+3.10)#41 | 11.4%(-1.10)#6,345 |
| 42. | Trout Creek | 10.3% | 7.2%(+3.10)#42 | 11.4%(-1.10)#6,365 |
| 43. | Baker | 10.0% | 7.2%(+2.80)#43 | 11.4%(-1.40)#6,515 |
| 44. | Joplin | 10.0% | 7.2%(+2.80)#44 | 11.4%(-1.40)#6,534 |
| 45. | Silver Star | 10.0% | 7.2%(+2.80)#45 | 11.4%(-1.40)#6,541 |
| 46. | Big Sky | 9.9% | 7.2%(+2.70)#46 | 11.4%(-1.50)#6,580 |
| 47. | Bonner West Riverside | 9.8% | 7.2%(+2.60)#47 | 11.4%(-1.60)#6,670 |
| 48. | Elliston | 9.8% | 7.2%(+2.60)#48 | 11.4%(-1.60)#6,690 |
| 49. | Edgar | 9.4% | 7.2%(+2.20)#49 | 11.4%(-2.00)#6,962 |
| 50. | Chinook | 9.3% | 7.2%(+2.10)#50 | 11.4%(-2.10)#7,003 |
| 51. | Bear Dance | 9.3% | 7.2%(+2.10)#51 | 11.4%(-2.10)#7,022 |
| 52. | Belgrade | 8.9% | 7.2%(+1.70)#52 | 11.4%(-2.50)#7,235 |
| 53. | Evaro | 8.9% | 7.2%(+1.70)#53 | 11.4%(-2.50)#7,267 |
| 54. | Billings | 8.8% | 7.2%(+1.60)#54 | 11.4%(-2.60)#7,284 |
| 55. | Manhattan | 8.7% | 7.2%(+1.50)#55 | 11.4%(-2.70)#7,395 |
| 56. | Absarokee | 8.7% | 7.2%(+1.50)#56 | 11.4%(-2.70)#7,402 |
| 57. | Pryor | 8.7% | 7.2%(+1.50)#57 | 11.4%(-2.70)#7,407 |
| 58. | Wisdom | 8.7% | 7.2%(+1.50)#58 | 11.4%(-2.70)#7,419 |
| 59. | Kerr | 8.5% | 7.2%(+1.30)#59 | 11.4%(-2.90)#7,568 |
| 60. | Turner | 8.1% | 7.2%(+0.900)#60 | 11.4%(-3.30)#7,901 |
| 61. | Lockwood | 7.9% | 7.2%(+0.700)#61 | 11.4%(-3.50)#8,004 |
| 62. | Rader Creek | 7.9% | 7.2%(+0.700)#62 | 11.4%(-3.50)#8,050 |
| 63. | Ravalli | 7.9% | 7.2%(+0.700)#63 | 11.4%(-3.50)#8,053 |
| 64. | Columbia Falls | 7.8% | 7.2%(+0.600)#64 | 11.4%(-3.60)#8,082 |
| 65. | Helena | 7.7% | 7.2%(+0.500)#65 | 11.4%(-3.70)#8,152 |
| 66. | Sidney | 7.7% | 7.2%(+0.500)#66 | 11.4%(-3.70)#8,172 |
| 67. | Helena West Side | 7.7% | 7.2%(+0.500)#67 | 11.4%(-3.70)#8,193 |
| 68. | Red Lodge | 7.6% | 7.2%(+0.400)#68 | 11.4%(-3.80)#8,276 |
| 69. | Colstrip | 7.5% | 7.2%(+0.300)#69 | 11.4%(-3.90)#8,360 |
| 70. | Coram | 7.5% | 7.2%(+0.300)#70 | 11.4%(-3.90)#8,386 |
| 71. | Fortine | 7.5% | 7.2%(+0.300)#71 | 11.4%(-3.90)#8,387 |
| 72. | Laurel | 7.4% | 7.2%(+0.200)#72 | 11.4%(-4.00)#8,427 |
| 73. | Orchard Homes | 7.4% | 7.2%(+0.200)#73 | 11.4%(-4.00)#8,435 |
| 74. | Churchill | 7.4% | 7.2%(+0.200)#74 | 11.4%(-4.00)#8,461 |
| 75. | Forest Hill Village | 7.3% | 7.2%(+0.100)#75 | 11.4%(-4.10)#8,577 |
| 76. | Shelby | 7.2% | 7.2%(=0.000)#76 | 11.4%(-4.20)#8,621 |
| 77. | Glen | 7.1% | 7.2%(-0.100)#77 | 11.4%(-4.30)#8,761 |
| 78. | Unionville | 7.0% | 7.2%(-0.200)#78 | 11.4%(-4.40)#8,851 |
| 79. | New Miami Colony | 7.0% | 7.2%(-0.200)#79 | 11.4%(-4.40)#8,858 |
| 80. | Missoula | 6.9% | 7.2%(-0.300)#80 | 11.4%(-4.50)#8,868 |
| 81. | Belfry | 6.8% | 7.2%(-0.400)#81 | 11.4%(-4.60)#9,085 |
| 82. | King Arthur Park | 6.5% | 7.2%(-0.700)#82 | 11.4%(-4.90)#9,367 |
| 83. | Shepherd | 6.5% | 7.2%(-0.700)#83 | 11.4%(-4.90)#9,393 |
| 84. | Muddy | 6.5% | 7.2%(-0.700)#84 | 11.4%(-4.90)#9,396 |
| 85. | Plentywood | 6.4% | 7.2%(-0.800)#85 | 11.4%(-5.00)#9,484 |
| 86. | Rimrock Colony | 6.3% | 7.2%(-0.900)#86 | 11.4%(-5.10)#9,659 |
| 87. | Swan Lake | 6.0% | 7.2%(-1.20)#87 | 11.4%(-5.40)#10,029 |
| 88. | West Yellowstone | 5.9% | 7.2%(-1.30)#88 | 11.4%(-5.50)#10,114 |
| 89. | Walkerville | 5.9% | 7.2%(-1.30)#89 | 11.4%(-5.50)#10,130 |
| 90. | Amsterdam | 5.8% | 7.2%(-1.40)#90 | 11.4%(-5.60)#10,300 |
| 91. | Sylvanite | 5.7% | 7.2%(-1.50)#91 | 11.4%(-5.70)#10,429 |
| 92. | Livingston | 5.6% | 7.2%(-1.60)#92 | 11.4%(-5.80)#10,461 |
| 93. | North Harlem Colony | 5.6% | 7.2%(-1.60)#93 | 11.4%(-5.80)#10,596 |
| 94. | Fort Peck | 5.5% | 7.2%(-1.70)#94 | 11.4%(-5.90)#10,733 |
| 95. | Virginia City | 5.4% | 7.2%(-1.80)#95 | 11.4%(-6.00)#10,867 |
| 96. | Beaver Creek | 5.3% | 7.2%(-1.90)#96 | 11.4%(-6.10)#11,003 |
| 97. | Lavina | 5.3% | 7.2%(-1.90)#97 | 11.4%(-6.10)#11,023 |
| 98. | Clancy | 5.2% | 7.2%(-2.00)#98 | 11.4%(-6.20)#11,102 |
| 99. | Helena Flats | 5.2% | 7.2%(-2.00)#99 | 11.4%(-6.20)#11,123 |
| 100. | Hinsdale | 5.2% | 7.2%(-2.00)#100 | 11.4%(-6.20)#11,161 |
Common Questions
What are the Top 10 Cities with the Highest Percentage of Households with Income Above $200,000 in Montana?
Top 10 Cities with the Highest Percentage of Households with Income Above $200,000 in Montana are:
#1
50.9%
#2
45.5%
#3
34.6%
#4
29.0%
#5
23.5%
#6
23.3%
#7
22.0%
#8
19.9%
#9
18.8%
#10
18.7%
What city has the Highest Percentage of Households with Income Above $200,000 in Montana?
Silver Gate has the Highest Percentage of Households with Income Above $200,000 in Montana with 50.9%.
What is the Percentage of Households with Income Above $200,000 in the State of Montana?
Percentage of Households with Income Above $200,000 in Montana is 7.2%.
What is the Percentage of Households with Income Above $200,000 in the United States?
Percentage of Households with Income Above $200,000 in the United States is 11.4%.