Attica, MI Map & Demographics
Attica Map
Attica Overview
$49,173
PER CAPITA INCOME
$53,561
AVG FAMILY INCOME
$73,952
AVG HOUSEHOLD INCOME
76.0%
WAGE / INCOME GAP [ % ]
24.0¢/ $1
WAGE / INCOME GAP [ $ ]
0.50
INEQUALITY / GINI INDEX
1,009
TOTAL POPULATION
497
MALE POPULATION
512
FEMALE POPULATION
97.07
MALES / 100 FEMALES
103.02
FEMALES / 100 MALES
56.4
MEDIAN AGE
2.5
AVG FAMILY SIZE
2.4
AVG HOUSEHOLD SIZE
523
LABOR FORCE [ PEOPLE ]
56.7%
PERCENT IN LABOR FORCE
2.5%
UNEMPLOYMENT RATE
Attica Zip Codes
Attica Area Codes
Income in Attica
Income Overview in Attica
Per Capita Income in Attica is $49,173, while median incomes of families and households are $53,561 and $73,952 respectively.
| Characteristic | Number | Measure |
| Per Capita Income | 1,009 | $49,173 |
| Median Family Income | 328 | $53,561 |
| Mean Family Income | 328 | $77,440 |
| Median Household Income | 420 | $73,952 |
| Mean Household Income | 420 | $116,988 |
| Income Deficit | 328 | $0 |
| Wage / Income Gap (%) | 1,009 | 75.99% |
| Wage / Income Gap ($) | 1,009 | 24.01¢ per $1 |
| Gini / Inequality Index | 1,009 | 0.50 |
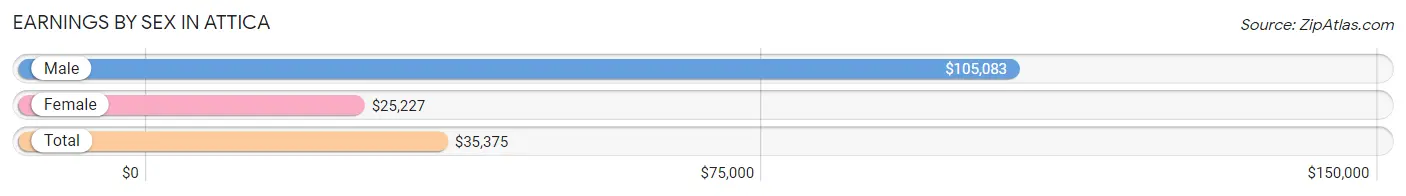
Earnings by Sex in Attica
Average Earnings in Attica are $35,375, $105,083 for men and $25,227 for women, a difference of 76.0%.
| Sex | Number | Average Earnings |
| Male | 282 (48.8%) | $105,083 |
| Female | 296 (51.2%) | $25,227 |
| Total | 578 (100.0%) | $35,375 |
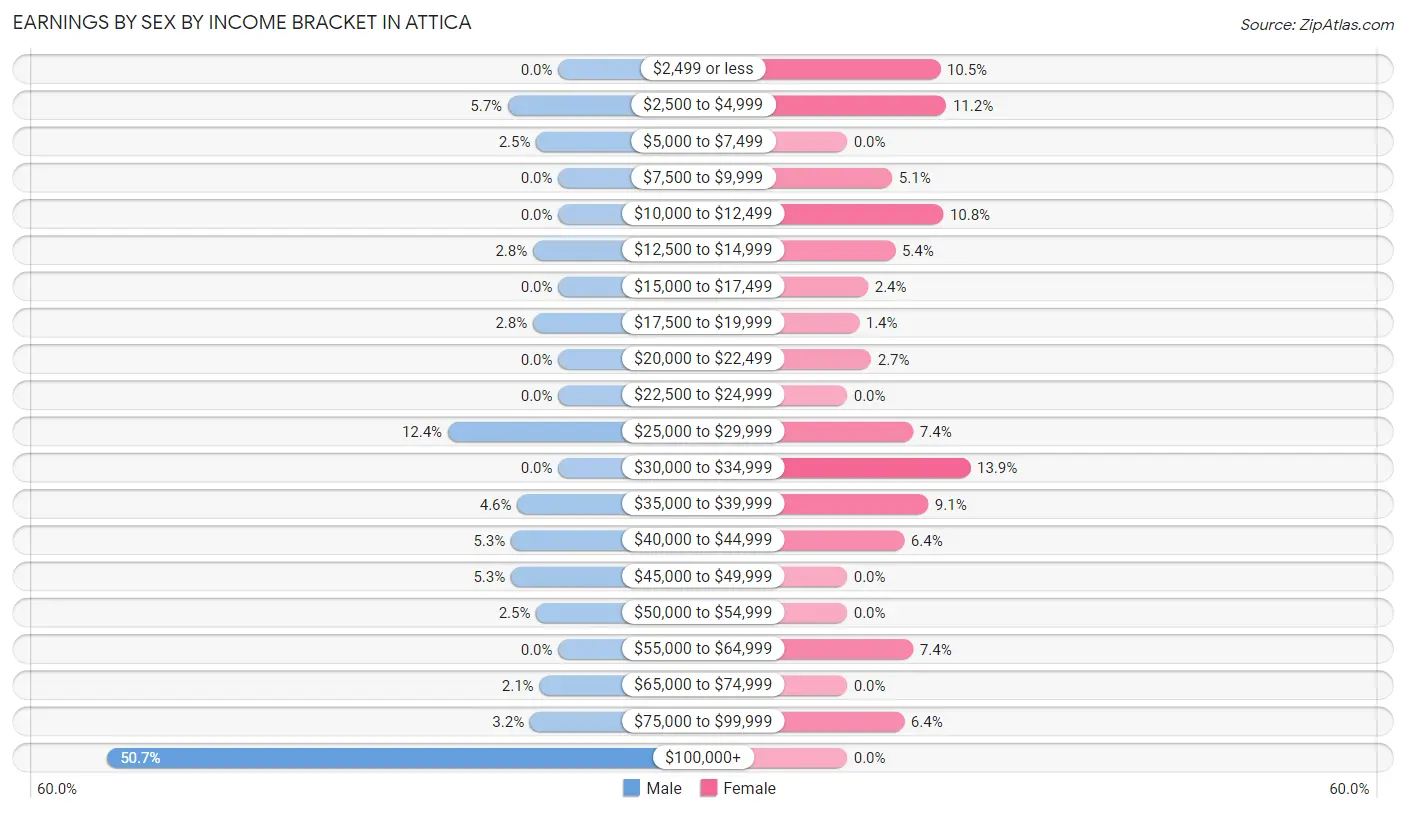
Earnings by Sex by Income Bracket in Attica
The most common earnings brackets in Attica are $100,000+ for men (143 | 50.7%) and $30,000 to $34,999 for women (41 | 13.9%).
| Income | Male | Female |
| $2,499 or less | 0 (0.0%) | 31 (10.5%) |
| $2,500 to $4,999 | 16 (5.7%) | 33 (11.2%) |
| $5,000 to $7,499 | 7 (2.5%) | 0 (0.0%) |
| $7,500 to $9,999 | 0 (0.0%) | 15 (5.1%) |
| $10,000 to $12,499 | 0 (0.0%) | 32 (10.8%) |
| $12,500 to $14,999 | 8 (2.8%) | 16 (5.4%) |
| $15,000 to $17,499 | 0 (0.0%) | 7 (2.4%) |
| $17,500 to $19,999 | 8 (2.8%) | 4 (1.3%) |
| $20,000 to $22,499 | 0 (0.0%) | 8 (2.7%) |
| $22,500 to $24,999 | 0 (0.0%) | 0 (0.0%) |
| $25,000 to $29,999 | 35 (12.4%) | 22 (7.4%) |
| $30,000 to $34,999 | 0 (0.0%) | 41 (13.9%) |
| $35,000 to $39,999 | 13 (4.6%) | 27 (9.1%) |
| $40,000 to $44,999 | 15 (5.3%) | 19 (6.4%) |
| $45,000 to $49,999 | 15 (5.3%) | 0 (0.0%) |
| $50,000 to $54,999 | 7 (2.5%) | 0 (0.0%) |
| $55,000 to $64,999 | 0 (0.0%) | 22 (7.4%) |
| $65,000 to $74,999 | 6 (2.1%) | 0 (0.0%) |
| $75,000 to $99,999 | 9 (3.2%) | 19 (6.4%) |
| $100,000+ | 143 (50.7%) | 0 (0.0%) |
| Total | 282 (100.0%) | 296 (100.0%) |
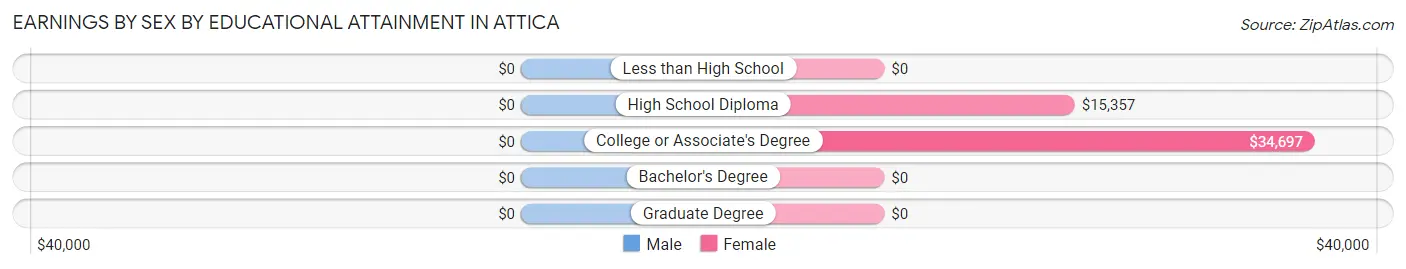
Earnings by Sex by Educational Attainment in Attica
| Educational Attainment | Male Income | Female Income |
| Less than High School | - | - |
| High School Diploma | - | - |
| College or Associate's Degree | - | - |
| Bachelor's Degree | - | - |
| Graduate Degree | - | - |
| Total | $105,542 | $27,045 |
Family Income in Attica
Family Income Brackets in Attica
According to the Attica family income data, there are 64 families falling into the $50,000 to $74,999 income range, which is the most common income bracket and makes up 19.5% of all families.
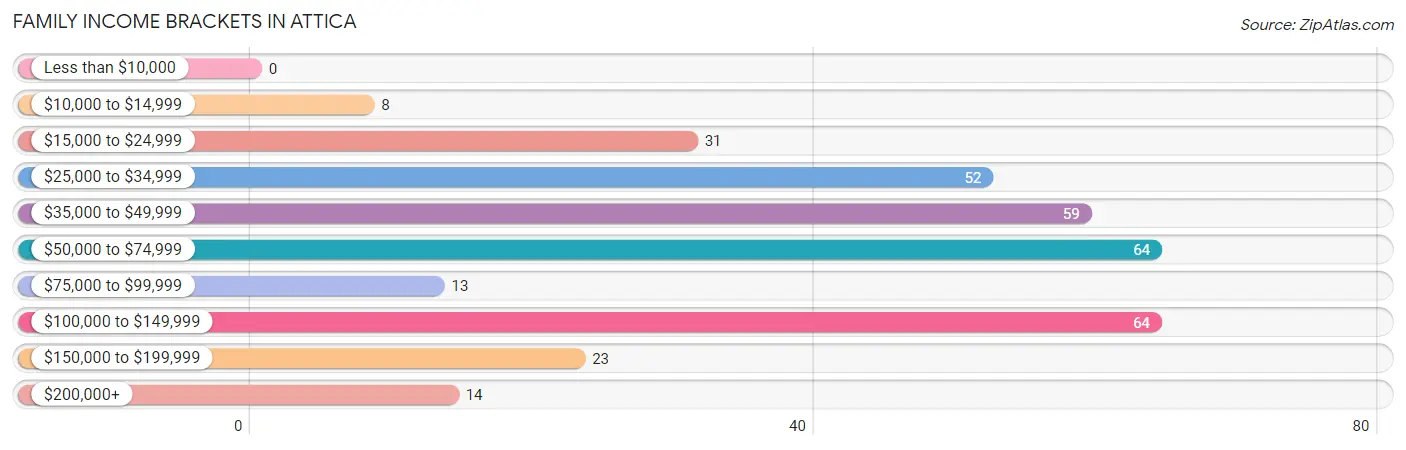
| Income Bracket | # Families | % Families |
| Less than $10,000 | 0 | 0.0% |
| $10,000 to $14,999 | 8 | 2.4% |
| $15,000 to $24,999 | 31 | 9.5% |
| $25,000 to $34,999 | 52 | 15.9% |
| $35,000 to $49,999 | 59 | 18.0% |
| $50,000 to $74,999 | 64 | 19.5% |
| $75,000 to $99,999 | 13 | 4.0% |
| $100,000 to $149,999 | 64 | 19.5% |
| $150,000 to $199,999 | 23 | 7.0% |
| $200,000+ | 14 | 4.3% |
Family Income by Famaliy Size in Attica
4-person families (30 | 9.1%) account for the highest median family income in Attica with $176,000 per family, while 4-person families (30 | 9.1%) have the highest median income of $44,000 per family member.
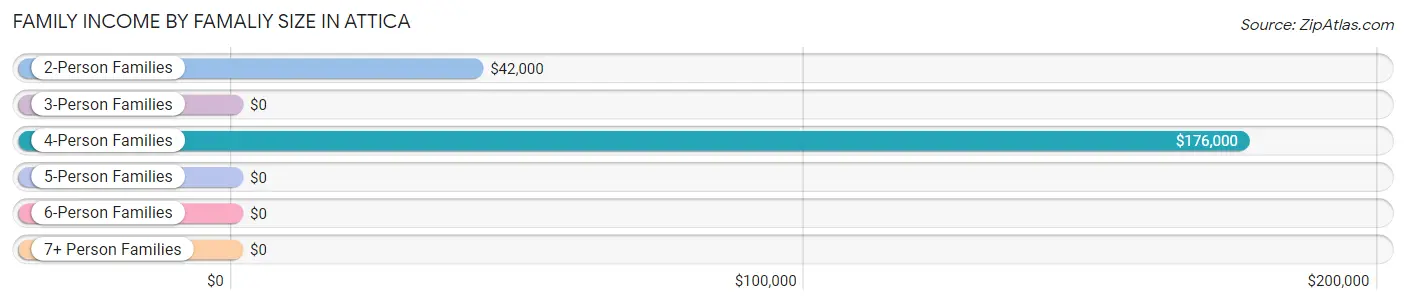
| Income Bracket | # Families | Median Income |
| 2-Person Families | 222 (67.7%) | $42,000 |
| 3-Person Families | 65 (19.8%) | $0 |
| 4-Person Families | 30 (9.1%) | $176,000 |
| 5-Person Families | 4 (1.2%) | $0 |
| 6-Person Families | 7 (2.1%) | $0 |
| 7+ Person Families | 0 (0.0%) | $0 |
| Total | 328 (100.0%) | $53,561 |
Family Income by Number of Earners in Attica
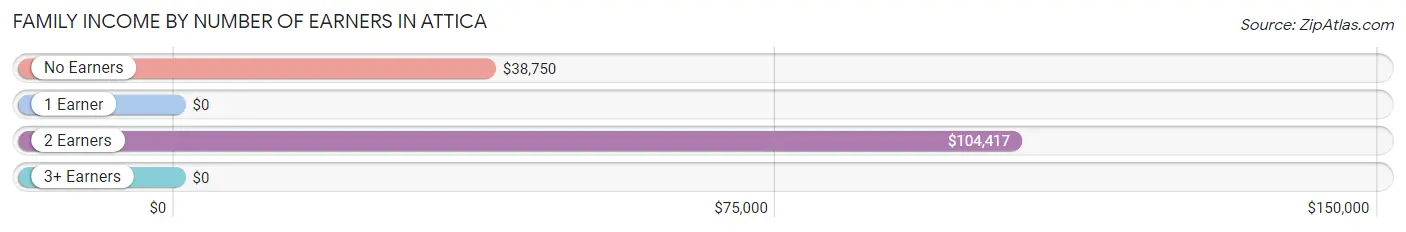
| Number of Earners | # Families | Median Income |
| No Earners | 126 (38.4%) | $38,750 |
| 1 Earner | 52 (15.9%) | $0 |
| 2 Earners | 111 (33.8%) | $104,417 |
| 3+ Earners | 39 (11.9%) | $0 |
| Total | 328 (100.0%) | $53,561 |
Household Income in Attica
Household Income Brackets in Attica
With 104 households falling in the category, the $100,000 to $149,999 income range is the most frequent in Attica, accounting for 24.8% of all households. In contrast, only 8 households (1.9%) fall into the $10,000 to $14,999 income bracket, making it the least populous group.
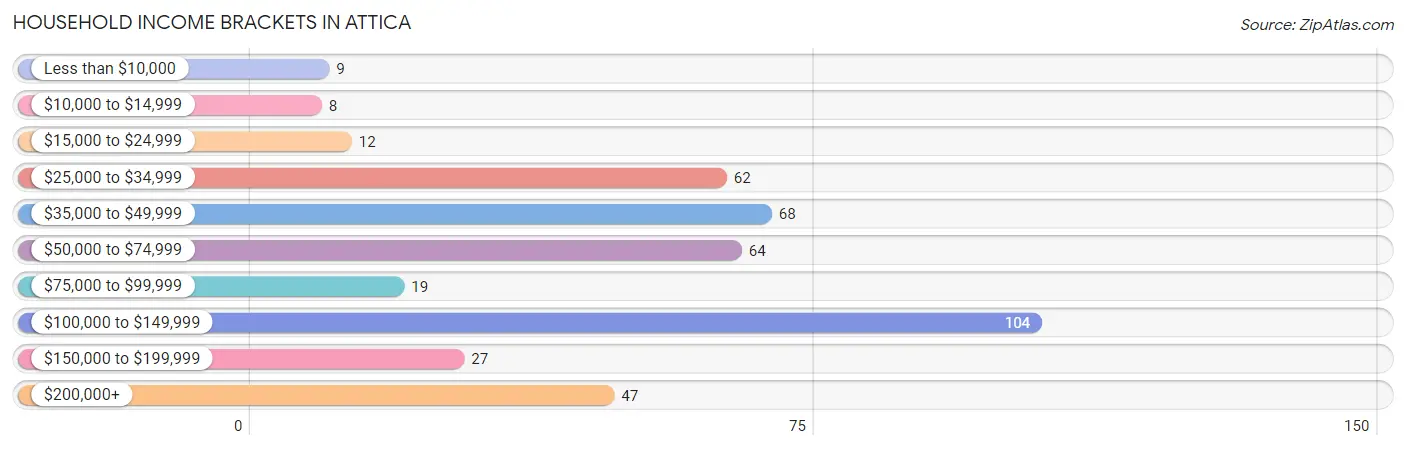
| Income Bracket | # Households | % Households |
| Less than $10,000 | 9 | 2.1% |
| $10,000 to $14,999 | 8 | 1.9% |
| $15,000 to $24,999 | 12 | 2.9% |
| $25,000 to $34,999 | 62 | 14.8% |
| $35,000 to $49,999 | 68 | 16.2% |
| $50,000 to $74,999 | 64 | 15.2% |
| $75,000 to $99,999 | 19 | 4.5% |
| $100,000 to $149,999 | 104 | 24.8% |
| $150,000 to $199,999 | 27 | 6.4% |
| $200,000+ | 47 | 11.2% |
Household Income by Householder Age in Attica
The median household income in Attica is $73,952, with the highest median household income of $123,508 found in the 45 to 64 years age bracket for the primary householder. A total of 149 households (35.5%) fall into this category.
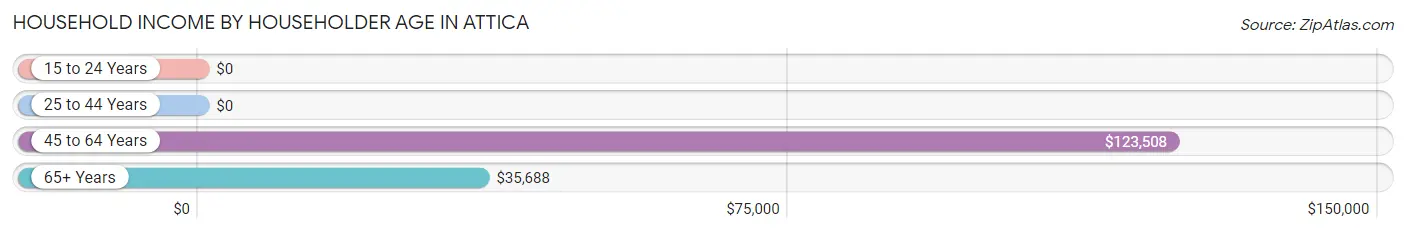
| Income Bracket | # Households | Median Income |
| 15 to 24 Years | 0 (0.0%) | $0 |
| 25 to 44 Years | 78 (18.6%) | $0 |
| 45 to 64 Years | 149 (35.5%) | $123,508 |
| 65+ Years | 193 (46.0%) | $35,688 |
| Total | 420 (100.0%) | $73,952 |
Poverty in Attica
Income Below Poverty by Sex and Age in Attica
With 9.7% poverty level for males and 14.4% for females among the residents of Attica, 12 to 14 year old males and 55 to 64 year old females are the most vulnerable to poverty, with 31 males (100.0%) and 31 females (33.7%) in their respective age groups living below the poverty level.
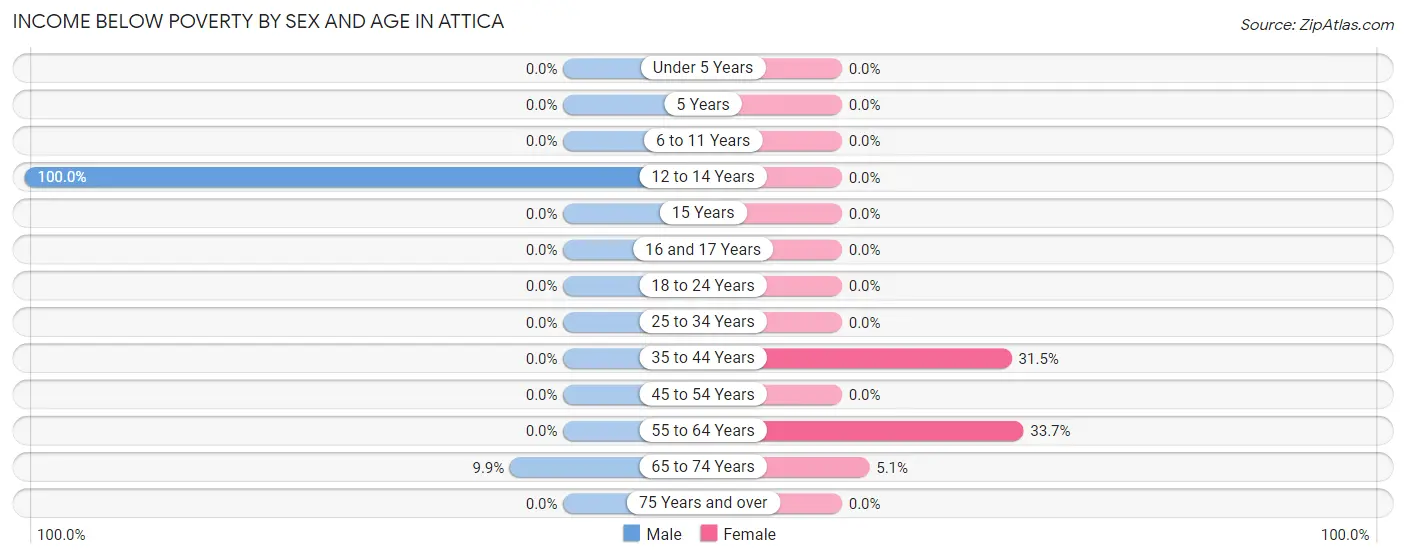
| Age Bracket | Male | Female |
| Under 5 Years | 0 (0.0%) | 0 (0.0%) |
| 5 Years | 0 (0.0%) | 0 (0.0%) |
| 6 to 11 Years | 0 (0.0%) | 0 (0.0%) |
| 12 to 14 Years | 31 (100.0%) | 0 (0.0%) |
| 15 Years | 0 (0.0%) | 0 (0.0%) |
| 16 and 17 Years | 0 (0.0%) | 0 (0.0%) |
| 18 to 24 Years | 0 (0.0%) | 0 (0.0%) |
| 25 to 34 Years | 0 (0.0%) | 0 (0.0%) |
| 35 to 44 Years | 0 (0.0%) | 35 (31.5%) |
| 45 to 54 Years | 0 (0.0%) | 0 (0.0%) |
| 55 to 64 Years | 0 (0.0%) | 31 (33.7%) |
| 65 to 74 Years | 17 (9.9%) | 8 (5.1%) |
| 75 Years and over | 0 (0.0%) | 0 (0.0%) |
| Total | 48 (9.7%) | 74 (14.4%) |
Income Above Poverty by Sex and Age in Attica
According to the poverty statistics in Attica, males aged under 5 years and females aged 6 to 11 years are the age groups that are most secure financially, with 100.0% of males and 100.0% of females in these age groups living above the poverty line.
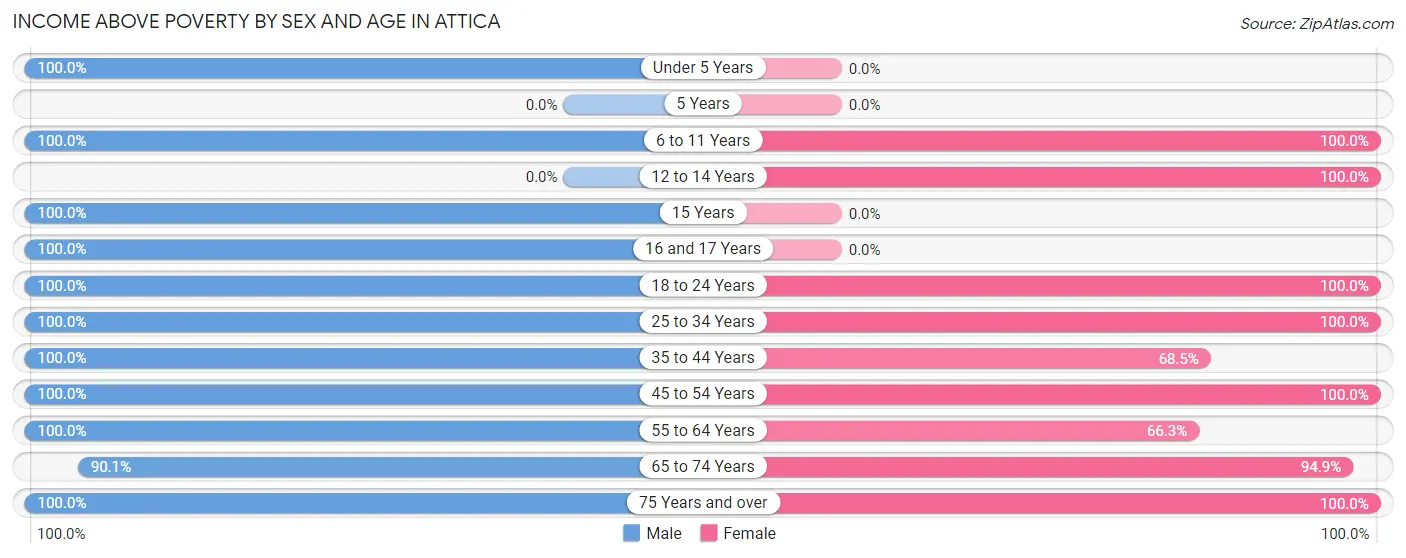
| Age Bracket | Male | Female |
| Under 5 Years | 9 (100.0%) | 0 (0.0%) |
| 5 Years | 0 (0.0%) | 0 (0.0%) |
| 6 to 11 Years | 25 (100.0%) | 5 (100.0%) |
| 12 to 14 Years | 0 (0.0%) | 10 (100.0%) |
| 15 Years | 6 (100.0%) | 0 (0.0%) |
| 16 and 17 Years | 7 (100.0%) | 0 (0.0%) |
| 18 to 24 Years | 15 (100.0%) | 54 (100.0%) |
| 25 to 34 Years | 37 (100.0%) | 31 (100.0%) |
| 35 to 44 Years | 83 (100.0%) | 76 (68.5%) |
| 45 to 54 Years | 29 (100.0%) | 31 (100.0%) |
| 55 to 64 Years | 61 (100.0%) | 61 (66.3%) |
| 65 to 74 Years | 155 (90.1%) | 149 (94.9%) |
| 75 Years and over | 22 (100.0%) | 21 (100.0%) |
| Total | 449 (90.3%) | 438 (85.6%) |
Income Below Poverty Among Married-Couple Families in Attica
The poverty statistics for married-couple families in Attica show that 3.0% or 8 of the total 269 families live below the poverty line. Families with no children have the highest poverty rate of 3.3%, comprising of 8 families. On the other hand, families with 1 or 2 children have the lowest poverty rate of 0.0%, which includes 0 families.
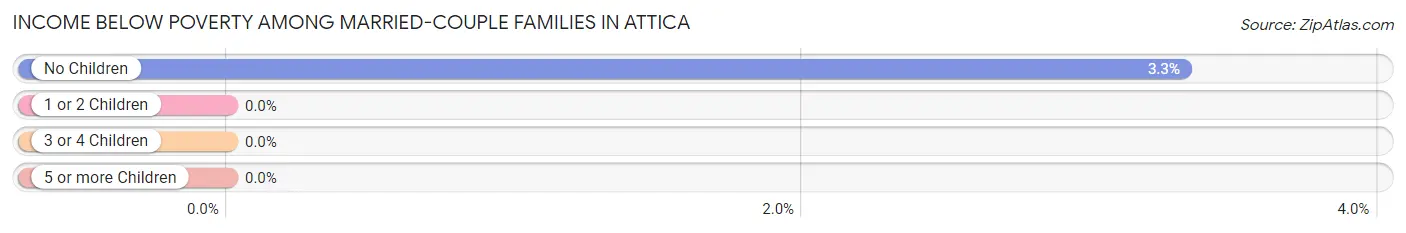
| Children | Above Poverty | Below Poverty |
| No Children | 233 (96.7%) | 8 (3.3%) |
| 1 or 2 Children | 28 (100.0%) | 0 (0.0%) |
| 3 or 4 Children | 0 (0.0%) | 0 (0.0%) |
| 5 or more Children | 0 (0.0%) | 0 (0.0%) |
| Total | 261 (97.0%) | 8 (3.0%) |
Income Below Poverty Among Single-Parent Households in Attica
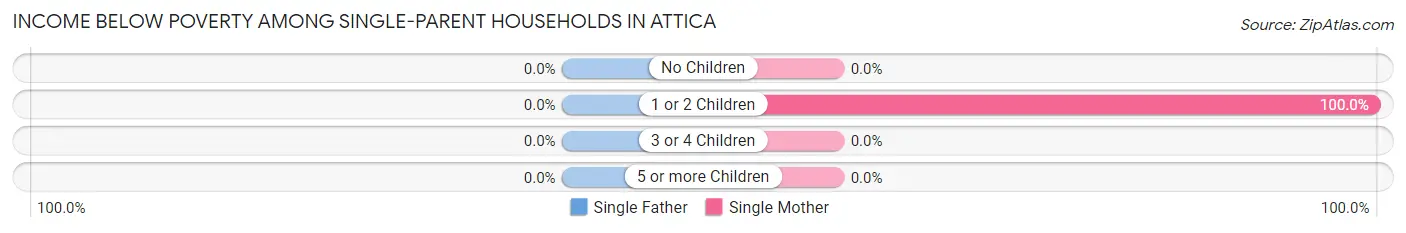
| Children | Single Father | Single Mother |
| No Children | 0 (0.0%) | 0 (0.0%) |
| 1 or 2 Children | 0 (0.0%) | 31 (100.0%) |
| 3 or 4 Children | 0 (0.0%) | 0 (0.0%) |
| 5 or more Children | 0 (0.0%) | 0 (0.0%) |
| Total | 0 (0.0%) | 31 (81.6%) |
Income Below Poverty Among Married-Couple vs Single-Parent Households in Attica
The poverty data for Attica shows that 8 of the married-couple family households (3.0%) and 31 of the single-parent households (52.5%) are living below the poverty level. Within the married-couple family households, those with no children have the highest poverty rate, with 8 households (3.3%) falling below the poverty line. Among the single-parent households, those with 1 or 2 children have the highest poverty rate, with 31 household (100.0%) living below poverty.
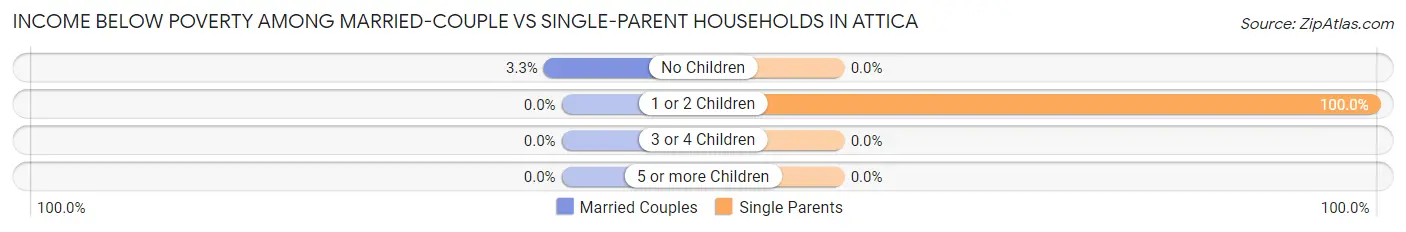
| Children | Married-Couple Families | Single-Parent Households |
| No Children | 8 (3.3%) | 0 (0.0%) |
| 1 or 2 Children | 0 (0.0%) | 31 (100.0%) |
| 3 or 4 Children | 0 (0.0%) | 0 (0.0%) |
| 5 or more Children | 0 (0.0%) | 0 (0.0%) |
| Total | 8 (3.0%) | 31 (52.5%) |
Race in Attica
The most populous races in Attica are White / Caucasian (994 | 98.5%), Two or more Races (12 | 1.2%), and Hispanic or Latino (9 | 0.9%).
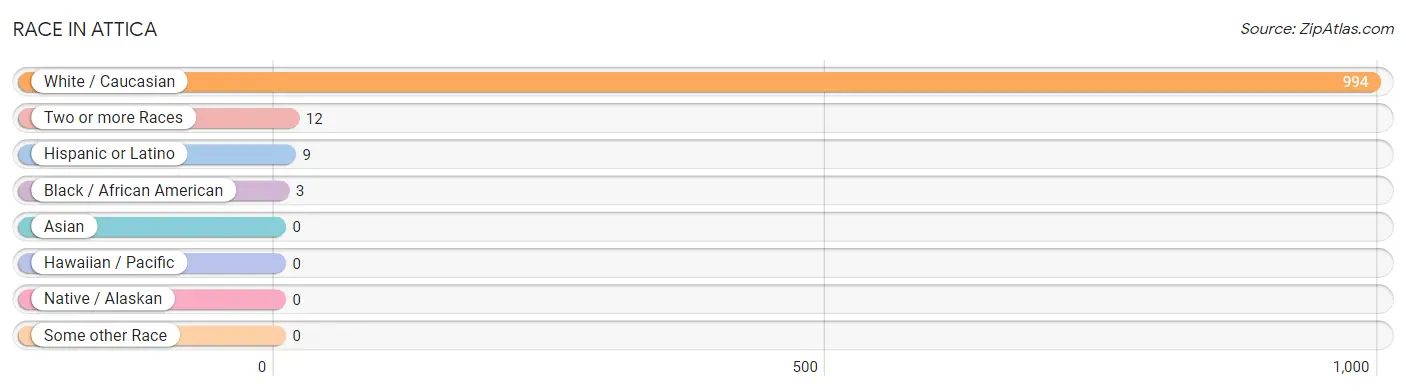
| Race | # Population | % Population |
| Asian | 0 | 0.0% |
| Black / African American | 3 | 0.3% |
| Hawaiian / Pacific | 0 | 0.0% |
| Hispanic or Latino | 9 | 0.9% |
| Native / Alaskan | 0 | 0.0% |
| White / Caucasian | 994 | 98.5% |
| Two or more Races | 12 | 1.2% |
| Some other Race | 0 | 0.0% |
| Total | 1,009 | 100.0% |
Ancestry in Attica
The most populous ancestries reported in Attica are German (256 | 25.4%), English (180 | 17.8%), American (119 | 11.8%), French (83 | 8.2%), and Irish (52 | 5.1%), together accounting for 68.4% of all Attica residents.
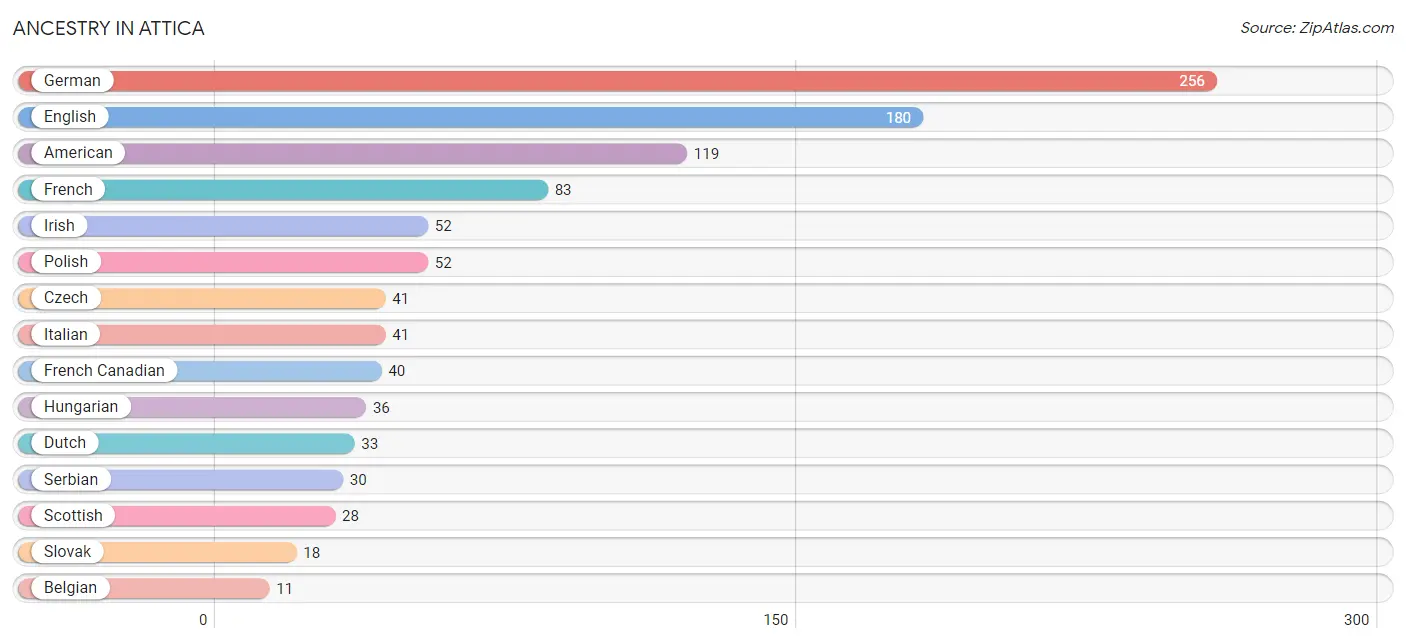
| Ancestry | # Population | % Population |
| American | 119 | 11.8% |
| Belgian | 11 | 1.1% |
| Colombian | 9 | 0.9% |
| Czech | 41 | 4.1% |
| Dutch | 33 | 3.3% |
| English | 180 | 17.8% |
| Finnish | 6 | 0.6% |
| French | 83 | 8.2% |
| French Canadian | 40 | 4.0% |
| German | 256 | 25.4% |
| Hungarian | 36 | 3.6% |
| Irish | 52 | 5.1% |
| Italian | 41 | 4.1% |
| Native Hawaiian | 3 | 0.3% |
| Polish | 52 | 5.1% |
| Scotch-Irish | 7 | 0.7% |
| Scottish | 28 | 2.8% |
| Serbian | 30 | 3.0% |
| Slovak | 18 | 1.8% |
| South American | 9 | 0.9% |
| Swedish | 9 | 0.9% | View All 21 Rows |
Immigrants in Attica

| Immigration Origin | # Population | % Population | View All 0 Rows |
Sex and Age in Attica
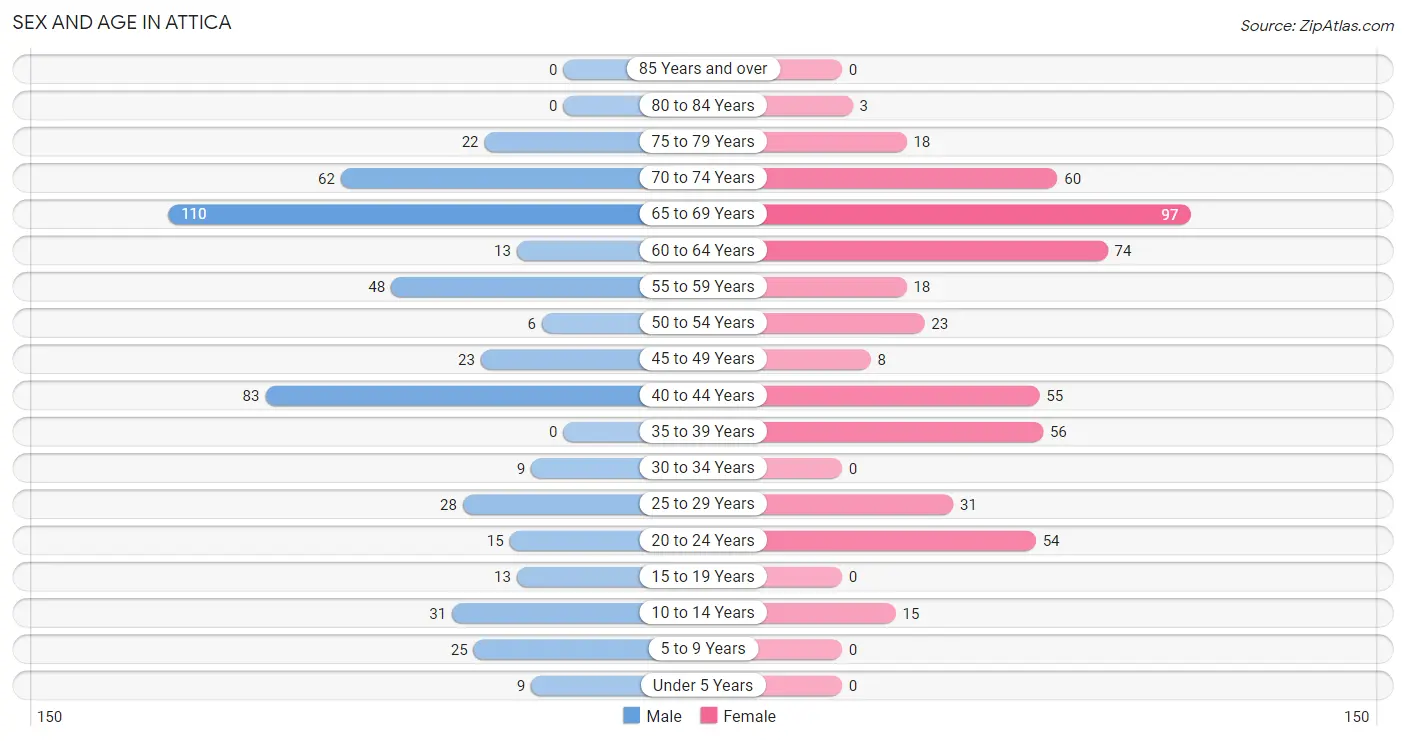
Sex and Age in Attica
The most populous age groups in Attica are 65 to 69 Years (110 | 22.1%) for men and 65 to 69 Years (97 | 19.0%) for women.
| Age Bracket | Male | Female |
| Under 5 Years | 9 (1.8%) | 0 (0.0%) |
| 5 to 9 Years | 25 (5.0%) | 0 (0.0%) |
| 10 to 14 Years | 31 (6.2%) | 15 (2.9%) |
| 15 to 19 Years | 13 (2.6%) | 0 (0.0%) |
| 20 to 24 Years | 15 (3.0%) | 54 (10.5%) |
| 25 to 29 Years | 28 (5.6%) | 31 (6.0%) |
| 30 to 34 Years | 9 (1.8%) | 0 (0.0%) |
| 35 to 39 Years | 0 (0.0%) | 56 (10.9%) |
| 40 to 44 Years | 83 (16.7%) | 55 (10.7%) |
| 45 to 49 Years | 23 (4.6%) | 8 (1.6%) |
| 50 to 54 Years | 6 (1.2%) | 23 (4.5%) |
| 55 to 59 Years | 48 (9.7%) | 18 (3.5%) |
| 60 to 64 Years | 13 (2.6%) | 74 (14.4%) |
| 65 to 69 Years | 110 (22.1%) | 97 (19.0%) |
| 70 to 74 Years | 62 (12.5%) | 60 (11.7%) |
| 75 to 79 Years | 22 (4.4%) | 18 (3.5%) |
| 80 to 84 Years | 0 (0.0%) | 3 (0.6%) |
| 85 Years and over | 0 (0.0%) | 0 (0.0%) |
| Total | 497 (100.0%) | 512 (100.0%) |
Families and Households in Attica
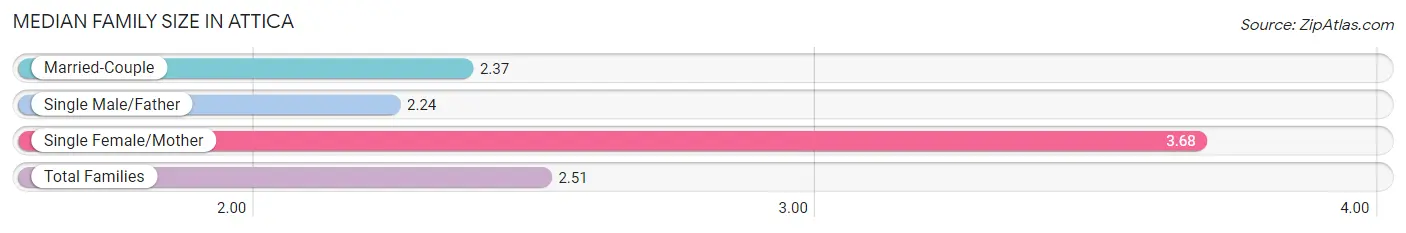
Median Family Size in Attica
The median family size in Attica is 2.51 persons per family, with single female/mother families (38 | 11.6%) accounting for the largest median family size of 3.68 persons per family. On the other hand, single male/father families (21 | 6.4%) represent the smallest median family size with 2.24 persons per family.
| Family Type | # Families | Family Size |
| Married-Couple | 269 (82.0%) | 2.37 |
| Single Male/Father | 21 (6.4%) | 2.24 |
| Single Female/Mother | 38 (11.6%) | 3.68 |
| Total Families | 328 (100.0%) | 2.51 |
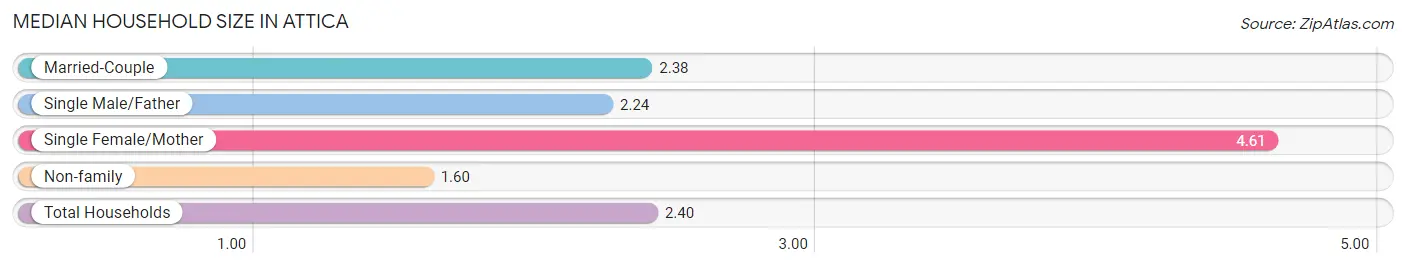
Median Household Size in Attica
The median household size in Attica is 2.40 persons per household, with single female/mother households (38 | 9.0%) accounting for the largest median household size of 4.61 persons per household. non-family households (92 | 21.9%) represent the smallest median household size with 1.60 persons per household.
| Household Type | # Households | Household Size |
| Married-Couple | 269 (64.0%) | 2.38 |
| Single Male/Father | 21 (5.0%) | 2.24 |
| Single Female/Mother | 38 (9.0%) | 4.61 |
| Non-family | 92 (21.9%) | 1.60 |
| Total Households | 420 (100.0%) | 2.40 |
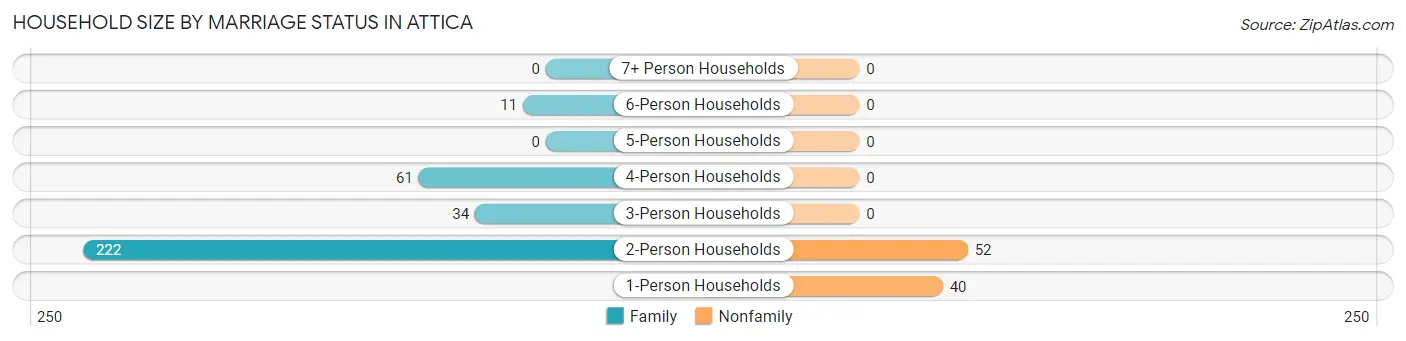
Household Size by Marriage Status in Attica
Out of a total of 420 households in Attica, 328 (78.1%) are family households, while 92 (21.9%) are nonfamily households. The most numerous type of family households are 2-person households, comprising 222, and the most common type of nonfamily households are 2-person households, comprising 52.
| Household Size | Family Households | Nonfamily Households |
| 1-Person Households | - | 40 (9.5%) |
| 2-Person Households | 222 (52.9%) | 52 (12.4%) |
| 3-Person Households | 34 (8.1%) | 0 (0.0%) |
| 4-Person Households | 61 (14.5%) | 0 (0.0%) |
| 5-Person Households | 0 (0.0%) | 0 (0.0%) |
| 6-Person Households | 11 (2.6%) | 0 (0.0%) |
| 7+ Person Households | 0 (0.0%) | 0 (0.0%) |
| Total | 328 (78.1%) | 92 (21.9%) |
Female Fertility in Attica
Fertility by Age in Attica
| Age Bracket | Women with Births | Births / 1,000 Women |
| 15 to 19 years | 0 (0.0%) | 0.0 |
| 20 to 34 years | 0 (0.0%) | 0.0 |
| 35 to 50 years | 0 (0.0%) | 0.0 |
| Total | 0 (0.0%) | 0.0 |
Fertility by Age by Marriage Status in Attica
| Age Bracket | Married | Unmarried |
| 15 to 19 years | 0 (0.0%) | 0 (0.0%) |
| 20 to 34 years | 0 (0.0%) | 0 (0.0%) |
| 35 to 50 years | 0 (0.0%) | 0 (0.0%) |
| Total | 0 (0.0%) | 0 (0.0%) |
Fertility by Education in Attica
| Educational Attainment | Women with Births | Births / 1,000 Women |
| Less than High School | 0 (0.0%) | 0.0 |
| High School Diploma | 0 (0.0%) | 0.0 |
| College or Associate's Degree | 0 (0.0%) | 0.0 |
| Bachelor's Degree | 0 (0.0%) | 0.0 |
| Graduate Degree | 0 (0.0%) | 0.0 |
| Total | 0 (0.0%) | 0.0 |
Fertility by Education by Marriage Status in Attica
| Educational Attainment | Married | Unmarried |
| Less than High School | 0 (0.0%) | 0 (0.0%) |
| High School Diploma | 0 (0.0%) | 0 (0.0%) |
| College or Associate's Degree | 0 (0.0%) | 0 (0.0%) |
| Bachelor's Degree | 0 (0.0%) | 0 (0.0%) |
| Graduate Degree | 0 (0.0%) | 0 (0.0%) |
| Total | 0 (0.0%) | 0 (0.0%) |
Employment Characteristics in Attica
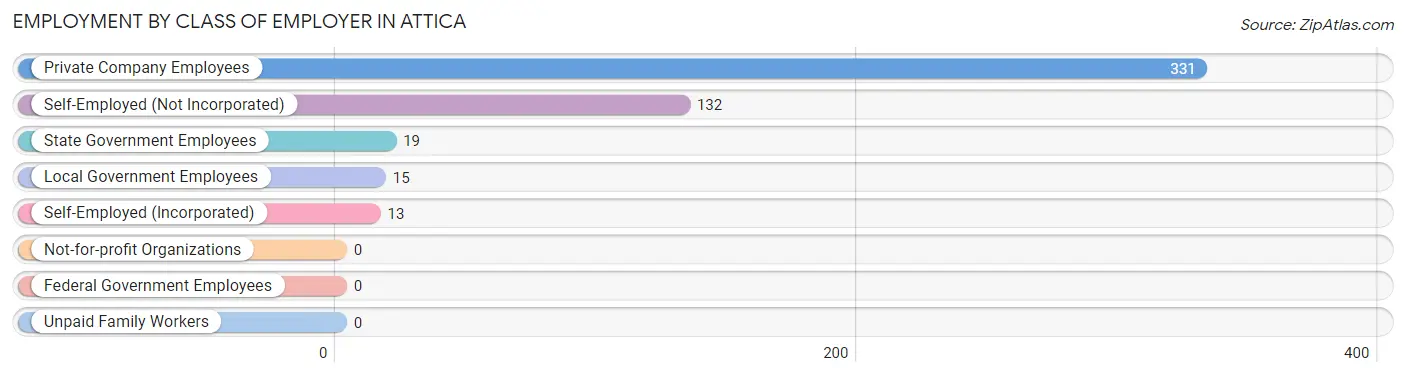
Employment by Class of Employer in Attica
Among the 510 employed individuals in Attica, private company employees (331 | 64.9%), self-employed (not incorporated) (132 | 25.9%), and state government employees (19 | 3.7%) make up the most common classes of employment.
| Employer Class | # Employees | % Employees |
| Private Company Employees | 331 | 64.9% |
| Self-Employed (Incorporated) | 13 | 2.5% |
| Self-Employed (Not Incorporated) | 132 | 25.9% |
| Not-for-profit Organizations | 0 | 0.0% |
| Local Government Employees | 15 | 2.9% |
| State Government Employees | 19 | 3.7% |
| Federal Government Employees | 0 | 0.0% |
| Unpaid Family Workers | 0 | 0.0% |
| Total | 510 | 100.0% |
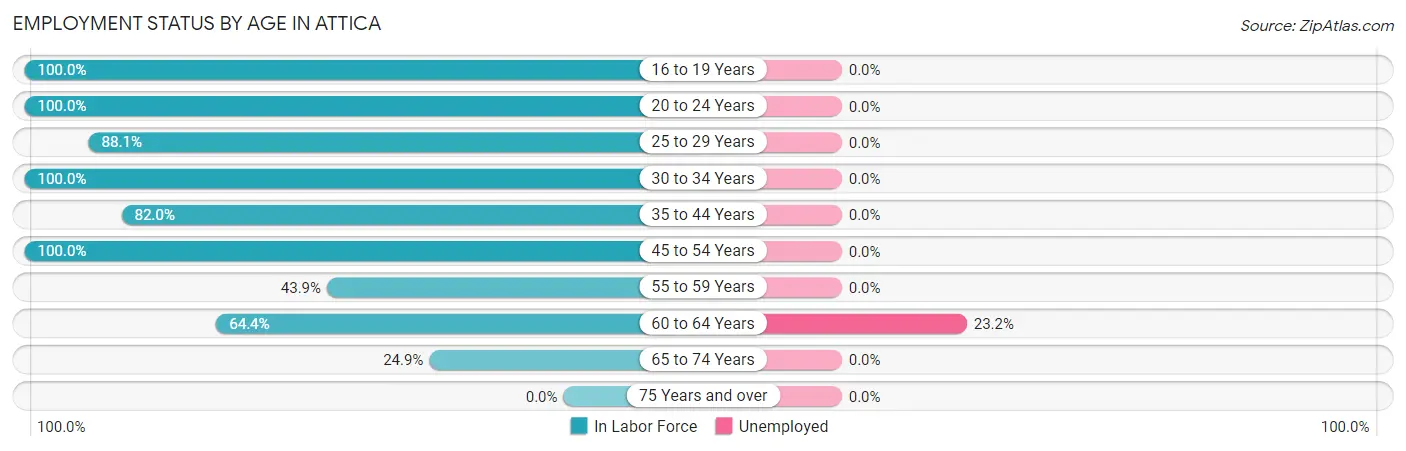
Employment Status by Age in Attica
According to the labor force statistics for Attica, out of the total population over 16 years of age (923), 56.7% or 523 individuals are in the labor force, with 2.5% or 13 of them unemployed. The age group with the highest labor force participation rate is 16 to 19 years, with 100.0% or 7 individuals in the labor force. Within the labor force, the 60 to 64 years age range has the highest percentage of unemployed individuals, with 23.2% or 13 of them being unemployed.
| Age Bracket | In Labor Force | Unemployed |
| 16 to 19 Years | 7 (100.0%) | 0 (0.0%) |
| 20 to 24 Years | 69 (100.0%) | 0 (0.0%) |
| 25 to 29 Years | 52 (88.1%) | 0 (0.0%) |
| 30 to 34 Years | 9 (100.0%) | 0 (0.0%) |
| 35 to 44 Years | 159 (82.0%) | 0 (0.0%) |
| 45 to 54 Years | 60 (100.0%) | 0 (0.0%) |
| 55 to 59 Years | 29 (43.9%) | 0 (0.0%) |
| 60 to 64 Years | 56 (64.4%) | 13 (23.2%) |
| 65 to 74 Years | 82 (24.9%) | 0 (0.0%) |
| 75 Years and over | 0 (0.0%) | 0 (0.0%) |
| Total | 523 (56.7%) | 13 (2.5%) |
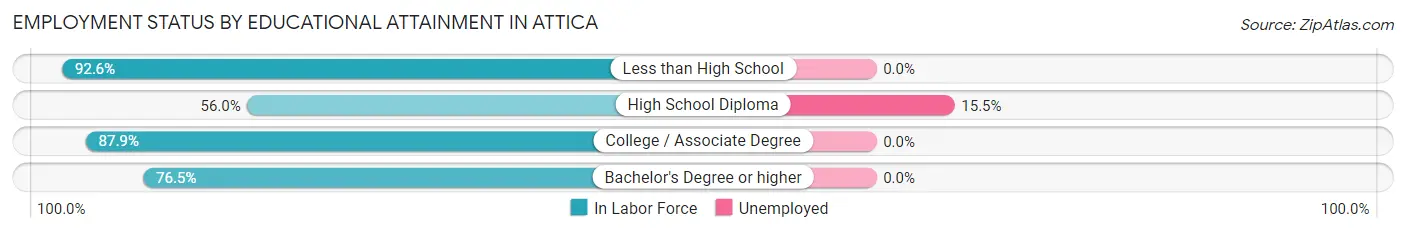
Employment Status by Educational Attainment in Attica
According to labor force statistics for Attica, 76.8% of individuals (365) out of the total population between 25 and 64 years of age (475) are in the labor force, with 3.6% or 13 of them being unemployed. The group with the highest labor force participation rate are those with the educational attainment of less than high school, with 92.6% or 88 individuals in the labor force. Within the labor force, individuals with high school diploma education have the highest percentage of unemployment, with 15.5% or 13 of them being unemployed.
| Educational Attainment | In Labor Force | Unemployed |
| Less than High School | 88 (92.6%) | 0 (0.0%) |
| High School Diploma | 84 (56.0%) | 23 (15.5%) |
| College / Associate Degree | 131 (87.9%) | 0 (0.0%) |
| Bachelor's Degree or higher | 62 (76.5%) | 0 (0.0%) |
| Total | 365 (76.8%) | 17 (3.6%) |
Employment Occupations by Sex in Attica
Management, Business, Science and Arts Occupations
The most common Management, Business, Science and Arts occupations in Attica are Community & Social Service (43 | 8.4%), Computers, Engineering & Science (37 | 7.2%), Architecture & Engineering (37 | 7.2%), Education Instruction & Library (34 | 6.7%), and Business & Financial (20 | 3.9%).
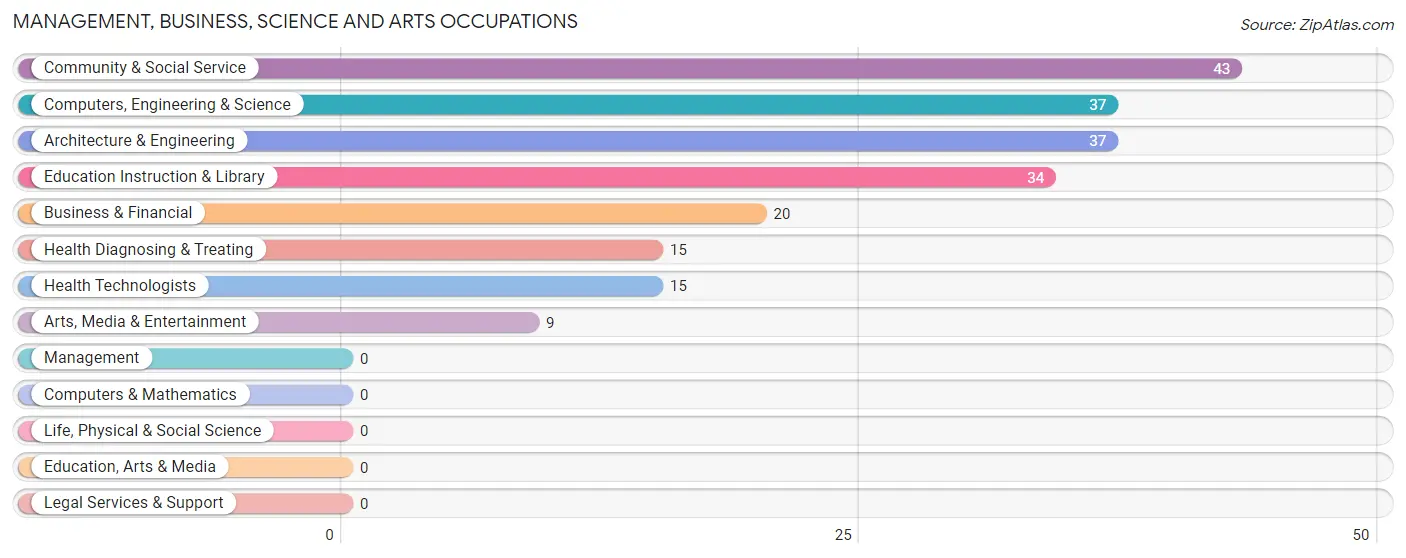
Management, Business, Science and Arts Occupations by Sex
Within the Management, Business, Science and Arts occupations in Attica, the most male-oriented occupations are Computers, Engineering & Science (100.0%), Architecture & Engineering (100.0%), and Business & Financial (45.0%), while the most female-oriented occupations are Arts, Media & Entertainment (100.0%), Health Diagnosing & Treating (100.0%), and Health Technologists (100.0%).
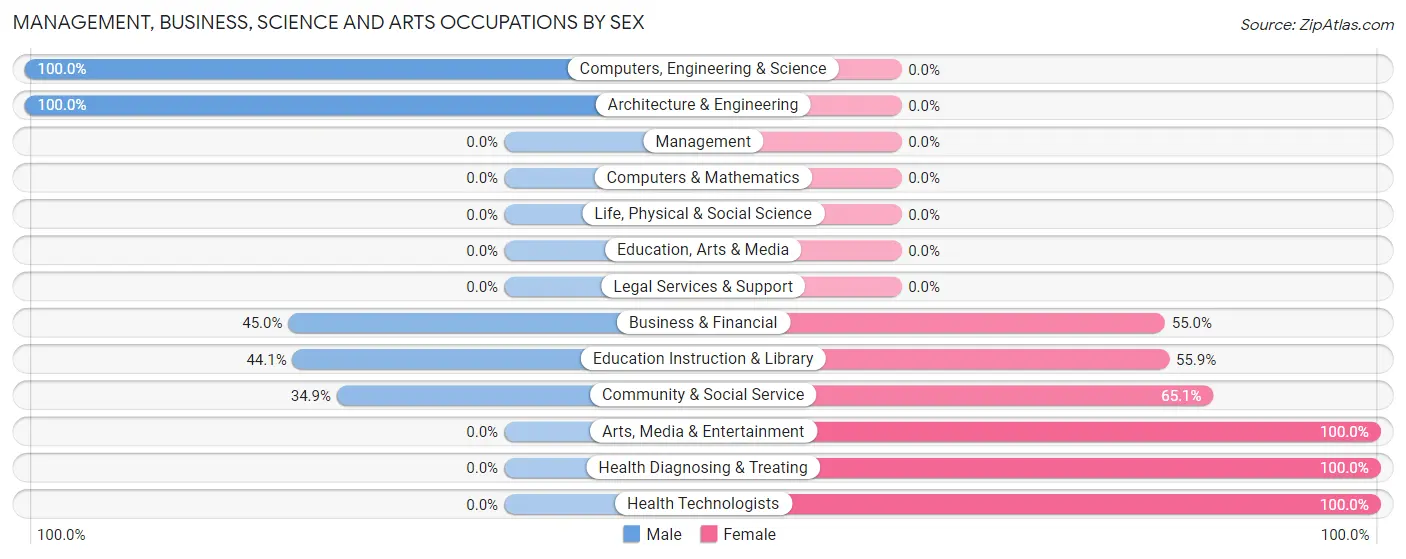
| Occupation | Male | Female |
| Management | 0 (0.0%) | 0 (0.0%) |
| Business & Financial | 9 (45.0%) | 11 (55.0%) |
| Computers, Engineering & Science | 37 (100.0%) | 0 (0.0%) |
| Computers & Mathematics | 0 (0.0%) | 0 (0.0%) |
| Architecture & Engineering | 37 (100.0%) | 0 (0.0%) |
| Life, Physical & Social Science | 0 (0.0%) | 0 (0.0%) |
| Community & Social Service | 15 (34.9%) | 28 (65.1%) |
| Education, Arts & Media | 0 (0.0%) | 0 (0.0%) |
| Legal Services & Support | 0 (0.0%) | 0 (0.0%) |
| Education Instruction & Library | 15 (44.1%) | 19 (55.9%) |
| Arts, Media & Entertainment | 0 (0.0%) | 9 (100.0%) |
| Health Diagnosing & Treating | 0 (0.0%) | 15 (100.0%) |
| Health Technologists | 0 (0.0%) | 15 (100.0%) |
| Total (Category) | 61 (53.0%) | 54 (47.0%) |
| Total (Overall) | 263 (51.6%) | 247 (48.4%) |
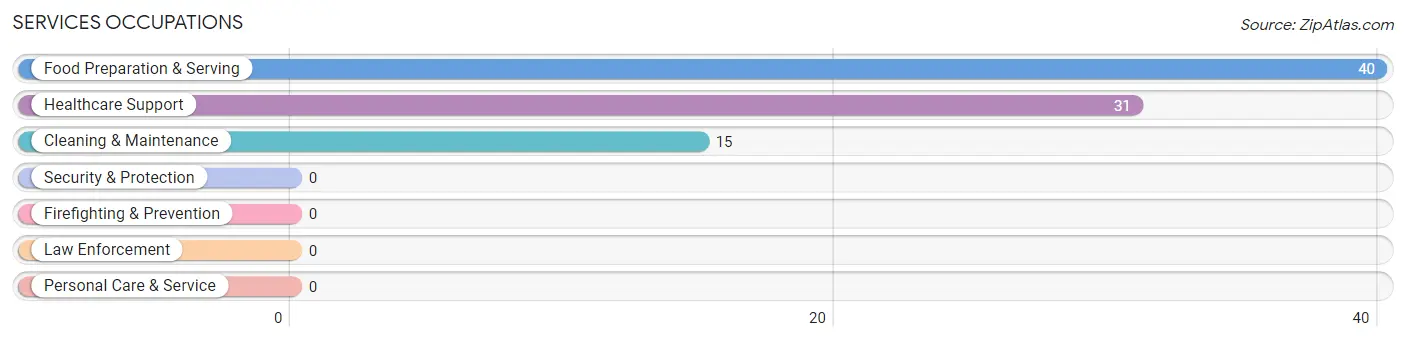
Services Occupations
The most common Services occupations in Attica are Food Preparation & Serving (40 | 7.8%), Healthcare Support (31 | 6.1%), and Cleaning & Maintenance (15 | 2.9%).
Services Occupations by Sex
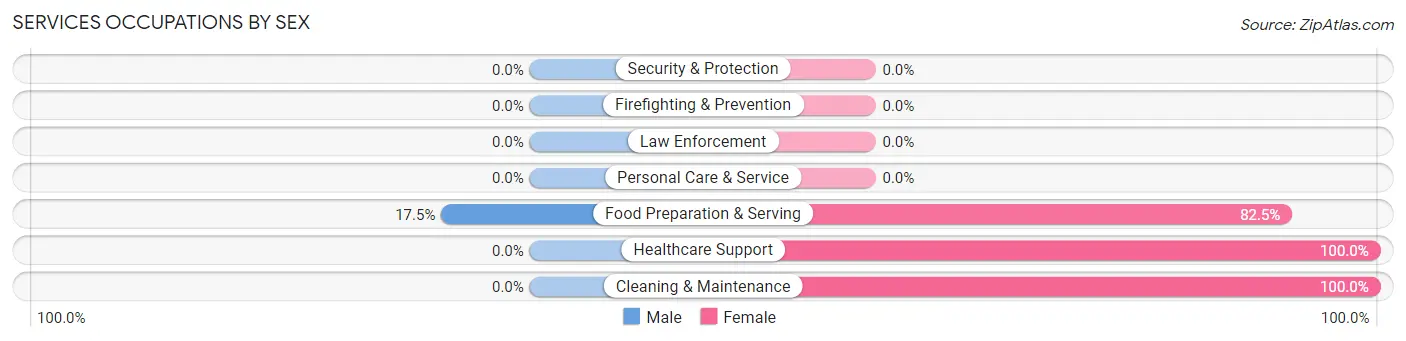
| Occupation | Male | Female |
| Healthcare Support | 0 (0.0%) | 31 (100.0%) |
| Security & Protection | 0 (0.0%) | 0 (0.0%) |
| Firefighting & Prevention | 0 (0.0%) | 0 (0.0%) |
| Law Enforcement | 0 (0.0%) | 0 (0.0%) |
| Food Preparation & Serving | 7 (17.5%) | 33 (82.5%) |
| Cleaning & Maintenance | 0 (0.0%) | 15 (100.0%) |
| Personal Care & Service | 0 (0.0%) | 0 (0.0%) |
| Total (Category) | 7 (8.1%) | 79 (91.9%) |
| Total (Overall) | 263 (51.6%) | 247 (48.4%) |
Sales and Office Occupations
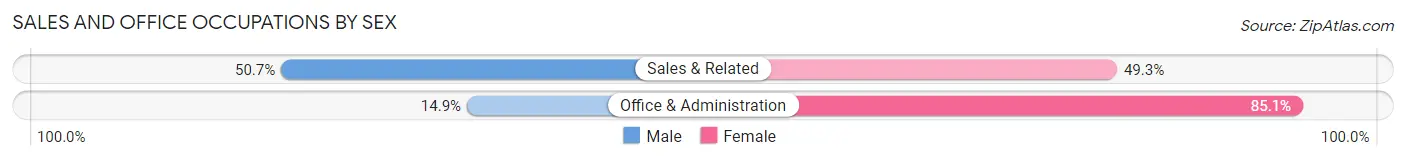
The most common Sales and Office occupations in Attica are Office & Administration (87 | 17.1%), and Sales & Related (73 | 14.3%).
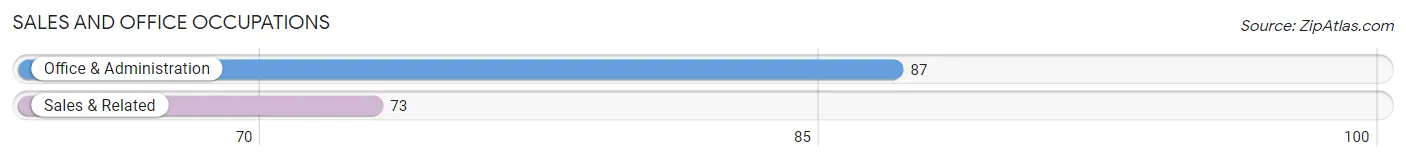
Sales and Office Occupations by Sex
| Occupation | Male | Female |
| Sales & Related | 37 (50.7%) | 36 (49.3%) |
| Office & Administration | 13 (14.9%) | 74 (85.1%) |
| Total (Category) | 50 (31.2%) | 110 (68.8%) |
| Total (Overall) | 263 (51.6%) | 247 (48.4%) |
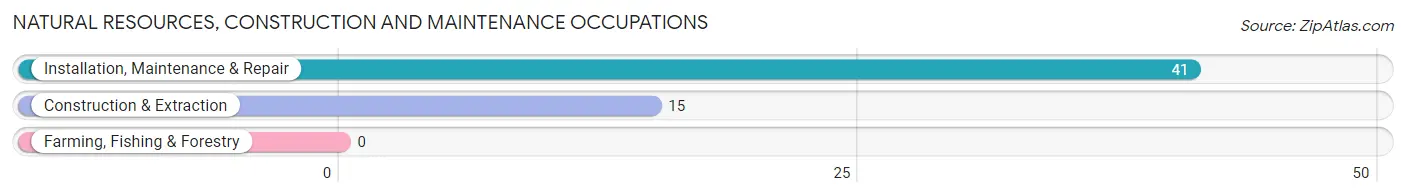
Natural Resources, Construction and Maintenance Occupations
The most common Natural Resources, Construction and Maintenance occupations in Attica are Installation, Maintenance & Repair (41 | 8.0%), and Construction & Extraction (15 | 2.9%).
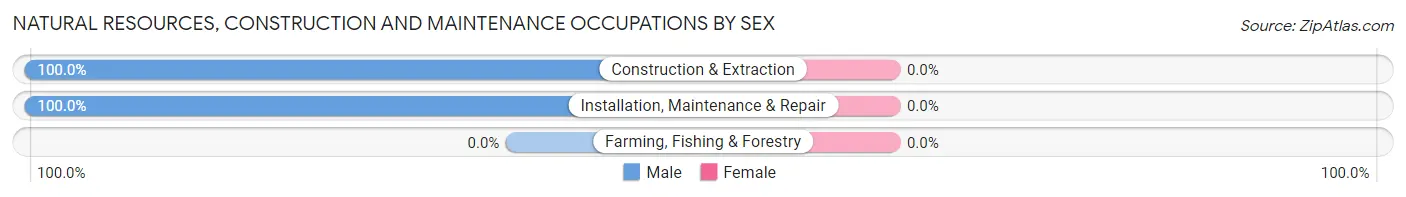
Natural Resources, Construction and Maintenance Occupations by Sex
| Occupation | Male | Female |
| Farming, Fishing & Forestry | 0 (0.0%) | 0 (0.0%) |
| Construction & Extraction | 15 (100.0%) | 0 (0.0%) |
| Installation, Maintenance & Repair | 41 (100.0%) | 0 (0.0%) |
| Total (Category) | 56 (100.0%) | 0 (0.0%) |
| Total (Overall) | 263 (51.6%) | 247 (48.4%) |
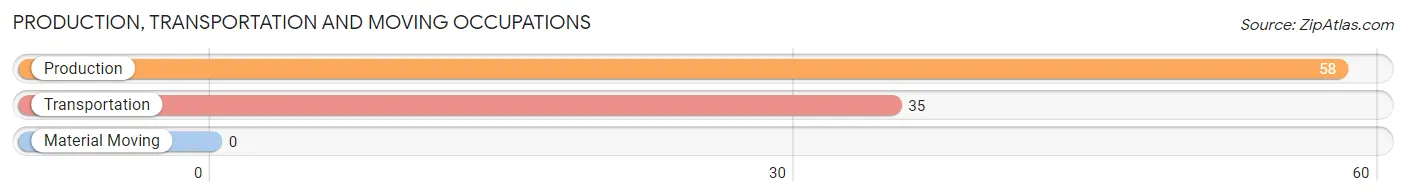
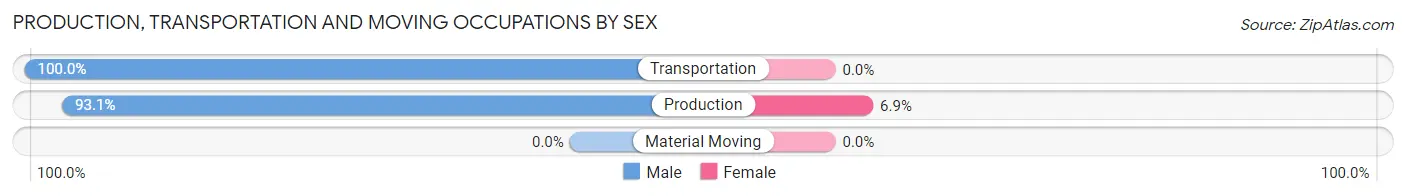
Production, Transportation and Moving Occupations
The most common Production, Transportation and Moving occupations in Attica are Production (58 | 11.4%), and Transportation (35 | 6.9%).
Production, Transportation and Moving Occupations by Sex
| Occupation | Male | Female |
| Production | 54 (93.1%) | 4 (6.9%) |
| Transportation | 35 (100.0%) | 0 (0.0%) |
| Material Moving | 0 (0.0%) | 0 (0.0%) |
| Total (Category) | 89 (95.7%) | 4 (4.3%) |
| Total (Overall) | 263 (51.6%) | 247 (48.4%) |
Employment Industries by Sex in Attica
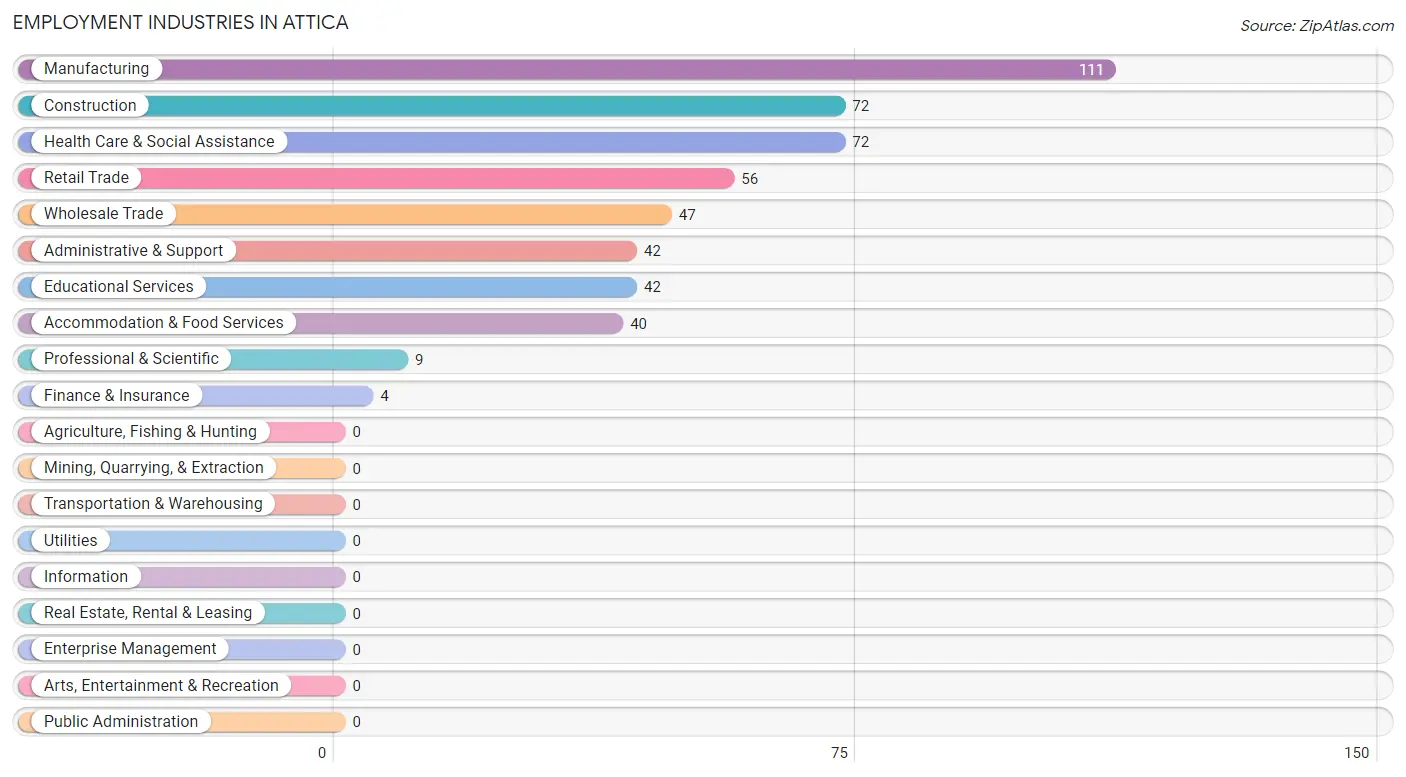
Employment Industries in Attica
The major employment industries in Attica include Manufacturing (111 | 21.8%), Construction (72 | 14.1%), Health Care & Social Assistance (72 | 14.1%), Retail Trade (56 | 11.0%), and Wholesale Trade (47 | 9.2%).
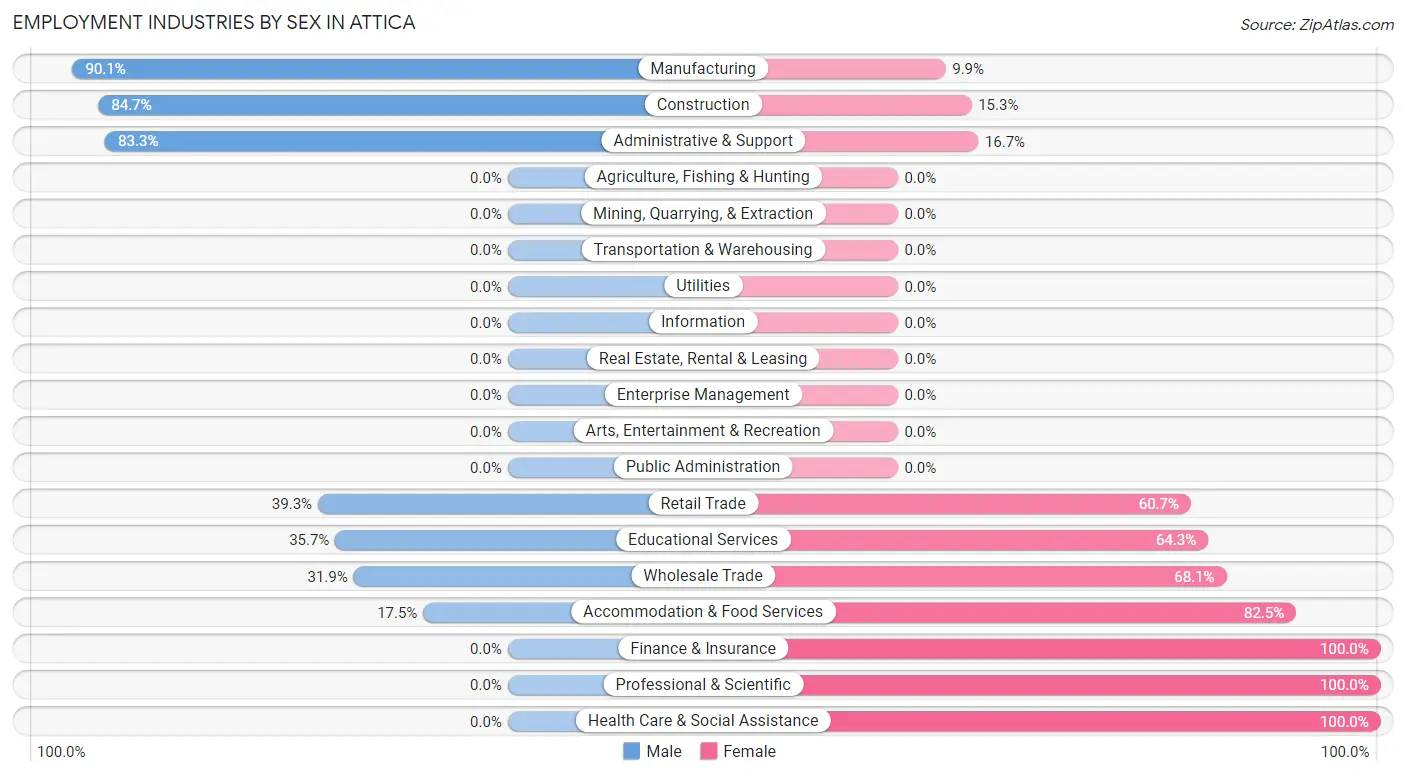
Employment Industries by Sex in Attica
The Attica industries that see more men than women are Manufacturing (90.1%), Construction (84.7%), and Administrative & Support (83.3%), whereas the industries that tend to have a higher number of women are Finance & Insurance (100.0%), Professional & Scientific (100.0%), and Health Care & Social Assistance (100.0%).
| Industry | Male | Female |
| Agriculture, Fishing & Hunting | 0 (0.0%) | 0 (0.0%) |
| Mining, Quarrying, & Extraction | 0 (0.0%) | 0 (0.0%) |
| Construction | 61 (84.7%) | 11 (15.3%) |
| Manufacturing | 100 (90.1%) | 11 (9.9%) |
| Wholesale Trade | 15 (31.9%) | 32 (68.1%) |
| Retail Trade | 22 (39.3%) | 34 (60.7%) |
| Transportation & Warehousing | 0 (0.0%) | 0 (0.0%) |
| Utilities | 0 (0.0%) | 0 (0.0%) |
| Information | 0 (0.0%) | 0 (0.0%) |
| Finance & Insurance | 0 (0.0%) | 4 (100.0%) |
| Real Estate, Rental & Leasing | 0 (0.0%) | 0 (0.0%) |
| Professional & Scientific | 0 (0.0%) | 9 (100.0%) |
| Enterprise Management | 0 (0.0%) | 0 (0.0%) |
| Administrative & Support | 35 (83.3%) | 7 (16.7%) |
| Educational Services | 15 (35.7%) | 27 (64.3%) |
| Health Care & Social Assistance | 0 (0.0%) | 72 (100.0%) |
| Arts, Entertainment & Recreation | 0 (0.0%) | 0 (0.0%) |
| Accommodation & Food Services | 7 (17.5%) | 33 (82.5%) |
| Public Administration | 0 (0.0%) | 0 (0.0%) |
| Total | 263 (51.6%) | 247 (48.4%) |
Education in Attica
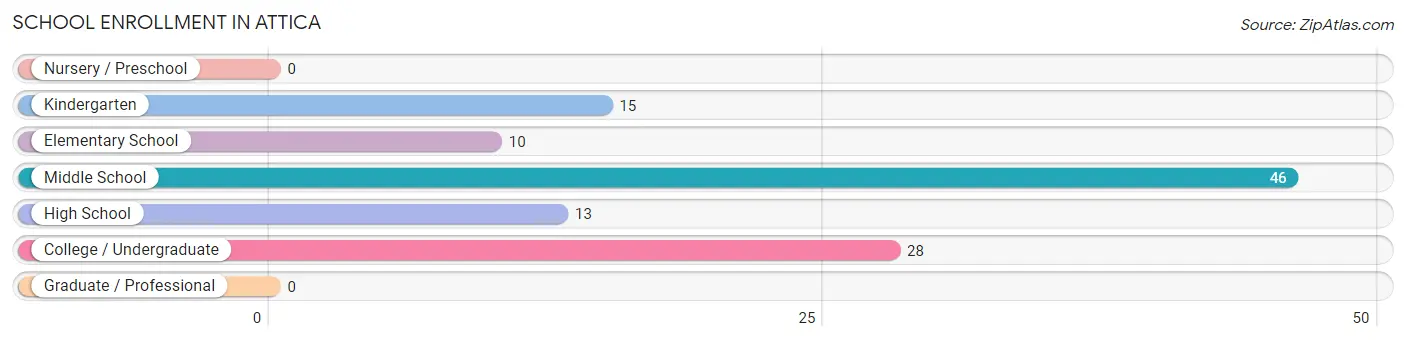
School Enrollment in Attica
The most common levels of schooling among the 112 students in Attica are middle school (46 | 41.1%), college / undergraduate (28 | 25.0%), and kindergarten (15 | 13.4%).
| School Level | # Students | % Students |
| Nursery / Preschool | 0 | 0.0% |
| Kindergarten | 15 | 13.4% |
| Elementary School | 10 | 8.9% |
| Middle School | 46 | 41.1% |
| High School | 13 | 11.6% |
| College / Undergraduate | 28 | 25.0% |
| Graduate / Professional | 0 | 0.0% |
| Total | 112 | 100.0% |
School Enrollment by Age by Funding Source in Attica
Out of a total of 112 students who are enrolled in schools in Attica, 13 (11.6%) attend a private institution, while the remaining 99 (88.4%) are enrolled in public schools. The age group of 15 to 17 year olds has the highest likelihood of being enrolled in private schools, with 7 (53.8% in the age bracket) enrolled. Conversely, the age group of 5 to 9 year old has the lowest likelihood of being enrolled in a private school, with 25 (100.0% in the age bracket) attending a public institution.
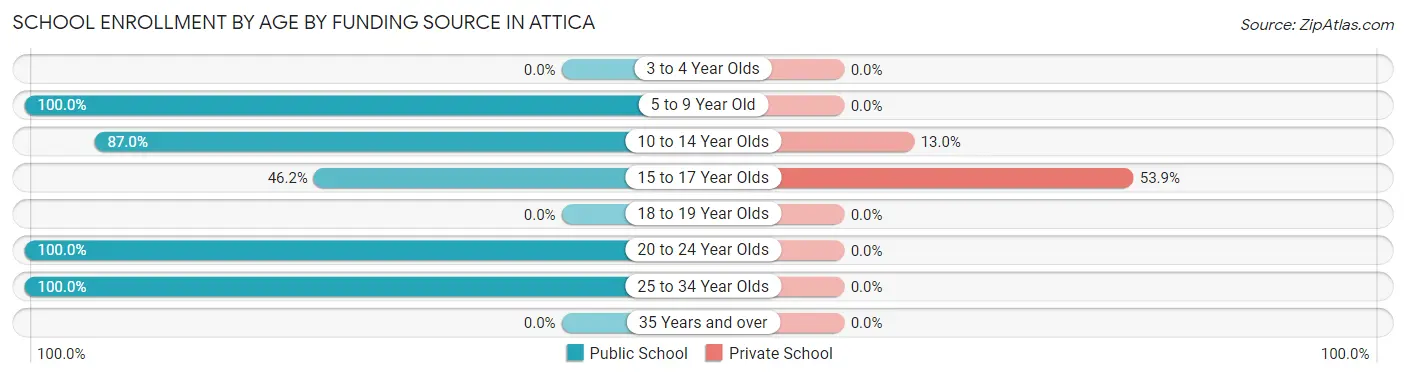
| Age Bracket | Public School | Private School |
| 3 to 4 Year Olds | 0 (0.0%) | 0 (0.0%) |
| 5 to 9 Year Old | 25 (100.0%) | 0 (0.0%) |
| 10 to 14 Year Olds | 40 (87.0%) | 6 (13.0%) |
| 15 to 17 Year Olds | 6 (46.2%) | 7 (53.8%) |
| 18 to 19 Year Olds | 0 (0.0%) | 0 (0.0%) |
| 20 to 24 Year Olds | 24 (100.0%) | 0 (0.0%) |
| 25 to 34 Year Olds | 4 (100.0%) | 0 (0.0%) |
| 35 Years and over | 0 (0.0%) | 0 (0.0%) |
| Total | 99 (88.4%) | 13 (11.6%) |
Educational Attainment by Field of Study in Attica
Education (45 | 40.5%), engineering (28 | 25.2%), science & technology (23 | 20.7%), and computers & mathematics (15 | 13.5%) are the most common fields of study among 111 individuals in Attica who have obtained a bachelor's degree or higher.
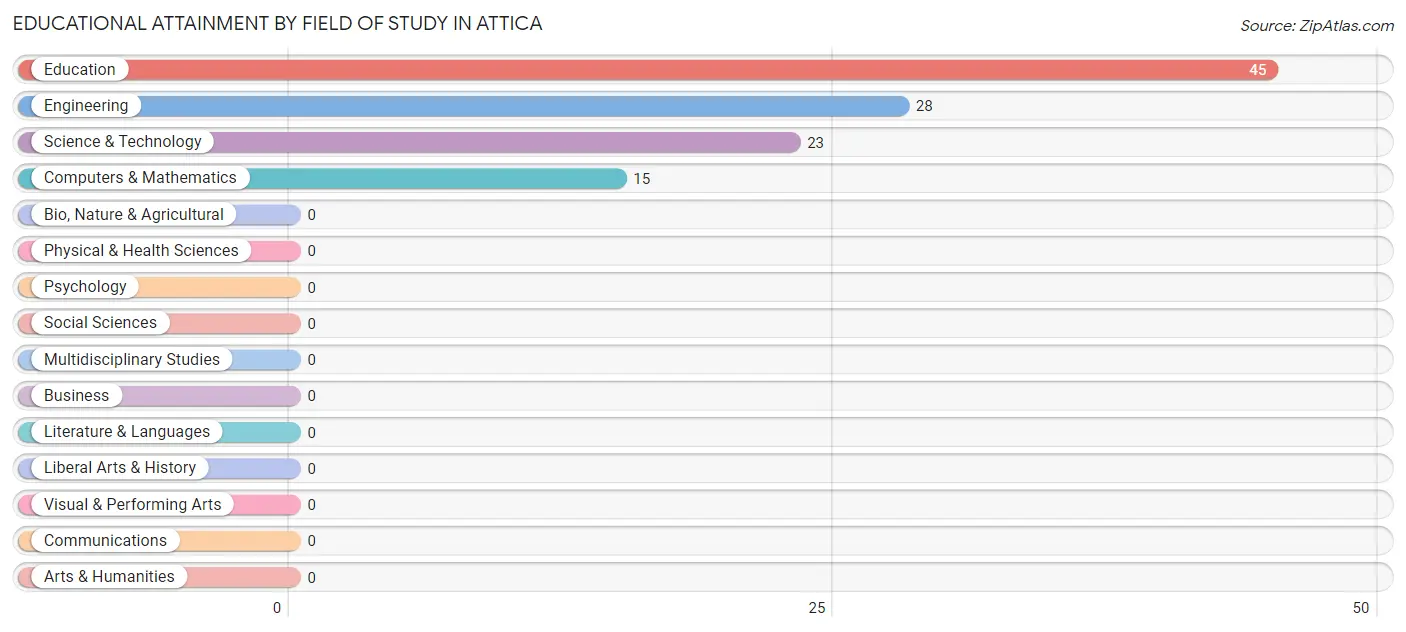
| Field of Study | # Graduates | % Graduates |
| Computers & Mathematics | 15 | 13.5% |
| Bio, Nature & Agricultural | 0 | 0.0% |
| Physical & Health Sciences | 0 | 0.0% |
| Psychology | 0 | 0.0% |
| Social Sciences | 0 | 0.0% |
| Engineering | 28 | 25.2% |
| Multidisciplinary Studies | 0 | 0.0% |
| Science & Technology | 23 | 20.7% |
| Business | 0 | 0.0% |
| Education | 45 | 40.5% |
| Literature & Languages | 0 | 0.0% |
| Liberal Arts & History | 0 | 0.0% |
| Visual & Performing Arts | 0 | 0.0% |
| Communications | 0 | 0.0% |
| Arts & Humanities | 0 | 0.0% |
| Total | 111 | 100.0% |
Transportation & Commute in Attica
Vehicle Availability by Sex in Attica
The most prevalent vehicle ownership categories in Attica are males with 3 vehicles (85, accounting for 32.3%) and females with 3 vehicles (63, making up 34.4%).
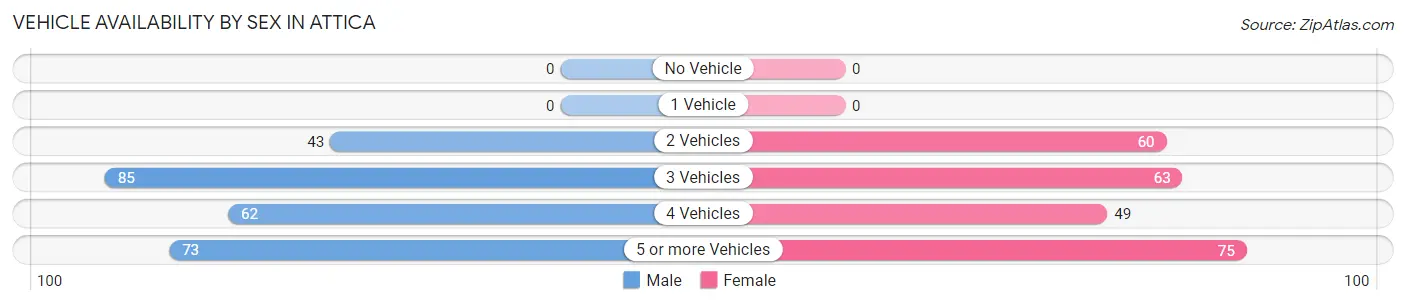
| Vehicles Available | Male | Female |
| No Vehicle | 0 (0.0%) | 0 (0.0%) |
| 1 Vehicle | 0 (0.0%) | 0 (0.0%) |
| 2 Vehicles | 43 (16.4%) | 60 (24.3%) |
| 3 Vehicles | 85 (32.3%) | 63 (25.5%) |
| 4 Vehicles | 62 (23.6%) | 49 (19.8%) |
| 5 or more Vehicles | 73 (27.8%) | 75 (30.4%) |
| Total | 263 (100.0%) | 247 (100.0%) |
Commute Time in Attica
The most frequently occuring commute durations in Attica are 60 to 89 minutes (119 commuters, 25.4%), 30 to 34 minutes (115 commuters, 24.6%), and 10 to 14 minutes (100 commuters, 21.4%).
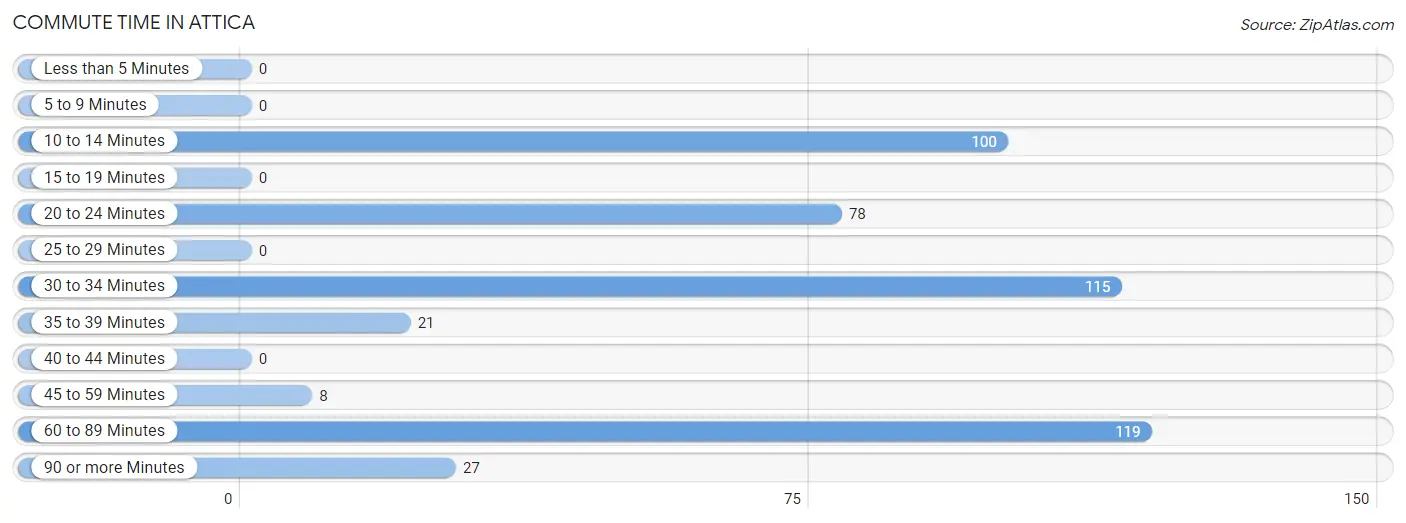
| Commute Time | # Commuters | % Commuters |
| Less than 5 Minutes | 0 | 0.0% |
| 5 to 9 Minutes | 0 | 0.0% |
| 10 to 14 Minutes | 100 | 21.4% |
| 15 to 19 Minutes | 0 | 0.0% |
| 20 to 24 Minutes | 78 | 16.7% |
| 25 to 29 Minutes | 0 | 0.0% |
| 30 to 34 Minutes | 115 | 24.6% |
| 35 to 39 Minutes | 21 | 4.5% |
| 40 to 44 Minutes | 0 | 0.0% |
| 45 to 59 Minutes | 8 | 1.7% |
| 60 to 89 Minutes | 119 | 25.4% |
| 90 or more Minutes | 27 | 5.8% |
Commute Time by Sex in Attica
The most common commute times in Attica are 30 to 34 minutes (97 commuters, 40.9%) for males and 10 to 14 minutes (69 commuters, 29.9%) for females.
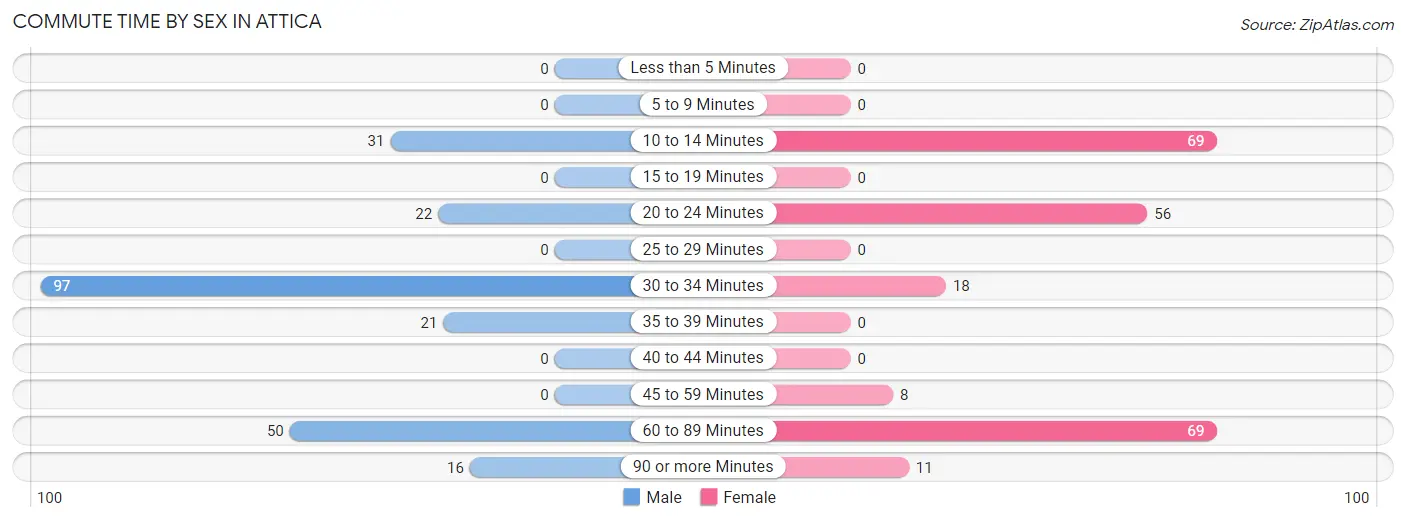
| Commute Time | Male | Female |
| Less than 5 Minutes | 0 (0.0%) | 0 (0.0%) |
| 5 to 9 Minutes | 0 (0.0%) | 0 (0.0%) |
| 10 to 14 Minutes | 31 (13.1%) | 69 (29.9%) |
| 15 to 19 Minutes | 0 (0.0%) | 0 (0.0%) |
| 20 to 24 Minutes | 22 (9.3%) | 56 (24.2%) |
| 25 to 29 Minutes | 0 (0.0%) | 0 (0.0%) |
| 30 to 34 Minutes | 97 (40.9%) | 18 (7.8%) |
| 35 to 39 Minutes | 21 (8.9%) | 0 (0.0%) |
| 40 to 44 Minutes | 0 (0.0%) | 0 (0.0%) |
| 45 to 59 Minutes | 0 (0.0%) | 8 (3.5%) |
| 60 to 89 Minutes | 50 (21.1%) | 69 (29.9%) |
| 90 or more Minutes | 16 (6.8%) | 11 (4.8%) |
Time of Departure to Work by Sex in Attica
The most frequent times of departure to work in Attica are 5:30 AM to 5:59 AM (66, 27.9%) for males and 5:30 AM to 5:59 AM (44, 19.1%) for females.
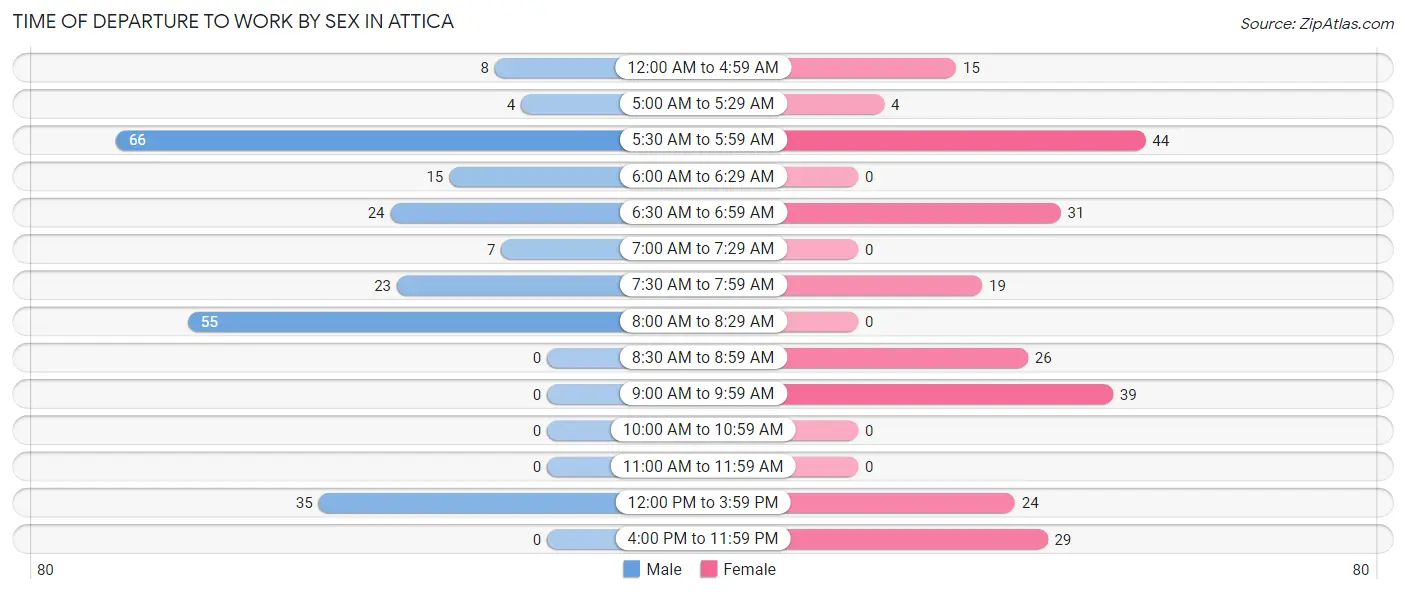
| Time of Departure | Male | Female |
| 12:00 AM to 4:59 AM | 8 (3.4%) | 15 (6.5%) |
| 5:00 AM to 5:29 AM | 4 (1.7%) | 4 (1.7%) |
| 5:30 AM to 5:59 AM | 66 (27.9%) | 44 (19.1%) |
| 6:00 AM to 6:29 AM | 15 (6.3%) | 0 (0.0%) |
| 6:30 AM to 6:59 AM | 24 (10.1%) | 31 (13.4%) |
| 7:00 AM to 7:29 AM | 7 (2.9%) | 0 (0.0%) |
| 7:30 AM to 7:59 AM | 23 (9.7%) | 19 (8.2%) |
| 8:00 AM to 8:29 AM | 55 (23.2%) | 0 (0.0%) |
| 8:30 AM to 8:59 AM | 0 (0.0%) | 26 (11.3%) |
| 9:00 AM to 9:59 AM | 0 (0.0%) | 39 (16.9%) |
| 10:00 AM to 10:59 AM | 0 (0.0%) | 0 (0.0%) |
| 11:00 AM to 11:59 AM | 0 (0.0%) | 0 (0.0%) |
| 12:00 PM to 3:59 PM | 35 (14.8%) | 24 (10.4%) |
| 4:00 PM to 11:59 PM | 0 (0.0%) | 29 (12.6%) |
| Total | 237 (100.0%) | 231 (100.0%) |
Housing Occupancy in Attica
Occupancy by Ownership in Attica
Of the total 420 dwellings in Attica, owner-occupied units account for 401 (95.5%), while renter-occupied units make up 19 (4.5%).
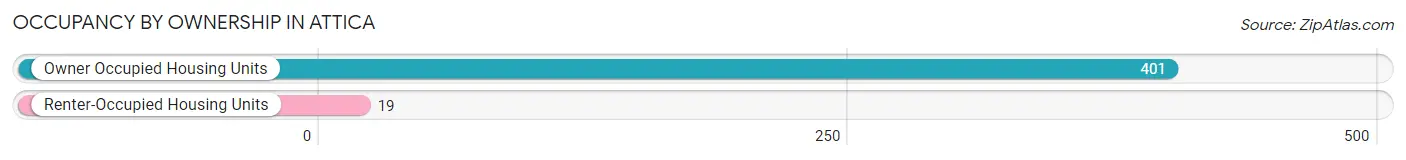
| Occupancy | # Housing Units | % Housing Units |
| Owner Occupied Housing Units | 401 | 95.5% |
| Renter-Occupied Housing Units | 19 | 4.5% |
| Total Occupied Housing Units | 420 | 100.0% |
Occupancy by Household Size in Attica
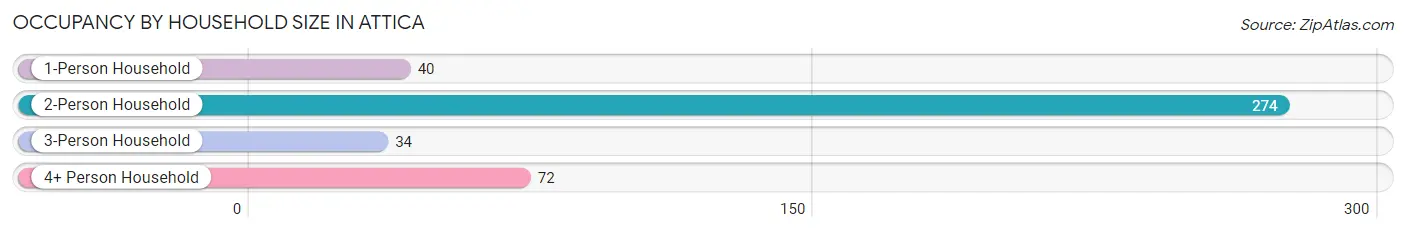
| Household Size | # Housing Units | % Housing Units |
| 1-Person Household | 40 | 9.5% |
| 2-Person Household | 274 | 65.2% |
| 3-Person Household | 34 | 8.1% |
| 4+ Person Household | 72 | 17.1% |
| Total Housing Units | 420 | 100.0% |
Occupancy by Ownership by Household Size in Attica
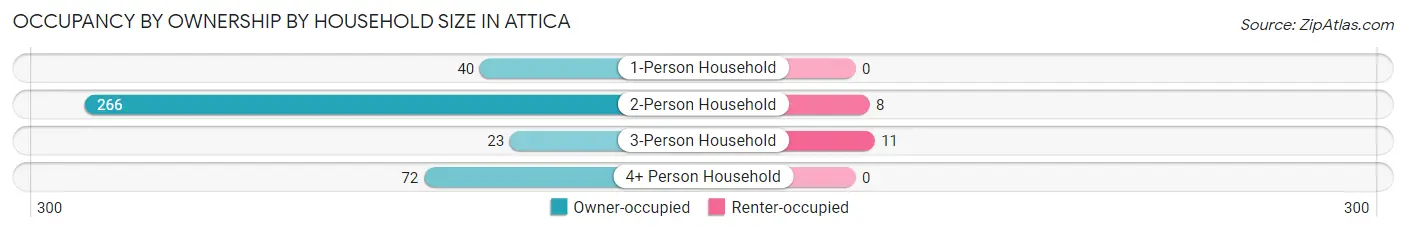
| Household Size | Owner-occupied | Renter-occupied |
| 1-Person Household | 40 (100.0%) | 0 (0.0%) |
| 2-Person Household | 266 (97.1%) | 8 (2.9%) |
| 3-Person Household | 23 (67.6%) | 11 (32.4%) |
| 4+ Person Household | 72 (100.0%) | 0 (0.0%) |
| Total Housing Units | 401 (95.5%) | 19 (4.5%) |
Occupancy by Educational Attainment in Attica
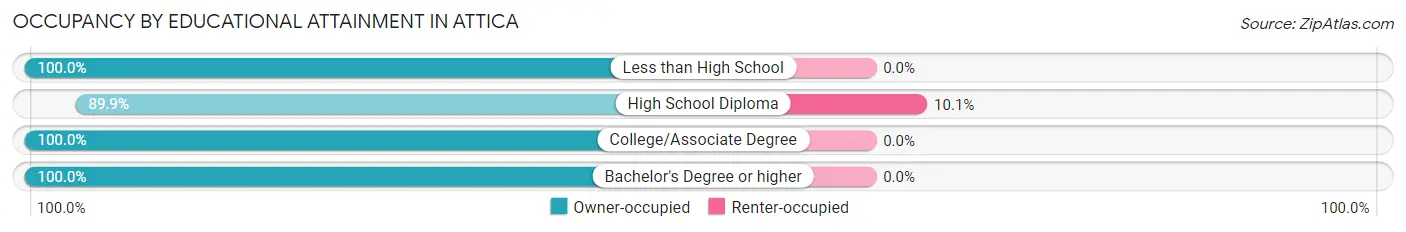
| Household Size | Owner-occupied | Renter-occupied |
| Less than High School | 38 (100.0%) | 0 (0.0%) |
| High School Diploma | 169 (89.9%) | 19 (10.1%) |
| College/Associate Degree | 151 (100.0%) | 0 (0.0%) |
| Bachelor's Degree or higher | 43 (100.0%) | 0 (0.0%) |
Occupancy by Age of Householder in Attica
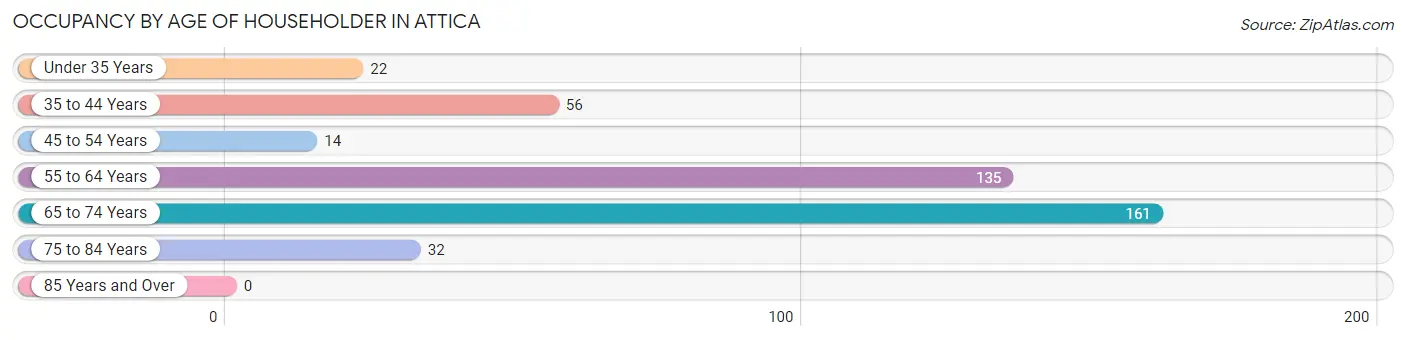
| Age Bracket | # Households | % Households |
| Under 35 Years | 22 | 5.2% |
| 35 to 44 Years | 56 | 13.3% |
| 45 to 54 Years | 14 | 3.3% |
| 55 to 64 Years | 135 | 32.1% |
| 65 to 74 Years | 161 | 38.3% |
| 75 to 84 Years | 32 | 7.6% |
| 85 Years and Over | 0 | 0.0% |
| Total | 420 | 100.0% |
Housing Finances in Attica
Median Income by Occupancy in Attica
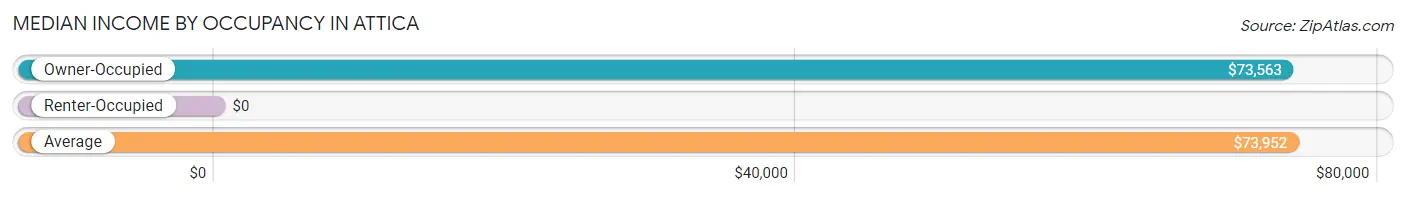
| Occupancy Type | # Households | Median Income |
| Owner-Occupied | 401 (95.5%) | $73,563 |
| Renter-Occupied | 19 (4.5%) | $0 |
| Average | 420 (100.0%) | $73,952 |
Occupancy by Householder Income Bracket in Attica
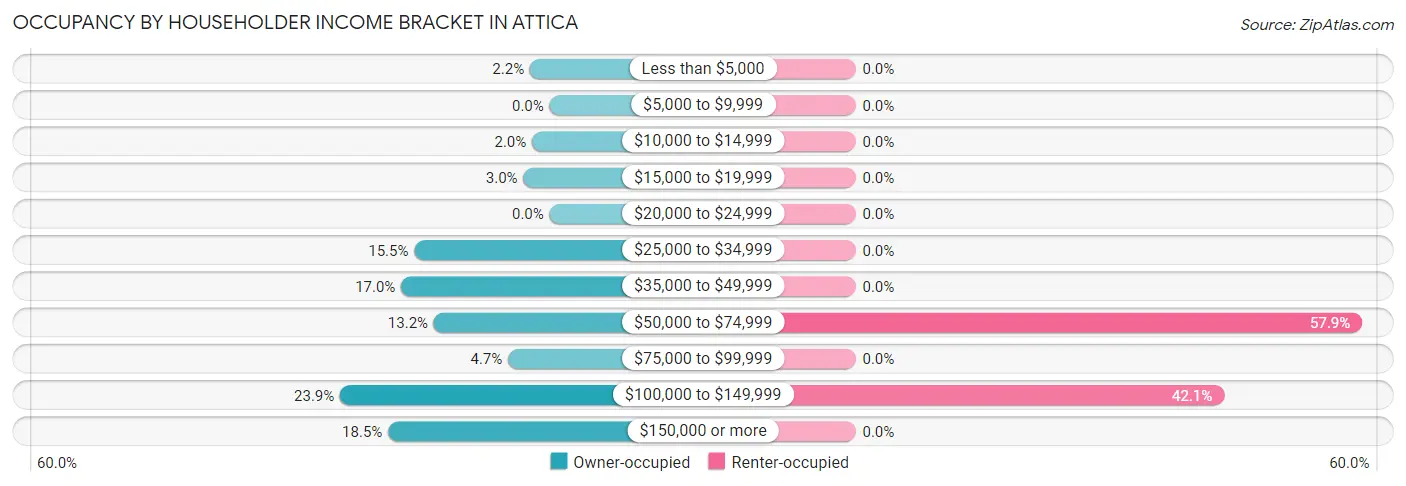
| Income Bracket | Owner-occupied | Renter-occupied |
| Less than $5,000 | 9 (2.2%) | 0 (0.0%) |
| $5,000 to $9,999 | 0 (0.0%) | 0 (0.0%) |
| $10,000 to $14,999 | 8 (2.0%) | 0 (0.0%) |
| $15,000 to $19,999 | 12 (3.0%) | 0 (0.0%) |
| $20,000 to $24,999 | 0 (0.0%) | 0 (0.0%) |
| $25,000 to $34,999 | 62 (15.5%) | 0 (0.0%) |
| $35,000 to $49,999 | 68 (17.0%) | 0 (0.0%) |
| $50,000 to $74,999 | 53 (13.2%) | 11 (57.9%) |
| $75,000 to $99,999 | 19 (4.7%) | 0 (0.0%) |
| $100,000 to $149,999 | 96 (23.9%) | 8 (42.1%) |
| $150,000 or more | 74 (18.4%) | 0 (0.0%) |
| Total | 401 (100.0%) | 19 (100.0%) |
Monthly Housing Cost Tiers in Attica
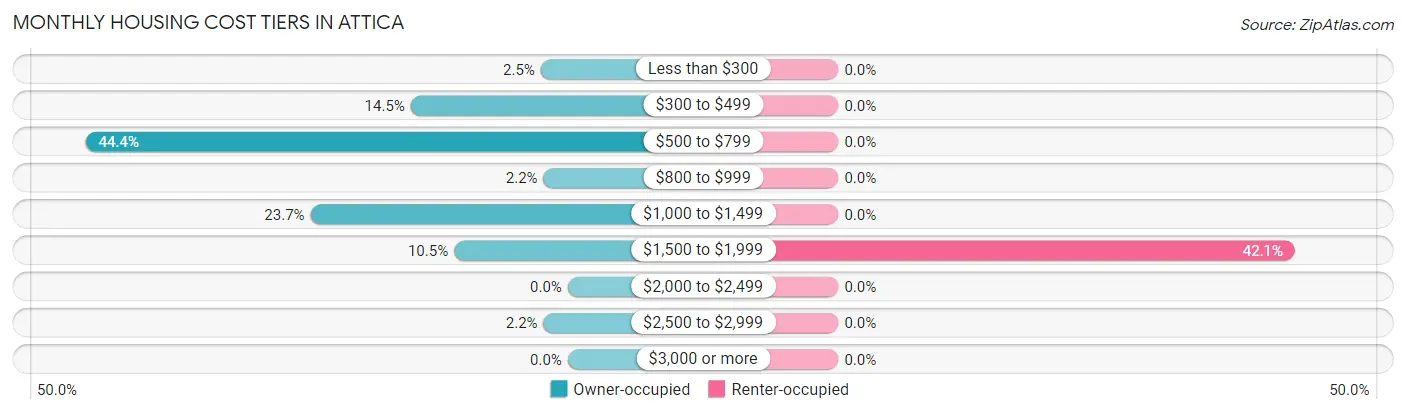
| Monthly Cost | Owner-occupied | Renter-occupied |
| Less than $300 | 10 (2.5%) | 0 (0.0%) |
| $300 to $499 | 58 (14.5%) | 0 (0.0%) |
| $500 to $799 | 178 (44.4%) | 0 (0.0%) |
| $800 to $999 | 9 (2.2%) | 0 (0.0%) |
| $1,000 to $1,499 | 95 (23.7%) | 0 (0.0%) |
| $1,500 to $1,999 | 42 (10.5%) | 8 (42.1%) |
| $2,000 to $2,499 | 0 (0.0%) | 0 (0.0%) |
| $2,500 to $2,999 | 9 (2.2%) | 0 (0.0%) |
| $3,000 or more | 0 (0.0%) | 0 (0.0%) |
| Total | 401 (100.0%) | 19 (100.0%) |
Physical Housing Characteristics in Attica
Housing Structures in Attica
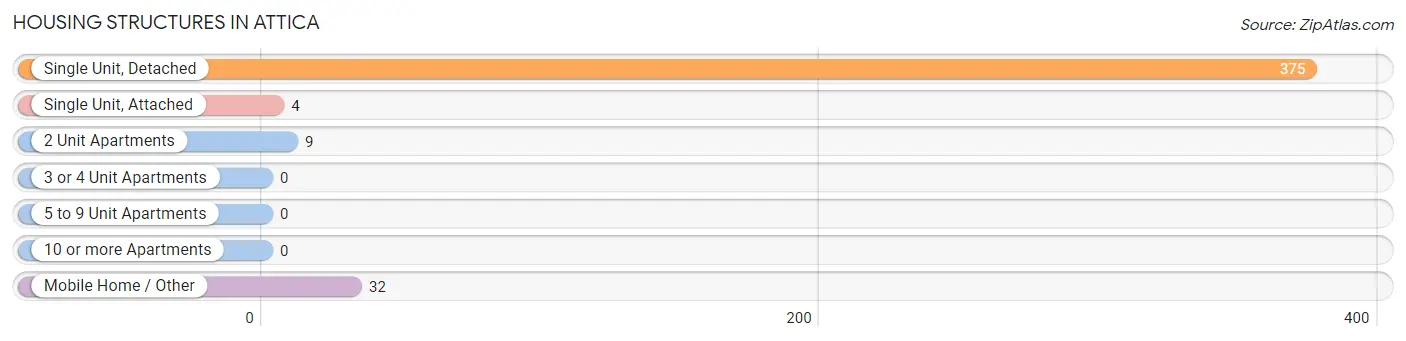
| Structure Type | # Housing Units | % Housing Units |
| Single Unit, Detached | 375 | 89.3% |
| Single Unit, Attached | 4 | 0.9% |
| 2 Unit Apartments | 9 | 2.1% |
| 3 or 4 Unit Apartments | 0 | 0.0% |
| 5 to 9 Unit Apartments | 0 | 0.0% |
| 10 or more Apartments | 0 | 0.0% |
| Mobile Home / Other | 32 | 7.6% |
| Total | 420 | 100.0% |
Housing Structures by Occupancy in Attica
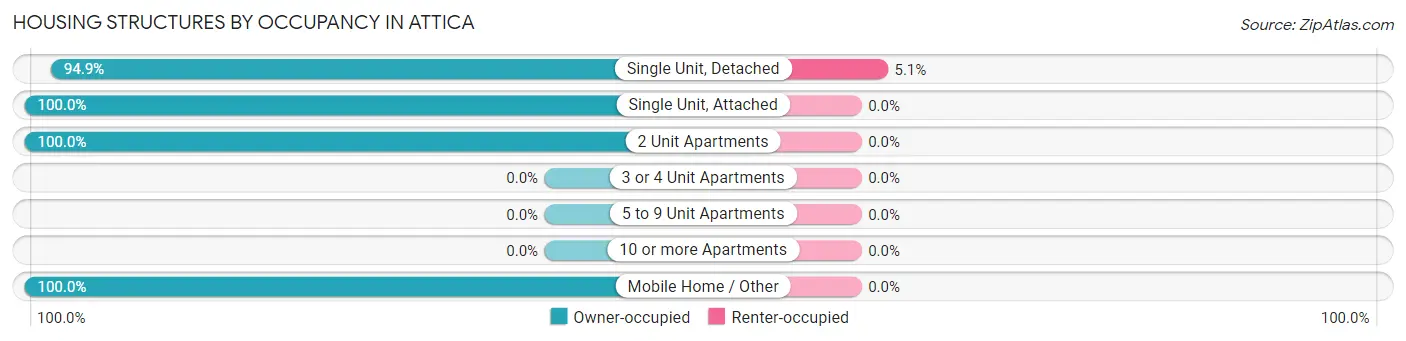
| Structure Type | Owner-occupied | Renter-occupied |
| Single Unit, Detached | 356 (94.9%) | 19 (5.1%) |
| Single Unit, Attached | 4 (100.0%) | 0 (0.0%) |
| 2 Unit Apartments | 9 (100.0%) | 0 (0.0%) |
| 3 or 4 Unit Apartments | 0 (0.0%) | 0 (0.0%) |
| 5 to 9 Unit Apartments | 0 (0.0%) | 0 (0.0%) |
| 10 or more Apartments | 0 (0.0%) | 0 (0.0%) |
| Mobile Home / Other | 32 (100.0%) | 0 (0.0%) |
| Total | 401 (95.5%) | 19 (4.5%) |
Housing Structures by Number of Rooms in Attica
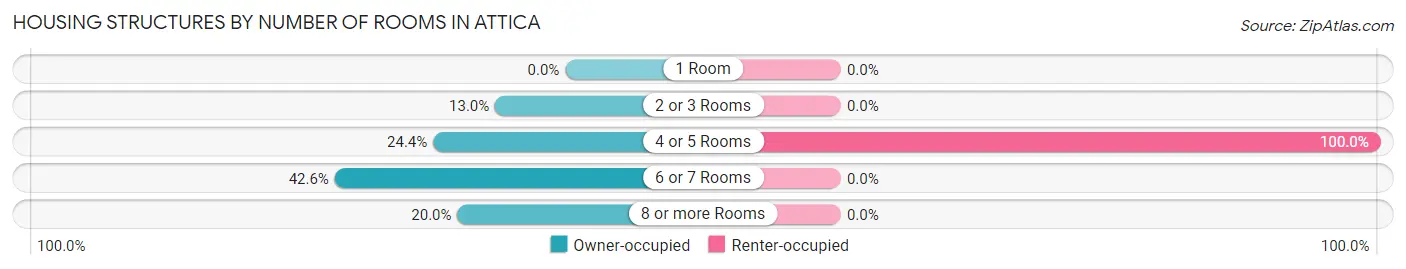
| Number of Rooms | Owner-occupied | Renter-occupied |
| 1 Room | 0 (0.0%) | 0 (0.0%) |
| 2 or 3 Rooms | 52 (13.0%) | 0 (0.0%) |
| 4 or 5 Rooms | 98 (24.4%) | 19 (100.0%) |
| 6 or 7 Rooms | 171 (42.6%) | 0 (0.0%) |
| 8 or more Rooms | 80 (20.0%) | 0 (0.0%) |
| Total | 401 (100.0%) | 19 (100.0%) |
Housing Structure by Heating Type in Attica
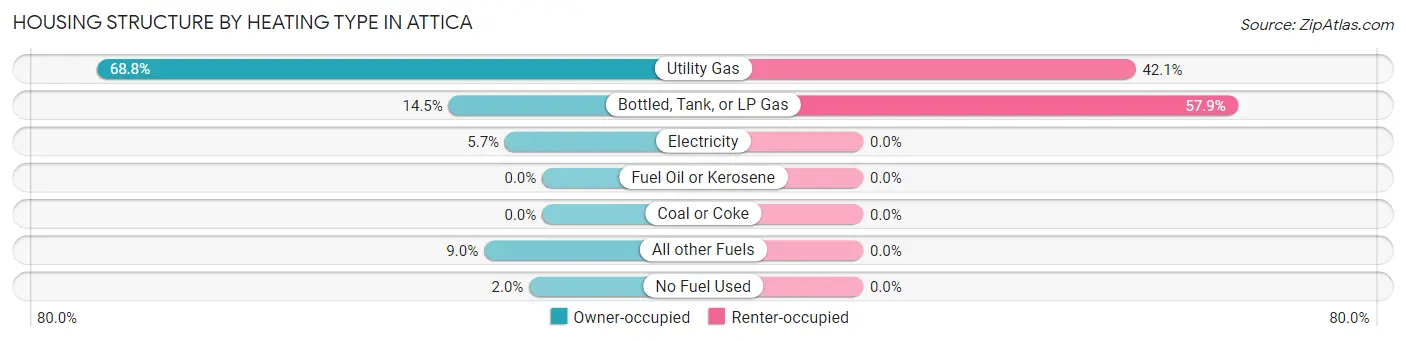
| Heating Type | Owner-occupied | Renter-occupied |
| Utility Gas | 276 (68.8%) | 8 (42.1%) |
| Bottled, Tank, or LP Gas | 58 (14.5%) | 11 (57.9%) |
| Electricity | 23 (5.7%) | 0 (0.0%) |
| Fuel Oil or Kerosene | 0 (0.0%) | 0 (0.0%) |
| Coal or Coke | 0 (0.0%) | 0 (0.0%) |
| All other Fuels | 36 (9.0%) | 0 (0.0%) |
| No Fuel Used | 8 (2.0%) | 0 (0.0%) |
| Total | 401 (100.0%) | 19 (100.0%) |
Household Vehicle Usage in Attica
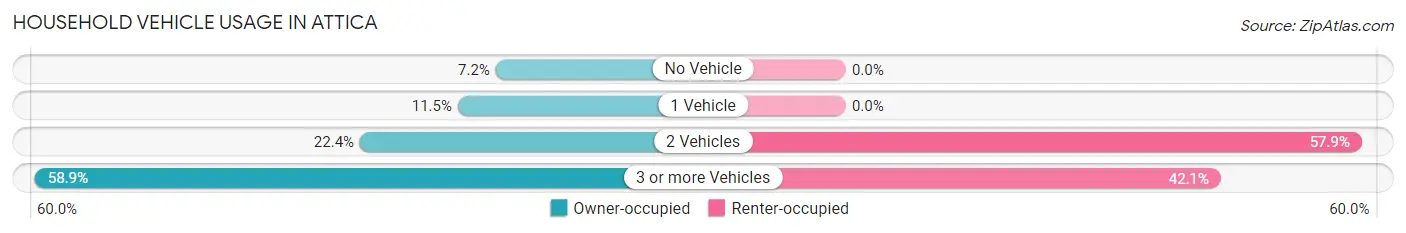
| Vehicles per Household | Owner-occupied | Renter-occupied |
| No Vehicle | 29 (7.2%) | 0 (0.0%) |
| 1 Vehicle | 46 (11.5%) | 0 (0.0%) |
| 2 Vehicles | 90 (22.4%) | 11 (57.9%) |
| 3 or more Vehicles | 236 (58.9%) | 8 (42.1%) |
| Total | 401 (100.0%) | 19 (100.0%) |
Real Estate & Mortgages in Attica
Real Estate and Mortgage Overview in Attica
| Characteristic | Without Mortgage | With Mortgage |
| Housing Units | 217 | 184 |
| Median Property Value | $170,200 | $187,500 |
| Median Household Income | - | - |
| Monthly Housing Costs | $570 | $0 |
| Real Estate Taxes | $1,255 | $0 |
Property Value by Mortgage Status in Attica
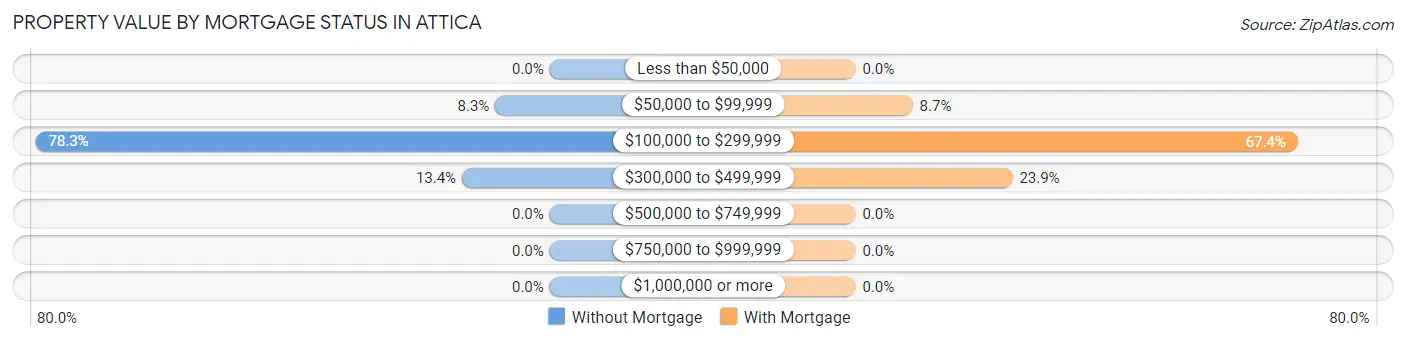
| Property Value | Without Mortgage | With Mortgage |
| Less than $50,000 | 0 (0.0%) | 0 (0.0%) |
| $50,000 to $99,999 | 18 (8.3%) | 16 (8.7%) |
| $100,000 to $299,999 | 170 (78.3%) | 124 (67.4%) |
| $300,000 to $499,999 | 29 (13.4%) | 44 (23.9%) |
| $500,000 to $749,999 | 0 (0.0%) | 0 (0.0%) |
| $750,000 to $999,999 | 0 (0.0%) | 0 (0.0%) |
| $1,000,000 or more | 0 (0.0%) | 0 (0.0%) |
| Total | 217 (100.0%) | 184 (100.0%) |
Household Income by Mortgage Status in Attica
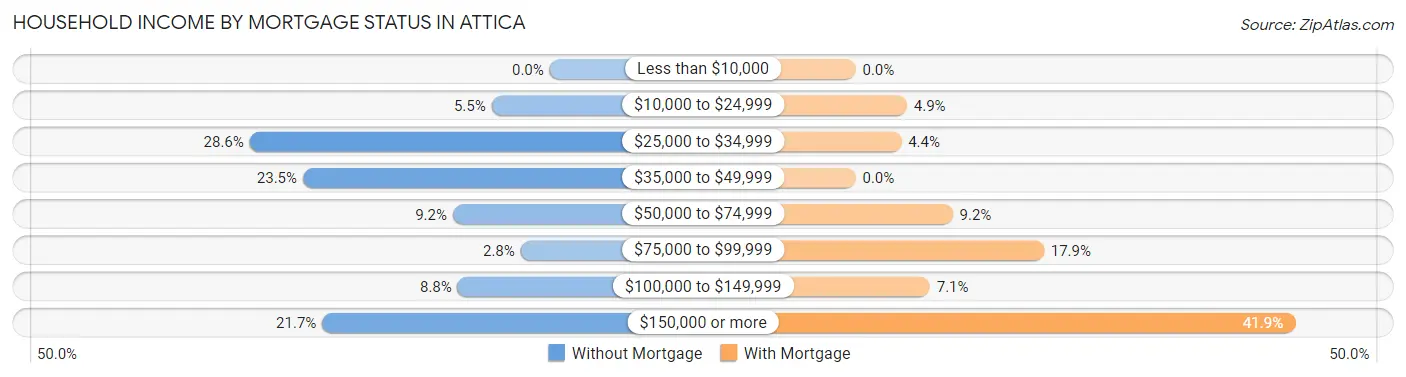
| Household Income | Without Mortgage | With Mortgage |
| Less than $10,000 | 0 (0.0%) | 0 (0.0%) |
| $10,000 to $24,999 | 12 (5.5%) | 9 (4.9%) |
| $25,000 to $34,999 | 62 (28.6%) | 8 (4.3%) |
| $35,000 to $49,999 | 51 (23.5%) | 0 (0.0%) |
| $50,000 to $74,999 | 20 (9.2%) | 17 (9.2%) |
| $75,000 to $99,999 | 6 (2.8%) | 33 (17.9%) |
| $100,000 to $149,999 | 19 (8.8%) | 13 (7.1%) |
| $150,000 or more | 47 (21.7%) | 77 (41.8%) |
| Total | 217 (100.0%) | 184 (100.0%) |
Property Value to Household Income Ratio in Attica
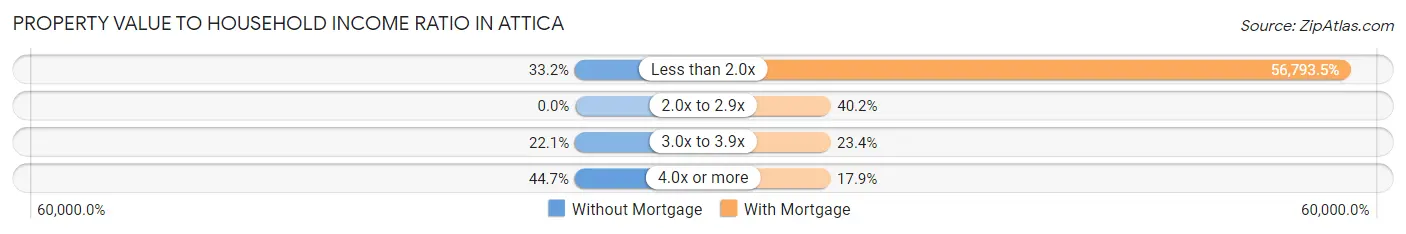
| Value-to-Income Ratio | Without Mortgage | With Mortgage |
| Less than 2.0x | 72 (33.2%) | 104,500 (56,793.5%) |
| 2.0x to 2.9x | 0 (0.0%) | 74 (40.2%) |
| 3.0x to 3.9x | 48 (22.1%) | 43 (23.4%) |
| 4.0x or more | 97 (44.7%) | 33 (17.9%) |
| Total | 217 (100.0%) | 184 (100.0%) |
Real Estate Taxes by Mortgage Status in Attica
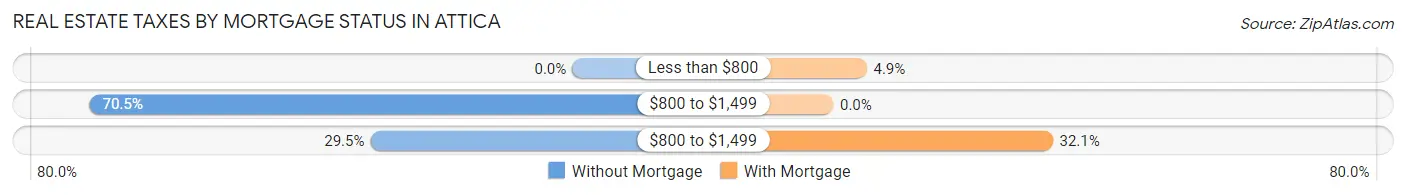
| Property Taxes | Without Mortgage | With Mortgage |
| Less than $800 | 0 (0.0%) | 9 (4.9%) |
| $800 to $1,499 | 153 (70.5%) | 0 (0.0%) |
| $800 to $1,499 | 64 (29.5%) | 59 (32.1%) |
| Total | 217 (100.0%) | 184 (100.0%) |
Health & Disability in Attica
Health Insurance Coverage by Age in Attica
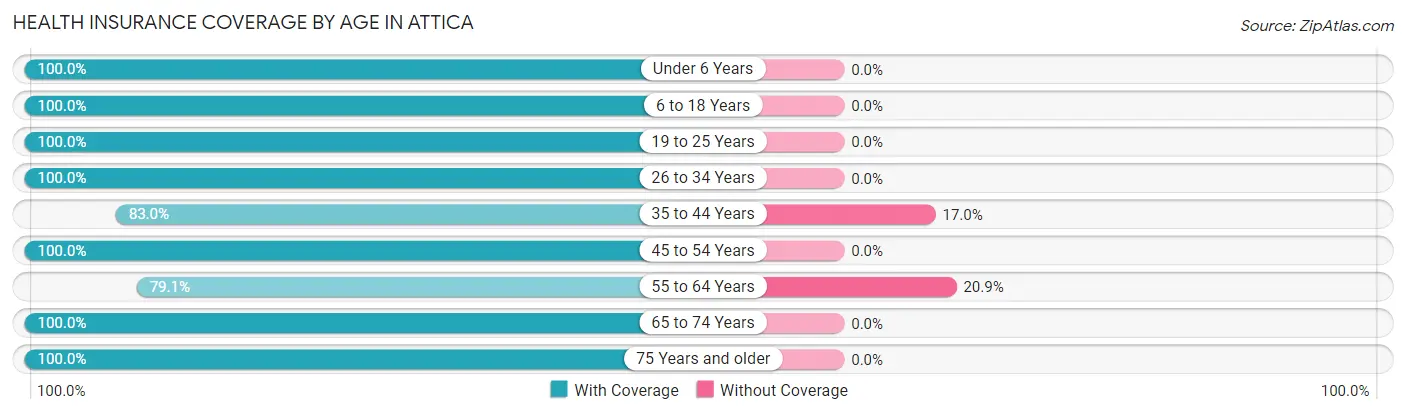
| Age Bracket | With Coverage | Without Coverage |
| Under 6 Years | 9 (100.0%) | 0 (0.0%) |
| 6 to 18 Years | 84 (100.0%) | 0 (0.0%) |
| 19 to 25 Years | 73 (100.0%) | 0 (0.0%) |
| 26 to 34 Years | 64 (100.0%) | 0 (0.0%) |
| 35 to 44 Years | 161 (83.0%) | 33 (17.0%) |
| 45 to 54 Years | 60 (100.0%) | 0 (0.0%) |
| 55 to 64 Years | 121 (79.1%) | 32 (20.9%) |
| 65 to 74 Years | 329 (100.0%) | 0 (0.0%) |
| 75 Years and older | 43 (100.0%) | 0 (0.0%) |
| Total | 944 (93.6%) | 65 (6.4%) |
Health Insurance Coverage by Citizenship Status in Attica
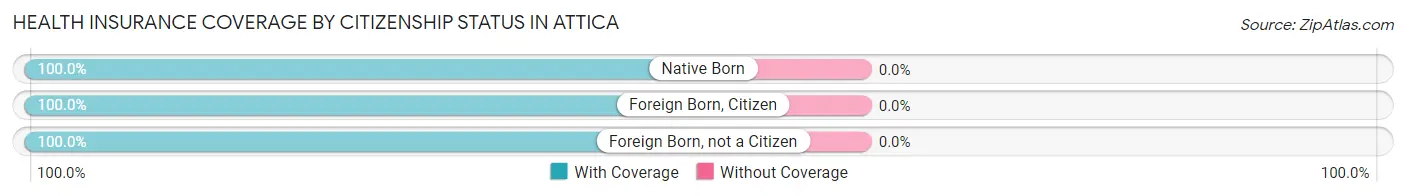
| Citizenship Status | With Coverage | Without Coverage |
| Native Born | 9 (100.0%) | 0 (0.0%) |
| Foreign Born, Citizen | 84 (100.0%) | 0 (0.0%) |
| Foreign Born, not a Citizen | 73 (100.0%) | 0 (0.0%) |
Health Insurance Coverage by Household Income in Attica
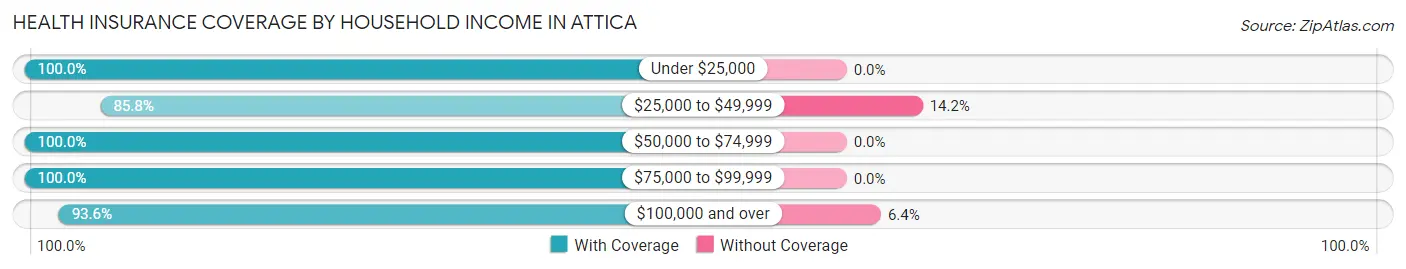
| Household Income | With Coverage | Without Coverage |
| Under $25,000 | 37 (100.0%) | 0 (0.0%) |
| $25,000 to $49,999 | 193 (85.8%) | 32 (14.2%) |
| $50,000 to $74,999 | 162 (100.0%) | 0 (0.0%) |
| $75,000 to $99,999 | 69 (100.0%) | 0 (0.0%) |
| $100,000 and over | 483 (93.6%) | 33 (6.4%) |
Public vs Private Health Insurance Coverage by Age in Attica
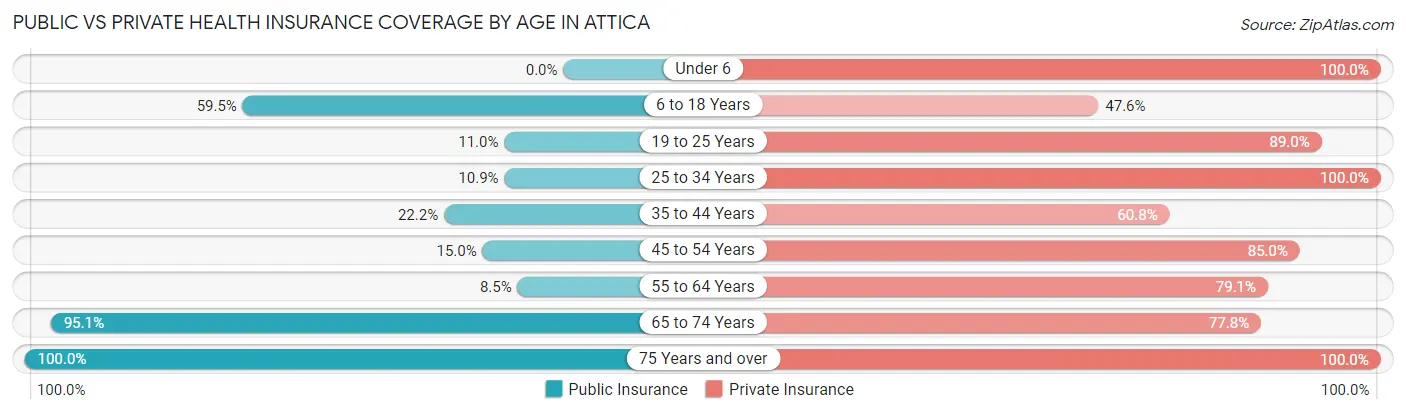
| Age Bracket | Public Insurance | Private Insurance |
| Under 6 | 0 (0.0%) | 9 (100.0%) |
| 6 to 18 Years | 50 (59.5%) | 40 (47.6%) |
| 19 to 25 Years | 8 (11.0%) | 65 (89.0%) |
| 25 to 34 Years | 7 (10.9%) | 64 (100.0%) |
| 35 to 44 Years | 43 (22.2%) | 118 (60.8%) |
| 45 to 54 Years | 9 (15.0%) | 51 (85.0%) |
| 55 to 64 Years | 13 (8.5%) | 121 (79.1%) |
| 65 to 74 Years | 313 (95.1%) | 256 (77.8%) |
| 75 Years and over | 43 (100.0%) | 43 (100.0%) |
| Total | 486 (48.2%) | 767 (76.0%) |
Disability Status by Sex by Age in Attica
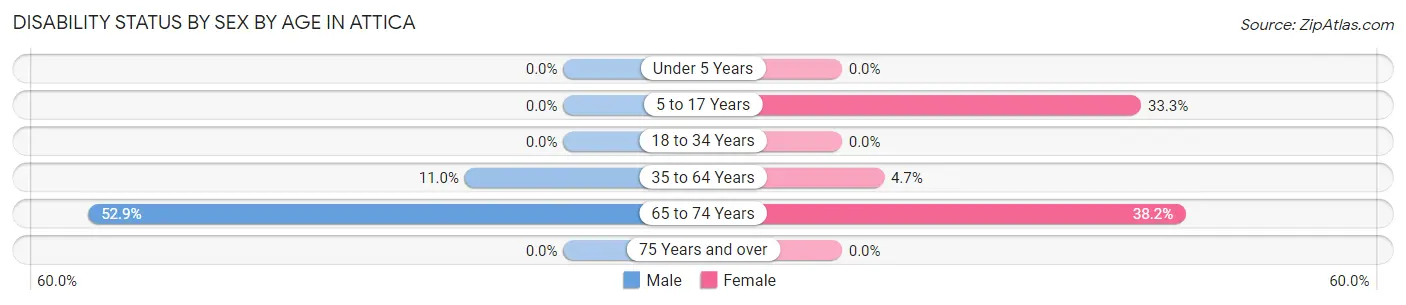
| Age Bracket | Male | Female |
| Under 5 Years | 0 (0.0%) | 0 (0.0%) |
| 5 to 17 Years | 0 (0.0%) | 5 (33.3%) |
| 18 to 34 Years | 0 (0.0%) | 0 (0.0%) |
| 35 to 64 Years | 19 (11.0%) | 11 (4.7%) |
| 65 to 74 Years | 91 (52.9%) | 60 (38.2%) |
| 75 Years and over | 0 (0.0%) | 0 (0.0%) |
Disability Class by Sex by Age in Attica
Disability Class: Hearing Difficulty
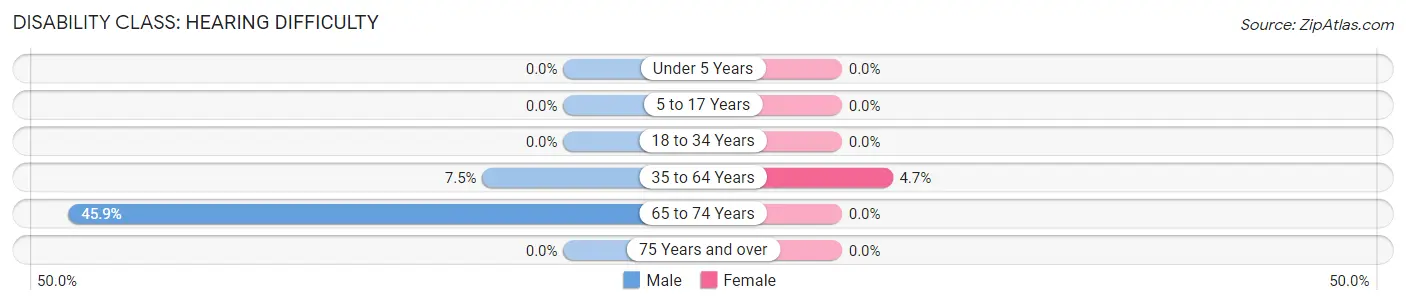
| Age Bracket | Male | Female |
| Under 5 Years | 0 (0.0%) | 0 (0.0%) |
| 5 to 17 Years | 0 (0.0%) | 0 (0.0%) |
| 18 to 34 Years | 0 (0.0%) | 0 (0.0%) |
| 35 to 64 Years | 13 (7.5%) | 11 (4.7%) |
| 65 to 74 Years | 79 (45.9%) | 0 (0.0%) |
| 75 Years and over | 0 (0.0%) | 0 (0.0%) |
Disability Class: Vision Difficulty
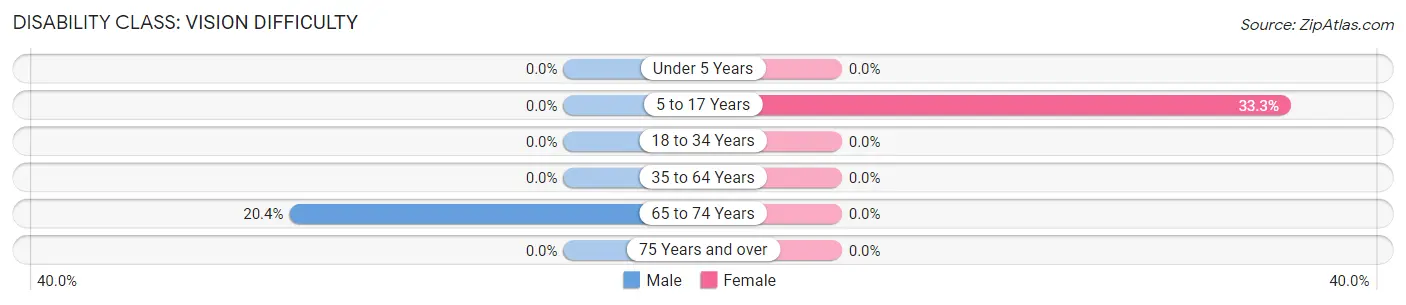
| Age Bracket | Male | Female |
| Under 5 Years | 0 (0.0%) | 0 (0.0%) |
| 5 to 17 Years | 0 (0.0%) | 5 (33.3%) |
| 18 to 34 Years | 0 (0.0%) | 0 (0.0%) |
| 35 to 64 Years | 0 (0.0%) | 0 (0.0%) |
| 65 to 74 Years | 35 (20.3%) | 0 (0.0%) |
| 75 Years and over | 0 (0.0%) | 0 (0.0%) |
Disability Class: Cognitive Difficulty
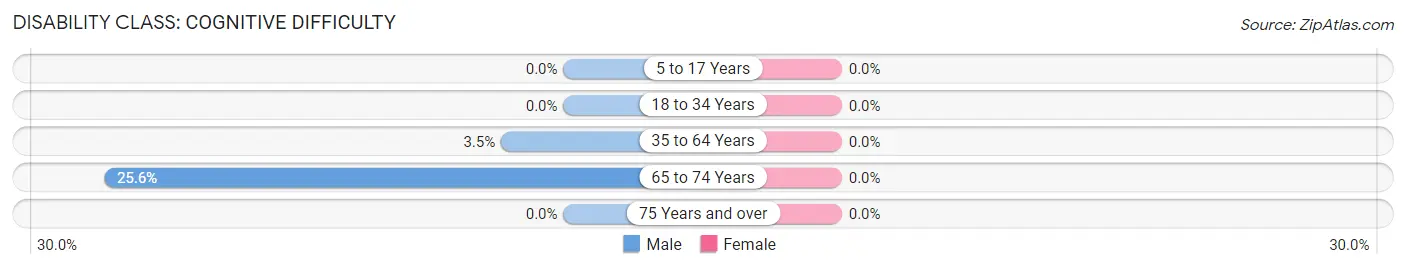
| Age Bracket | Male | Female |
| 5 to 17 Years | 0 (0.0%) | 0 (0.0%) |
| 18 to 34 Years | 0 (0.0%) | 0 (0.0%) |
| 35 to 64 Years | 6 (3.5%) | 0 (0.0%) |
| 65 to 74 Years | 44 (25.6%) | 0 (0.0%) |
| 75 Years and over | 0 (0.0%) | 0 (0.0%) |
Disability Class: Ambulatory Difficulty
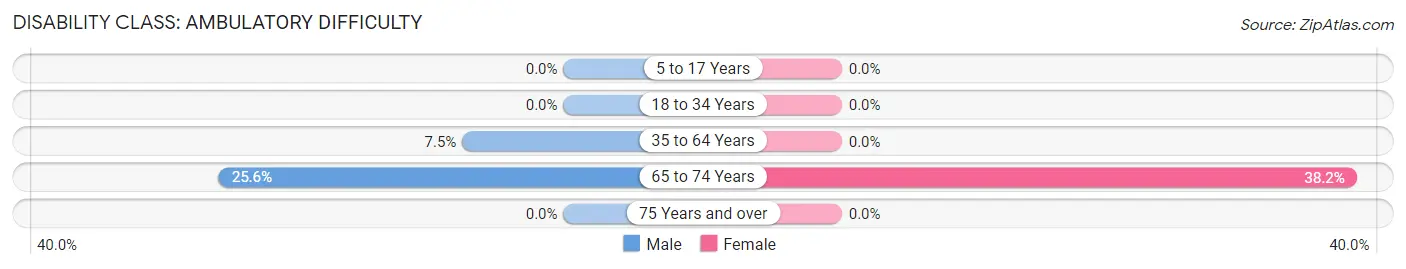
| Age Bracket | Male | Female |
| 5 to 17 Years | 0 (0.0%) | 0 (0.0%) |
| 18 to 34 Years | 0 (0.0%) | 0 (0.0%) |
| 35 to 64 Years | 13 (7.5%) | 0 (0.0%) |
| 65 to 74 Years | 44 (25.6%) | 60 (38.2%) |
| 75 Years and over | 0 (0.0%) | 0 (0.0%) |
Disability Class: Self-Care Difficulty
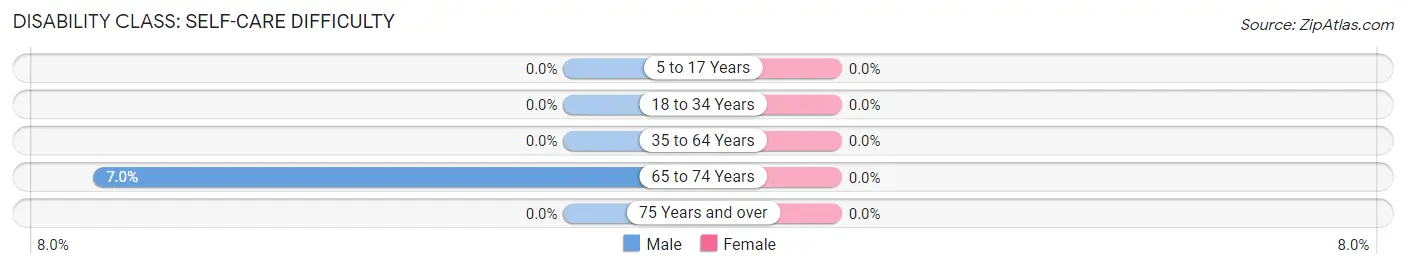
| Age Bracket | Male | Female |
| 5 to 17 Years | 0 (0.0%) | 0 (0.0%) |
| 18 to 34 Years | 0 (0.0%) | 0 (0.0%) |
| 35 to 64 Years | 0 (0.0%) | 0 (0.0%) |
| 65 to 74 Years | 12 (7.0%) | 0 (0.0%) |
| 75 Years and over | 0 (0.0%) | 0 (0.0%) |
Technology Access in Attica
Computing Device Access in Attica
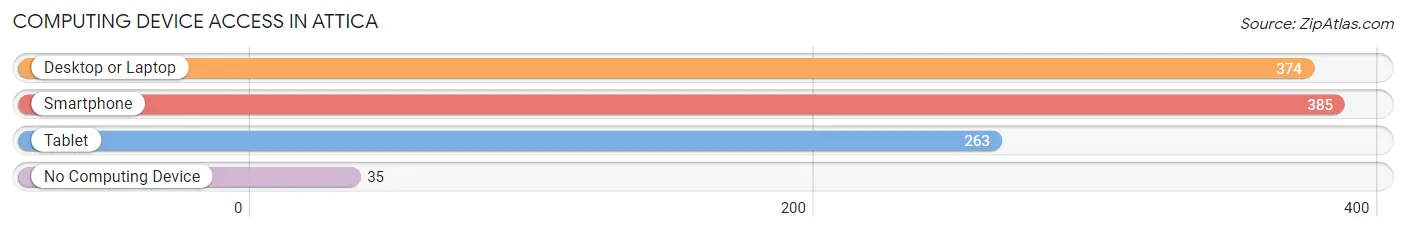
| Device Type | # Households | % Households |
| Desktop or Laptop | 374 | 89.0% |
| Smartphone | 385 | 91.7% |
| Tablet | 263 | 62.6% |
| No Computing Device | 35 | 8.3% |
| Total | 420 | 100.0% |
Internet Access in Attica
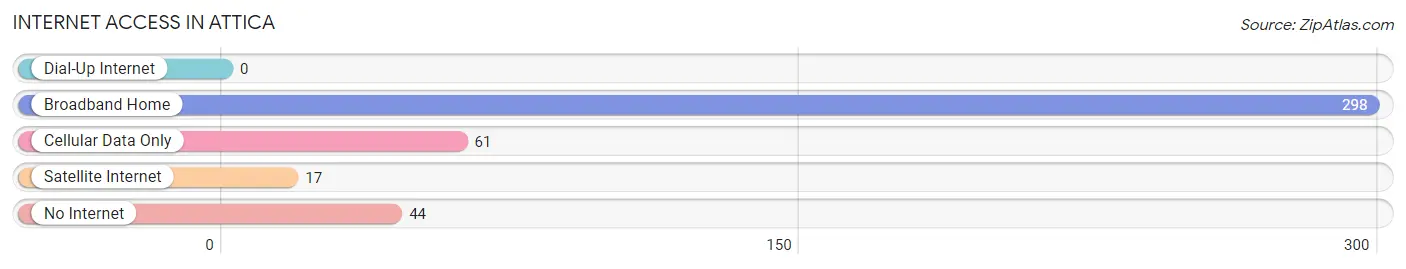
| Internet Type | # Households | % Households |
| Dial-Up Internet | 0 | 0.0% |
| Broadband Home | 298 | 71.0% |
| Cellular Data Only | 61 | 14.5% |
| Satellite Internet | 17 | 4.1% |
| No Internet | 44 | 10.5% |
| Total | 420 | 100.0% |
Attica Summary
Attica is a small village located in Lapeer County, Michigan. It is situated in the Thumb region of the state, approximately 40 miles north of Detroit. The village has a population of 1,845 people, according to the 2010 census.
History
Attica was first settled in 1837 by a group of settlers from New York. The village was named after Attica, New York, the hometown of the settlers. The first post office was established in 1838 and the village was incorporated in 1867.
Attica was a farming community for many years, but in the late 19th century, the village began to develop into a manufacturing center. The first factory was built in 1887 and by the early 20th century, Attica had become a major producer of furniture, stoves, and other products.
Geography
Attica is located in the Thumb region of Michigan, approximately 40 miles north of Detroit. The village is situated on the banks of the Flint River, which flows through the center of the village. The terrain is mostly flat, with some rolling hills in the surrounding area.
The climate in Attica is typical of the Midwest, with cold winters and hot summers. The average annual temperature is around 50 degrees Fahrenheit.
Economy
Attica’s economy is largely based on manufacturing. The village is home to several factories, including a furniture factory, a stove factory, and a metal fabrication plant. The village also has a number of small businesses, including restaurants, shops, and service providers.
The village is also home to a number of agricultural operations, including dairy farms, fruit orchards, and vegetable farms.
Demographics
According to the 2010 census, Attica has a population of 1,845 people. The racial makeup of the village is 95.3% White, 1.2% African American, 0.7% Native American, 0.3% Asian, and 2.5% from other races.
The median household income in Attica is $41,250, and the median family income is $50,000. The per capita income is $20,000. The unemployment rate is 5.2%.
Attica is served by the Lapeer County School District. The village has one elementary school, one middle school, and one high school. The village also has a public library and a number of churches.
Common Questions
What is Per Capita Income in Attica?
Per Capita income in Attica is $49,173.
What is the Median Family Income in Attica?
Median Family Income in Attica is $53,561.
What is the Median Household income in Attica?
Median Household Income in Attica is $73,952.
What is Income or Wage Gap in Attica?
Income or Wage Gap in Attica is 76.0%.
Women in Attica earn 24.0 cents for every dollar earned by a man.
What is Inequality or Gini Index in Attica?
Inequality or Gini Index in Attica is 0.50.
What is the Total Population of Attica?
Total Population of Attica is 1,009.
What is the Total Male Population of Attica?
Total Male Population of Attica is 497.
What is the Total Female Population of Attica?
Total Female Population of Attica is 512.
What is the Ratio of Males per 100 Females in Attica?
There are 97.07 Males per 100 Females in Attica.
What is the Ratio of Females per 100 Males in Attica?
There are 103.02 Females per 100 Males in Attica.
What is the Median Population Age in Attica?
Median Population Age in Attica is 56.4 Years.
What is the Average Family Size in Attica
Average Family Size in Attica is 2.5 People.
What is the Average Household Size in Attica
Average Household Size in Attica is 2.4 People.
How Large is the Labor Force in Attica?
There are 523 People in the Labor Forcein in Attica.
What is the Percentage of People in the Labor Force in Attica?
56.7% of People are in the Labor Force in Attica.
What is the Unemployment Rate in Attica?
Unemployment Rate in Attica is 2.5%.