Horton Bay, MI Map & Demographics
Horton Bay Map
Horton Bay Overview
$50,944
PER CAPITA INCOME
$76,932
AVG FAMILY INCOME
$73,929
AVG HOUSEHOLD INCOME
33.2%
WAGE / INCOME GAP [ % ]
66.8¢/ $1
WAGE / INCOME GAP [ $ ]
0.37
INEQUALITY / GINI INDEX
379
TOTAL POPULATION
168
MALE POPULATION
211
FEMALE POPULATION
79.62
MALES / 100 FEMALES
125.60
FEMALES / 100 MALES
64.3
MEDIAN AGE
2.1
AVG FAMILY SIZE
1.9
AVG HOUSEHOLD SIZE
159
LABOR FORCE [ PEOPLE ]
46.2%
PERCENT IN LABOR FORCE
2.5%
UNEMPLOYMENT RATE
Income in Horton Bay
Income Overview in Horton Bay
Per Capita Income in Horton Bay is $50,944, while median incomes of families and households are $76,932 and $73,929 respectively.
| Characteristic | Number | Measure |
| Per Capita Income | 379 | $50,944 |
| Median Family Income | 147 | $76,932 |
| Mean Family Income | 147 | $111,012 |
| Median Household Income | 204 | $73,929 |
| Mean Household Income | 204 | $98,017 |
| Income Deficit | 147 | $0 |
| Wage / Income Gap (%) | 379 | 33.18% |
| Wage / Income Gap ($) | 379 | 66.82¢ per $1 |
| Gini / Inequality Index | 379 | 0.37 |
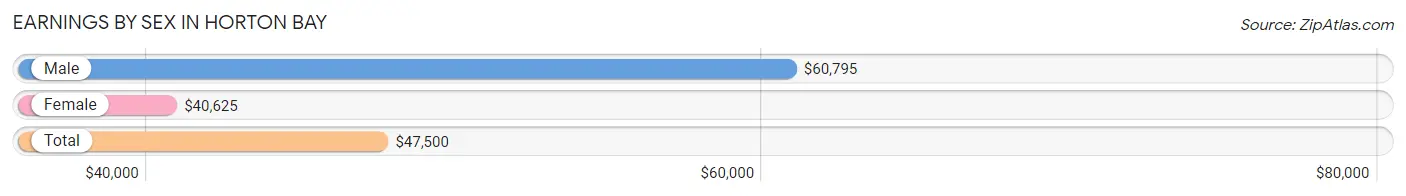
Earnings by Sex in Horton Bay
Average Earnings in Horton Bay are $47,500, $60,795 for men and $40,625 for women, a difference of 33.2%.
| Sex | Number | Average Earnings |
| Male | 91 (55.5%) | $60,795 |
| Female | 73 (44.5%) | $40,625 |
| Total | 164 (100.0%) | $47,500 |
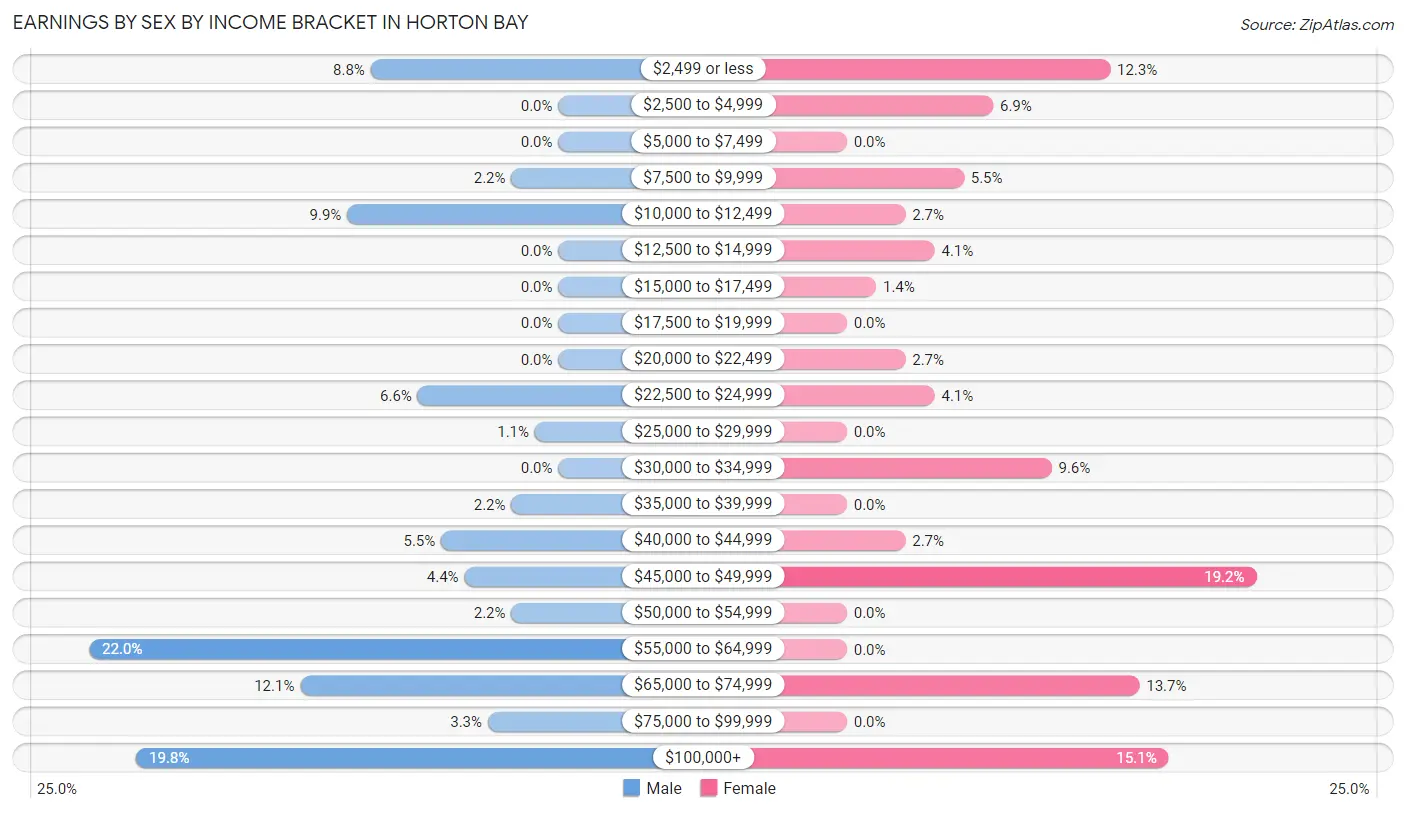
Earnings by Sex by Income Bracket in Horton Bay
The most common earnings brackets in Horton Bay are $55,000 to $64,999 for men (20 | 22.0%) and $45,000 to $49,999 for women (14 | 19.2%).
| Income | Male | Female |
| $2,499 or less | 8 (8.8%) | 9 (12.3%) |
| $2,500 to $4,999 | 0 (0.0%) | 5 (6.9%) |
| $5,000 to $7,499 | 0 (0.0%) | 0 (0.0%) |
| $7,500 to $9,999 | 2 (2.2%) | 4 (5.5%) |
| $10,000 to $12,499 | 9 (9.9%) | 2 (2.7%) |
| $12,500 to $14,999 | 0 (0.0%) | 3 (4.1%) |
| $15,000 to $17,499 | 0 (0.0%) | 1 (1.4%) |
| $17,500 to $19,999 | 0 (0.0%) | 0 (0.0%) |
| $20,000 to $22,499 | 0 (0.0%) | 2 (2.7%) |
| $22,500 to $24,999 | 6 (6.6%) | 3 (4.1%) |
| $25,000 to $29,999 | 1 (1.1%) | 0 (0.0%) |
| $30,000 to $34,999 | 0 (0.0%) | 7 (9.6%) |
| $35,000 to $39,999 | 2 (2.2%) | 0 (0.0%) |
| $40,000 to $44,999 | 5 (5.5%) | 2 (2.7%) |
| $45,000 to $49,999 | 4 (4.4%) | 14 (19.2%) |
| $50,000 to $54,999 | 2 (2.2%) | 0 (0.0%) |
| $55,000 to $64,999 | 20 (22.0%) | 0 (0.0%) |
| $65,000 to $74,999 | 11 (12.1%) | 10 (13.7%) |
| $75,000 to $99,999 | 3 (3.3%) | 0 (0.0%) |
| $100,000+ | 18 (19.8%) | 11 (15.1%) |
| Total | 91 (100.0%) | 73 (100.0%) |
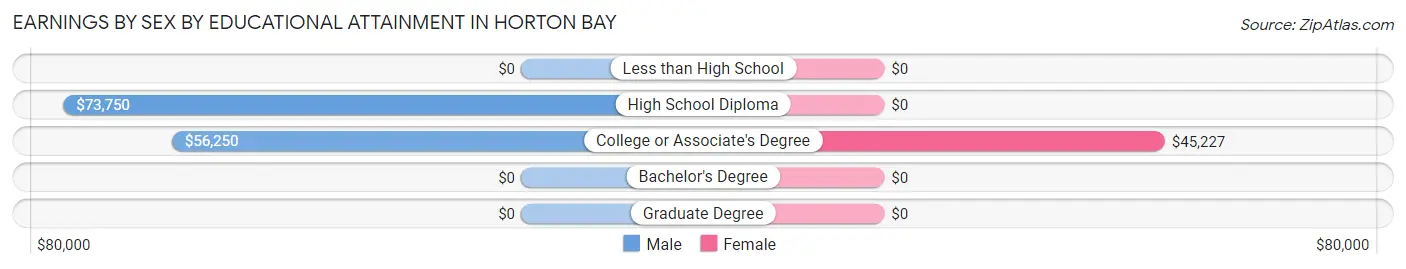
Earnings by Sex by Educational Attainment in Horton Bay
Average earnings in Horton Bay are $61,364 for men and $34,688 for women, a difference of 43.5%. Men with an educational attainment of high school diploma enjoy the highest average annual earnings of $73,750, while those with college or associate's degree education earn the least with $56,250. Women with an educational attainment of college or associate's degree earn the most with the average annual earnings of $45,227, while those with college or associate's degree education have the smallest earnings of $45,227.
| Educational Attainment | Male Income | Female Income |
| Less than High School | - | - |
| High School Diploma | $73,750 | $0 |
| College or Associate's Degree | $56,250 | $45,227 |
| Bachelor's Degree | - | - |
| Graduate Degree | - | - |
| Total | $61,364 | $34,688 |
Family Income in Horton Bay
Family Income Brackets in Horton Bay
According to the Horton Bay family income data, there are 36 families falling into the $75,000 to $99,999 income range, which is the most common income bracket and makes up 24.5% of all families.
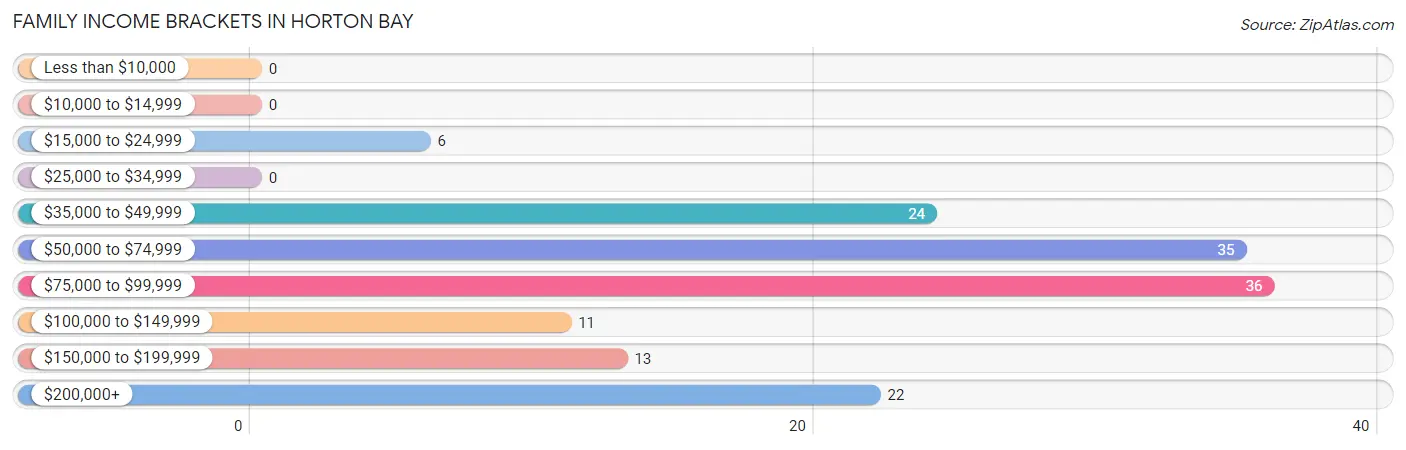
| Income Bracket | # Families | % Families |
| Less than $10,000 | 0 | 0.0% |
| $10,000 to $14,999 | 0 | 0.0% |
| $15,000 to $24,999 | 6 | 4.1% |
| $25,000 to $34,999 | 0 | 0.0% |
| $35,000 to $49,999 | 24 | 16.3% |
| $50,000 to $74,999 | 35 | 23.8% |
| $75,000 to $99,999 | 36 | 24.5% |
| $100,000 to $149,999 | 11 | 7.5% |
| $150,000 to $199,999 | 13 | 8.8% |
| $200,000+ | 22 | 15.0% |
Family Income by Famaliy Size in Horton Bay
2-person families (111 | 75.5%) account for the highest median family income in Horton Bay with $77,386 per family, while 2-person families (111 | 75.5%) have the highest median income of $38,693 per family member.
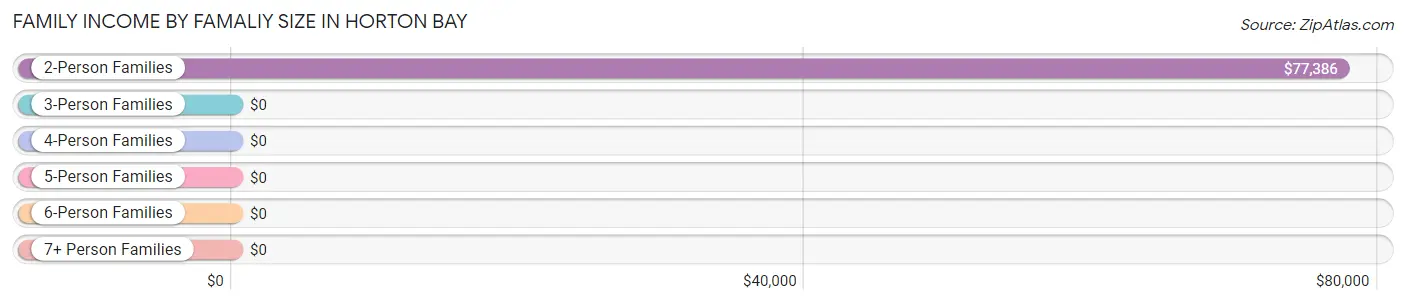
| Income Bracket | # Families | Median Income |
| 2-Person Families | 111 (75.5%) | $77,386 |
| 3-Person Families | 30 (20.4%) | $0 |
| 4-Person Families | 6 (4.1%) | $0 |
| 5-Person Families | 0 (0.0%) | $0 |
| 6-Person Families | 0 (0.0%) | $0 |
| 7+ Person Families | 0 (0.0%) | $0 |
| Total | 147 (100.0%) | $76,932 |
Family Income by Number of Earners in Horton Bay
The median family income in Horton Bay is $76,932, with families comprising 3+ earners (9) having the highest median family income of $250,001, while families with 1 earner (29) have the lowest median family income of $63,068, accounting for 6.1% and 19.7% of families, respectively.
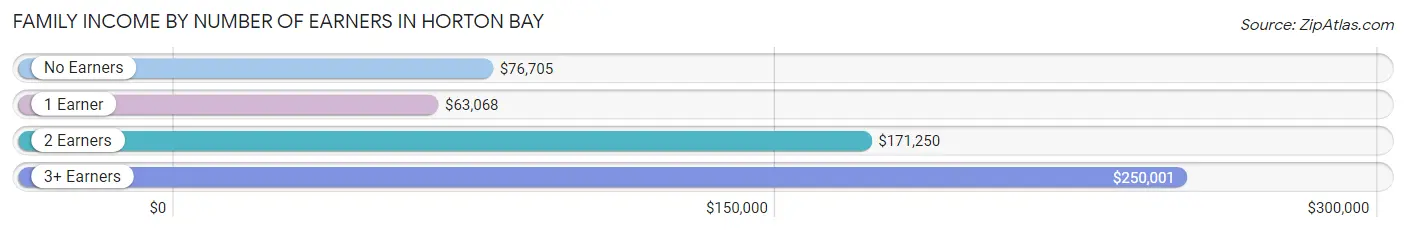
| Number of Earners | # Families | Median Income |
| No Earners | 67 (45.6%) | $76,705 |
| 1 Earner | 29 (19.7%) | $63,068 |
| 2 Earners | 42 (28.6%) | $171,250 |
| 3+ Earners | 9 (6.1%) | $250,001 |
| Total | 147 (100.0%) | $76,932 |
Household Income in Horton Bay
Household Income Brackets in Horton Bay
With 63 households falling in the category, the $50,000 to $74,999 income range is the most frequent in Horton Bay, accounting for 30.9% of all households.
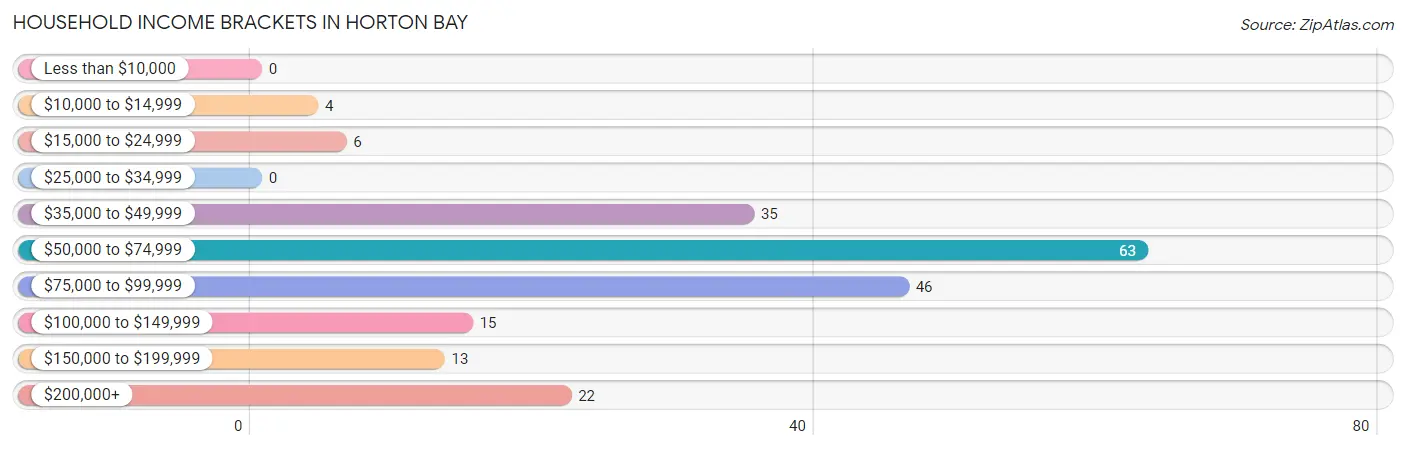
| Income Bracket | # Households | % Households |
| Less than $10,000 | 0 | 0.0% |
| $10,000 to $14,999 | 4 | 2.0% |
| $15,000 to $24,999 | 6 | 2.9% |
| $25,000 to $34,999 | 0 | 0.0% |
| $35,000 to $49,999 | 35 | 17.2% |
| $50,000 to $74,999 | 63 | 30.9% |
| $75,000 to $99,999 | 46 | 22.5% |
| $100,000 to $149,999 | 15 | 7.4% |
| $150,000 to $199,999 | 13 | 6.4% |
| $200,000+ | 22 | 10.8% |
Household Income by Householder Age in Horton Bay
The median household income in Horton Bay is $73,929, with the highest median household income of $74,886 found in the 45 to 64 years age bracket for the primary householder. A total of 73 households (35.8%) fall into this category.
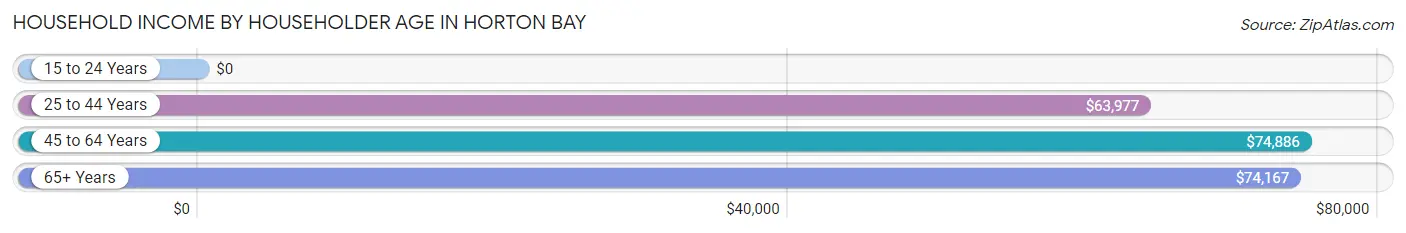
| Income Bracket | # Households | Median Income |
| 15 to 24 Years | 0 (0.0%) | $0 |
| 25 to 44 Years | 23 (11.3%) | $63,977 |
| 45 to 64 Years | 73 (35.8%) | $74,886 |
| 65+ Years | 108 (52.9%) | $74,167 |
| Total | 204 (100.0%) | $73,929 |
Poverty in Horton Bay
Income Below Poverty by Sex and Age in Horton Bay
With 1.2% poverty level for males and 2.0% for females among the residents of Horton Bay, 35 to 44 year old males and 45 to 54 year old females are the most vulnerable to poverty, with 2 males (25.0%) and 4 females (26.7%) in their respective age groups living below the poverty level.
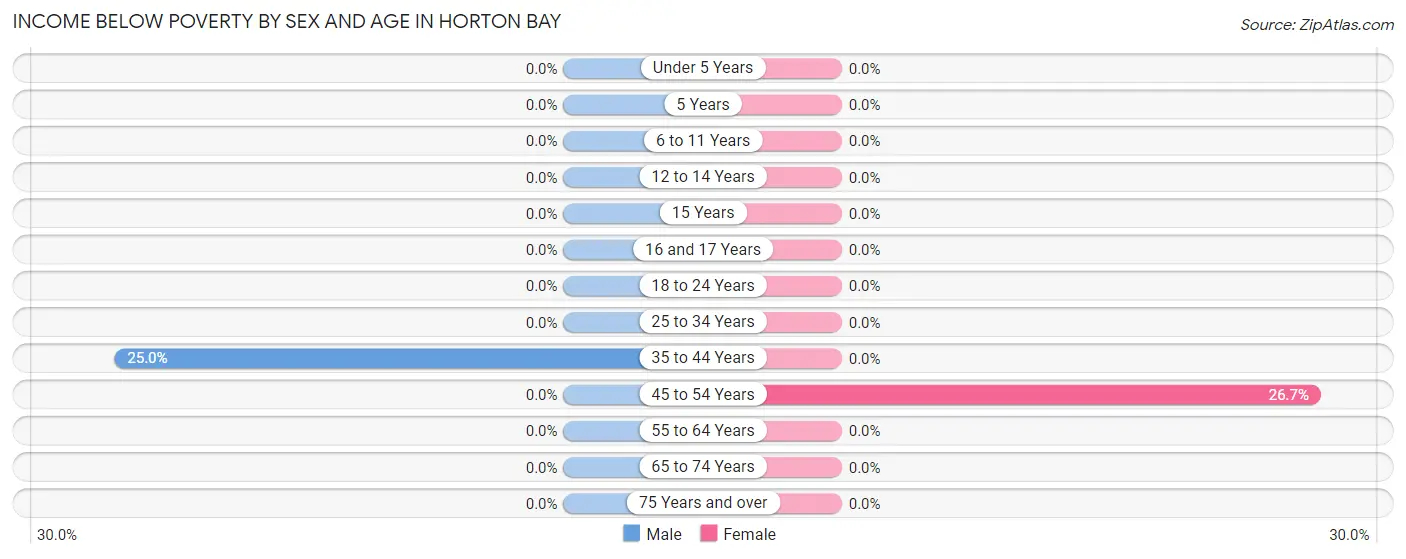
| Age Bracket | Male | Female |
| Under 5 Years | 0 (0.0%) | 0 (0.0%) |
| 5 Years | 0 (0.0%) | 0 (0.0%) |
| 6 to 11 Years | 0 (0.0%) | 0 (0.0%) |
| 12 to 14 Years | 0 (0.0%) | 0 (0.0%) |
| 15 Years | 0 (0.0%) | 0 (0.0%) |
| 16 and 17 Years | 0 (0.0%) | 0 (0.0%) |
| 18 to 24 Years | 0 (0.0%) | 0 (0.0%) |
| 25 to 34 Years | 0 (0.0%) | 0 (0.0%) |
| 35 to 44 Years | 2 (25.0%) | 0 (0.0%) |
| 45 to 54 Years | 0 (0.0%) | 4 (26.7%) |
| 55 to 64 Years | 0 (0.0%) | 0 (0.0%) |
| 65 to 74 Years | 0 (0.0%) | 0 (0.0%) |
| 75 Years and over | 0 (0.0%) | 0 (0.0%) |
| Total | 2 (1.2%) | 4 (2.0%) |
Income Above Poverty by Sex and Age in Horton Bay
According to the poverty statistics in Horton Bay, males aged 18 to 24 years and females aged 6 to 11 years are the age groups that are most secure financially, with 100.0% of males and 100.0% of females in these age groups living above the poverty line.
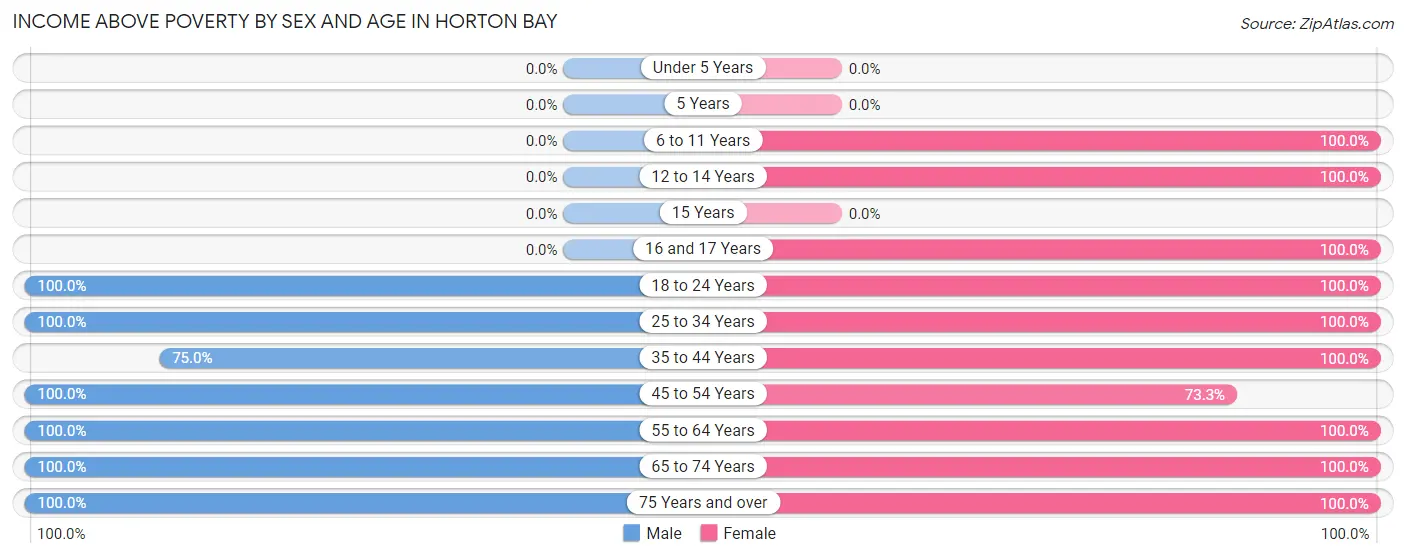
| Age Bracket | Male | Female |
| Under 5 Years | 0 (0.0%) | 0 (0.0%) |
| 5 Years | 0 (0.0%) | 0 (0.0%) |
| 6 to 11 Years | 0 (0.0%) | 8 (100.0%) |
| 12 to 14 Years | 0 (0.0%) | 20 (100.0%) |
| 15 Years | 0 (0.0%) | 0 (0.0%) |
| 16 and 17 Years | 0 (0.0%) | 11 (100.0%) |
| 18 to 24 Years | 5 (100.0%) | 9 (100.0%) |
| 25 to 34 Years | 6 (100.0%) | 3 (100.0%) |
| 35 to 44 Years | 6 (75.0%) | 11 (100.0%) |
| 45 to 54 Years | 17 (100.0%) | 11 (73.3%) |
| 55 to 64 Years | 36 (100.0%) | 44 (100.0%) |
| 65 to 74 Years | 56 (100.0%) | 52 (100.0%) |
| 75 Years and over | 40 (100.0%) | 31 (100.0%) |
| Total | 166 (98.8%) | 200 (98.0%) |
Income Below Poverty Among Married-Couple Families in Horton Bay
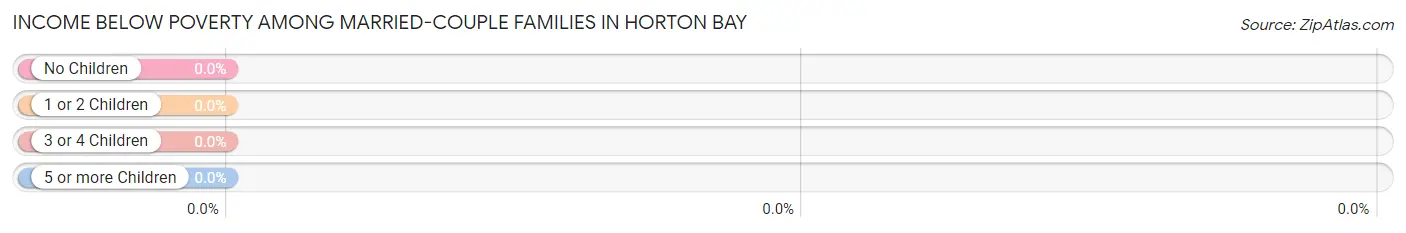
| Children | Above Poverty | Below Poverty |
| No Children | 103 (100.0%) | 0 (0.0%) |
| 1 or 2 Children | 14 (100.0%) | 0 (0.0%) |
| 3 or 4 Children | 0 (0.0%) | 0 (0.0%) |
| 5 or more Children | 0 (0.0%) | 0 (0.0%) |
| Total | 117 (100.0%) | 0 (0.0%) |
Income Below Poverty Among Single-Parent Households in Horton Bay
| Children | Single Father | Single Mother |
| No Children | 0 (0.0%) | 0 (0.0%) |
| 1 or 2 Children | 0 (0.0%) | 0 (0.0%) |
| 3 or 4 Children | 0 (0.0%) | 0 (0.0%) |
| 5 or more Children | 0 (0.0%) | 0 (0.0%) |
| Total | 0 (0.0%) | 0 (0.0%) |
Income Below Poverty Among Married-Couple vs Single-Parent Households in Horton Bay
| Children | Married-Couple Families | Single-Parent Households |
| No Children | 0 (0.0%) | 0 (0.0%) |
| 1 or 2 Children | 0 (0.0%) | 0 (0.0%) |
| 3 or 4 Children | 0 (0.0%) | 0 (0.0%) |
| 5 or more Children | 0 (0.0%) | 0 (0.0%) |
| Total | 0 (0.0%) | 0 (0.0%) |
Race in Horton Bay
The most populous races in Horton Bay are White / Caucasian (357 | 94.2%), Two or more Races (20 | 5.3%), and Hawaiian / Pacific (2 | 0.5%).
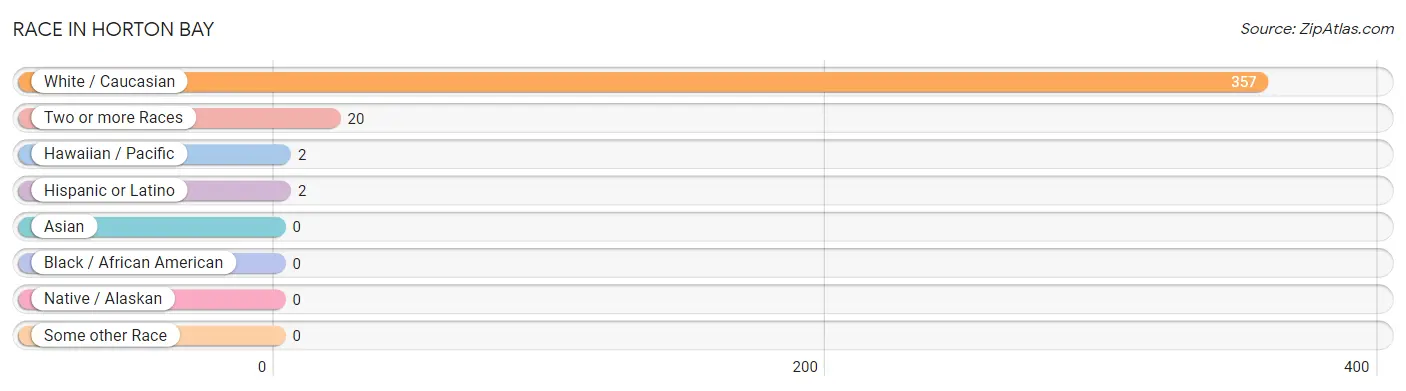
| Race | # Population | % Population |
| Asian | 0 | 0.0% |
| Black / African American | 0 | 0.0% |
| Hawaiian / Pacific | 2 | 0.5% |
| Hispanic or Latino | 2 | 0.5% |
| Native / Alaskan | 0 | 0.0% |
| White / Caucasian | 357 | 94.2% |
| Two or more Races | 20 | 5.3% |
| Some other Race | 0 | 0.0% |
| Total | 379 | 100.0% |
Ancestry in Horton Bay
The most populous ancestries reported in Horton Bay are English (111 | 29.3%), German (84 | 22.2%), Irish (71 | 18.7%), Italian (39 | 10.3%), and French (24 | 6.3%), together accounting for 86.8% of all Horton Bay residents.
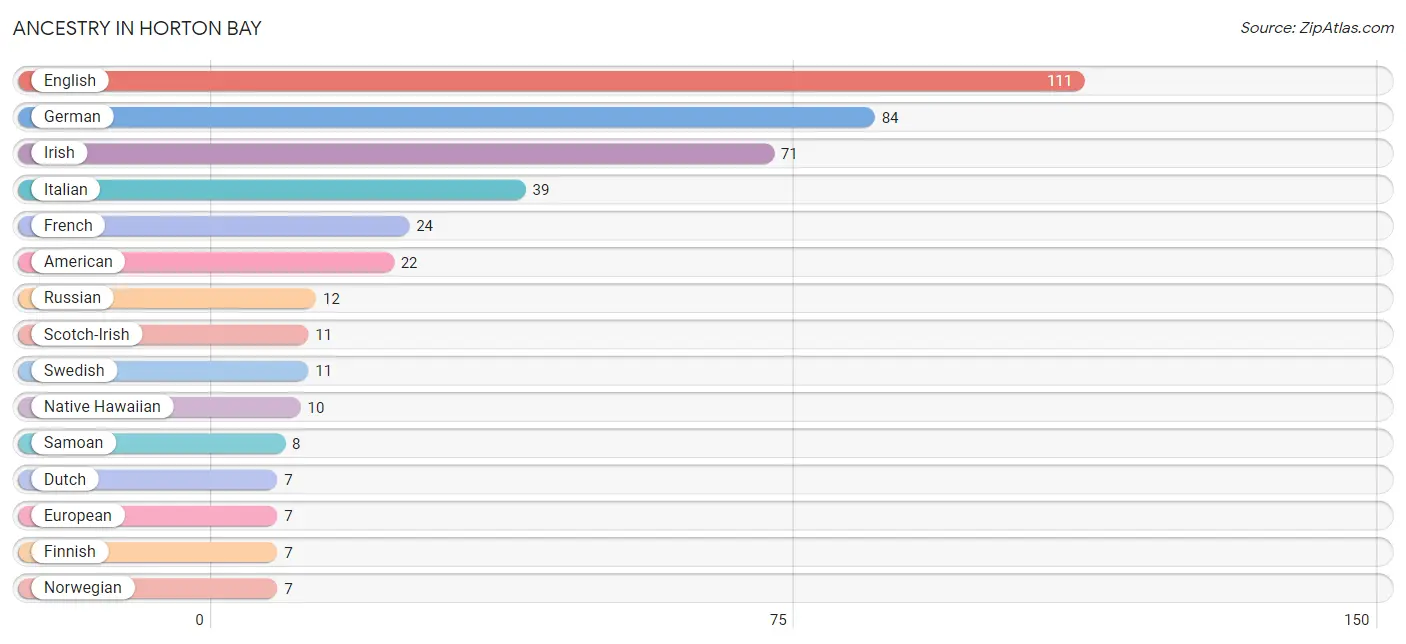
| Ancestry | # Population | % Population |
| American | 22 | 5.8% |
| Belgian | 2 | 0.5% |
| British | 3 | 0.8% |
| Czech | 5 | 1.3% |
| Dutch | 7 | 1.8% |
| Eastern European | 2 | 0.5% |
| English | 111 | 29.3% |
| European | 7 | 1.8% |
| Finnish | 7 | 1.8% |
| French | 24 | 6.3% |
| French Canadian | 5 | 1.3% |
| German | 84 | 22.2% |
| Hungarian | 3 | 0.8% |
| Irish | 71 | 18.7% |
| Italian | 39 | 10.3% |
| Native Hawaiian | 10 | 2.6% |
| Norwegian | 7 | 1.8% |
| Polish | 7 | 1.8% |
| Puerto Rican | 2 | 0.5% |
| Russian | 12 | 3.2% |
| Samoan | 8 | 2.1% |
| Scotch-Irish | 11 | 2.9% |
| Scottish | 7 | 1.8% |
| Swedish | 11 | 2.9% | View All 24 Rows |
Immigrants in Horton Bay
The most numerous immigrant groups reported in Horton Bay came from , and Canada (3 | 0.8%), together accounting for 0.8% of all Horton Bay residents.

| Immigration Origin | # Population | % Population |
| Canada | 3 | 0.8% | View All 1 Rows |
Sex and Age in Horton Bay
Sex and Age in Horton Bay
The most populous age groups in Horton Bay are 65 to 69 Years (44 | 26.2%) for men and 60 to 64 Years (31 | 14.7%) for women.
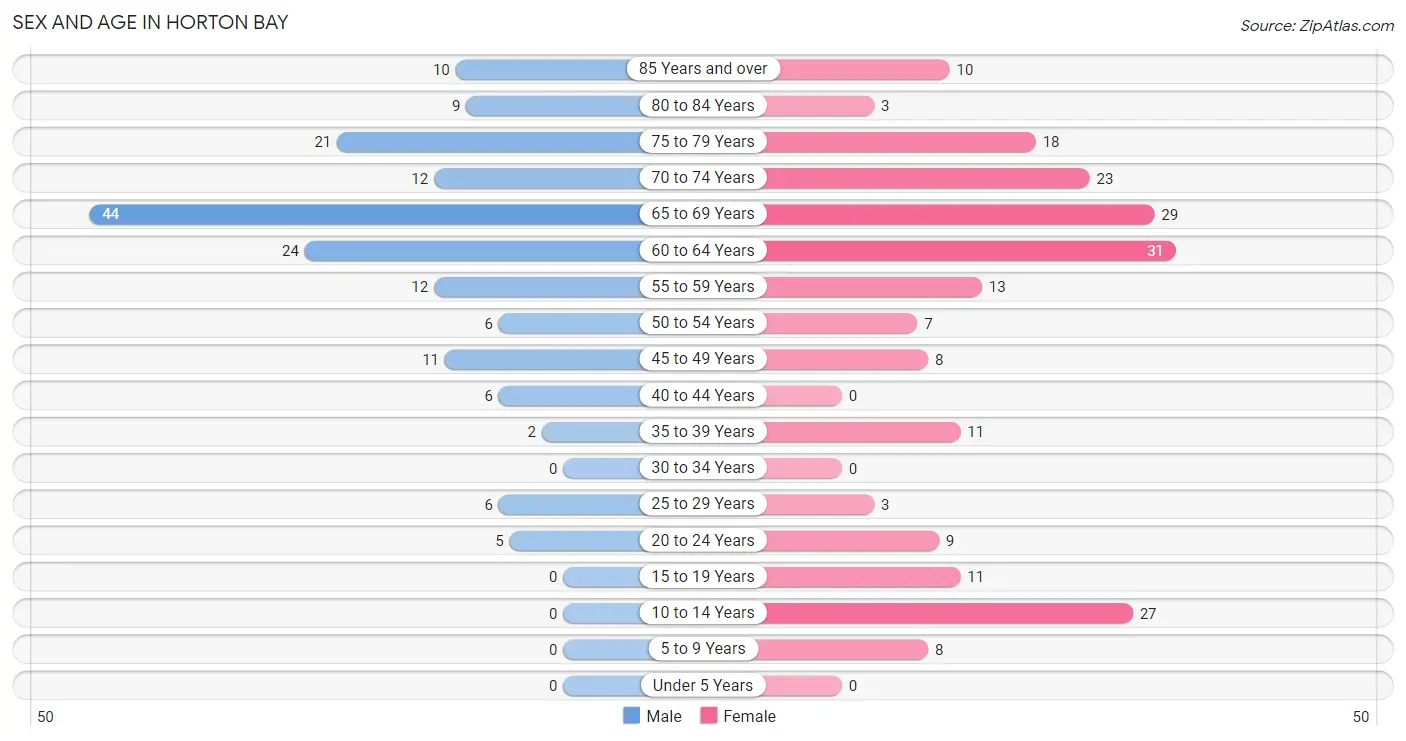
| Age Bracket | Male | Female |
| Under 5 Years | 0 (0.0%) | 0 (0.0%) |
| 5 to 9 Years | 0 (0.0%) | 8 (3.8%) |
| 10 to 14 Years | 0 (0.0%) | 27 (12.8%) |
| 15 to 19 Years | 0 (0.0%) | 11 (5.2%) |
| 20 to 24 Years | 5 (3.0%) | 9 (4.3%) |
| 25 to 29 Years | 6 (3.6%) | 3 (1.4%) |
| 30 to 34 Years | 0 (0.0%) | 0 (0.0%) |
| 35 to 39 Years | 2 (1.2%) | 11 (5.2%) |
| 40 to 44 Years | 6 (3.6%) | 0 (0.0%) |
| 45 to 49 Years | 11 (6.6%) | 8 (3.8%) |
| 50 to 54 Years | 6 (3.6%) | 7 (3.3%) |
| 55 to 59 Years | 12 (7.1%) | 13 (6.2%) |
| 60 to 64 Years | 24 (14.3%) | 31 (14.7%) |
| 65 to 69 Years | 44 (26.2%) | 29 (13.7%) |
| 70 to 74 Years | 12 (7.1%) | 23 (10.9%) |
| 75 to 79 Years | 21 (12.5%) | 18 (8.5%) |
| 80 to 84 Years | 9 (5.4%) | 3 (1.4%) |
| 85 Years and over | 10 (5.9%) | 10 (4.7%) |
| Total | 168 (100.0%) | 211 (100.0%) |
Families and Households in Horton Bay
Median Family Size in Horton Bay
The median family size in Horton Bay is 2.11 persons per family, with single female/mother families (29 | 19.7%) accounting for the largest median family size of 2.31 persons per family. On the other hand, single male/father families (1 | 0.7%) represent the smallest median family size with 2.00 persons per family.
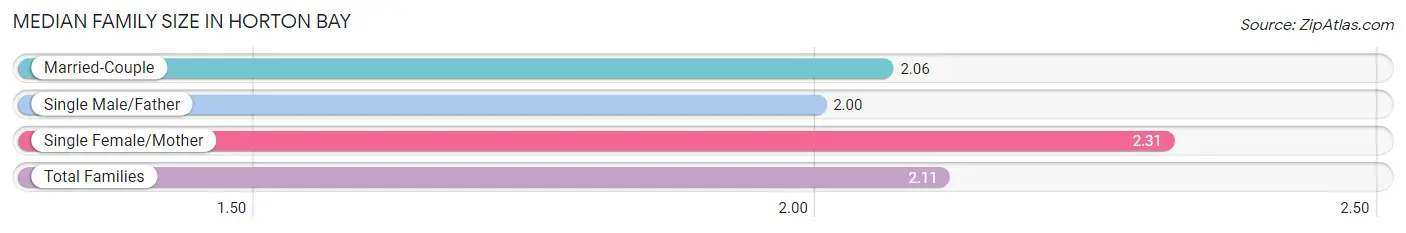
| Family Type | # Families | Family Size |
| Married-Couple | 117 (79.6%) | 2.06 |
| Single Male/Father | 1 (0.7%) | 2.00 |
| Single Female/Mother | 29 (19.7%) | 2.31 |
| Total Families | 147 (100.0%) | 2.11 |
Median Household Size in Horton Bay
The median household size in Horton Bay is 1.86 persons per household, with single male/father households (1 | 0.5%) accounting for the largest median household size of 3 persons per household. non-family households (57 | 27.9%) represent the smallest median household size with 1.04 persons per household.
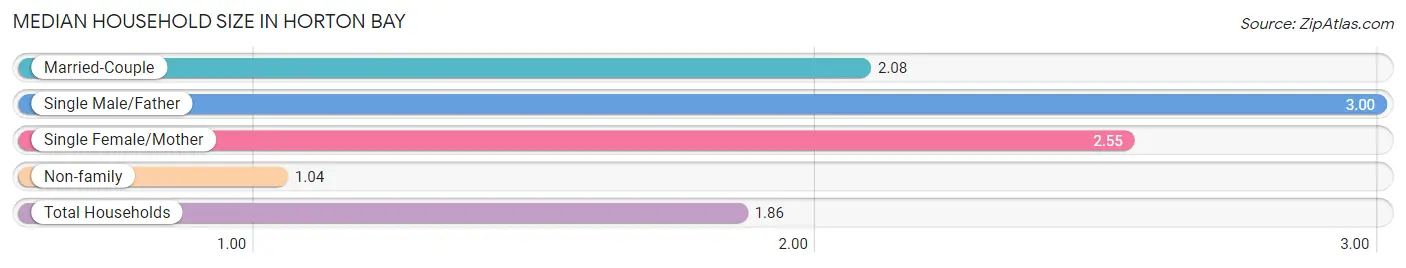
| Household Type | # Households | Household Size |
| Married-Couple | 117 (57.4%) | 2.08 |
| Single Male/Father | 1 (0.5%) | 3.00 |
| Single Female/Mother | 29 (14.2%) | 2.55 |
| Non-family | 57 (27.9%) | 1.04 |
| Total Households | 204 (100.0%) | 1.86 |
Household Size by Marriage Status in Horton Bay
Out of a total of 204 households in Horton Bay, 147 (72.1%) are family households, while 57 (27.9%) are nonfamily households. The most numerous type of family households are 2-person households, comprising 107, and the most common type of nonfamily households are 1-person households, comprising 54.
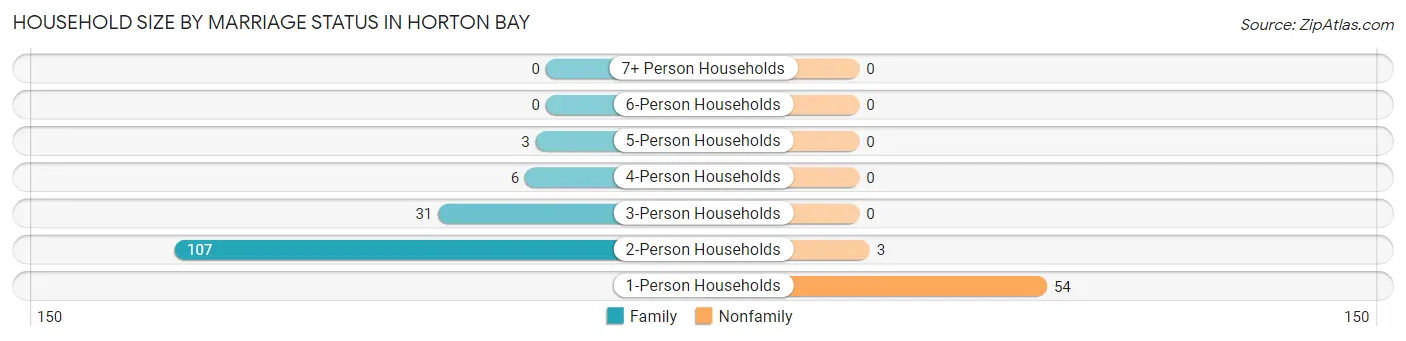
| Household Size | Family Households | Nonfamily Households |
| 1-Person Households | - | 54 (26.5%) |
| 2-Person Households | 107 (52.4%) | 3 (1.5%) |
| 3-Person Households | 31 (15.2%) | 0 (0.0%) |
| 4-Person Households | 6 (2.9%) | 0 (0.0%) |
| 5-Person Households | 3 (1.5%) | 0 (0.0%) |
| 6-Person Households | 0 (0.0%) | 0 (0.0%) |
| 7+ Person Households | 0 (0.0%) | 0 (0.0%) |
| Total | 147 (72.1%) | 57 (27.9%) |
Female Fertility in Horton Bay
Fertility by Age in Horton Bay
| Age Bracket | Women with Births | Births / 1,000 Women |
| 15 to 19 years | 0 (0.0%) | 0.0 |
| 20 to 34 years | 0 (0.0%) | 0.0 |
| 35 to 50 years | 0 (0.0%) | 0.0 |
| Total | 0 (0.0%) | 0.0 |
Fertility by Age by Marriage Status in Horton Bay
| Age Bracket | Married | Unmarried |
| 15 to 19 years | 0 (0.0%) | 0 (0.0%) |
| 20 to 34 years | 0 (0.0%) | 0 (0.0%) |
| 35 to 50 years | 0 (0.0%) | 0 (0.0%) |
| Total | 0 (0.0%) | 0 (0.0%) |
Fertility by Education in Horton Bay
| Educational Attainment | Women with Births | Births / 1,000 Women |
| Less than High School | 0 (0.0%) | 0.0 |
| High School Diploma | 0 (0.0%) | 0.0 |
| College or Associate's Degree | 0 (0.0%) | 0.0 |
| Bachelor's Degree | 0 (0.0%) | 0.0 |
| Graduate Degree | 0 (0.0%) | 0.0 |
| Total | 0 (0.0%) | 0.0 |
Fertility by Education by Marriage Status in Horton Bay
| Educational Attainment | Married | Unmarried |
| Less than High School | 0 (0.0%) | 0 (0.0%) |
| High School Diploma | 0 (0.0%) | 0 (0.0%) |
| College or Associate's Degree | 0 (0.0%) | 0 (0.0%) |
| Bachelor's Degree | 0 (0.0%) | 0 (0.0%) |
| Graduate Degree | 0 (0.0%) | 0 (0.0%) |
| Total | 0 (0.0%) | 0 (0.0%) |
Employment Characteristics in Horton Bay
Employment by Class of Employer in Horton Bay
Among the 148 employed individuals in Horton Bay, private company employees (77 | 52.0%), self-employed (not incorporated) (22 | 14.9%), and not-for-profit organizations (13 | 8.8%) make up the most common classes of employment.
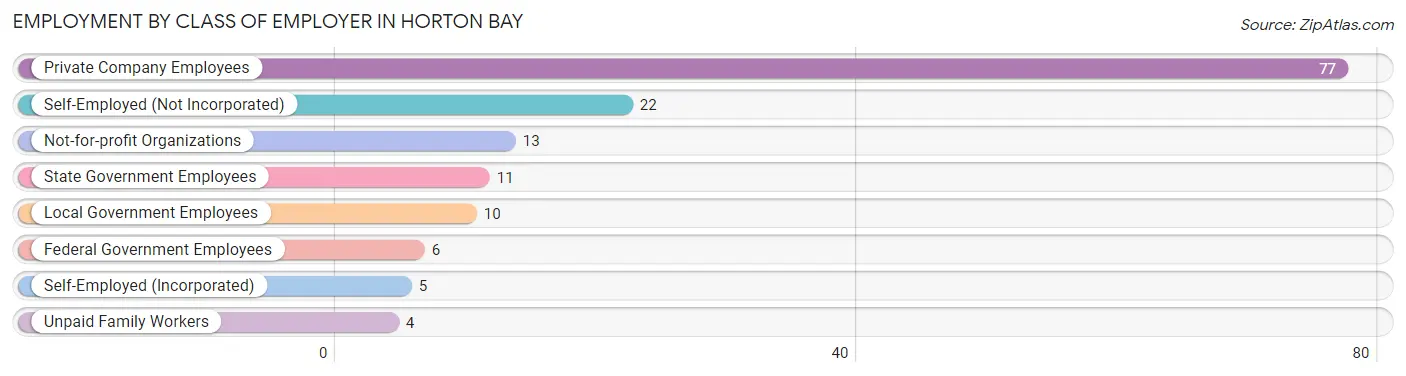
| Employer Class | # Employees | % Employees |
| Private Company Employees | 77 | 52.0% |
| Self-Employed (Incorporated) | 5 | 3.4% |
| Self-Employed (Not Incorporated) | 22 | 14.9% |
| Not-for-profit Organizations | 13 | 8.8% |
| Local Government Employees | 10 | 6.8% |
| State Government Employees | 11 | 7.4% |
| Federal Government Employees | 6 | 4.1% |
| Unpaid Family Workers | 4 | 2.7% |
| Total | 148 | 100.0% |
Employment Status by Age in Horton Bay
According to the labor force statistics for Horton Bay, out of the total population over 16 years of age (344), 46.2% or 159 individuals are in the labor force, with 2.5% or 4 of them unemployed. The age group with the highest labor force participation rate is 20 to 24 years, with 100.0% or 14 individuals in the labor force. Within the labor force, the 65 to 74 years age range has the highest percentage of unemployed individuals, with 13.6% or 3 of them being unemployed.
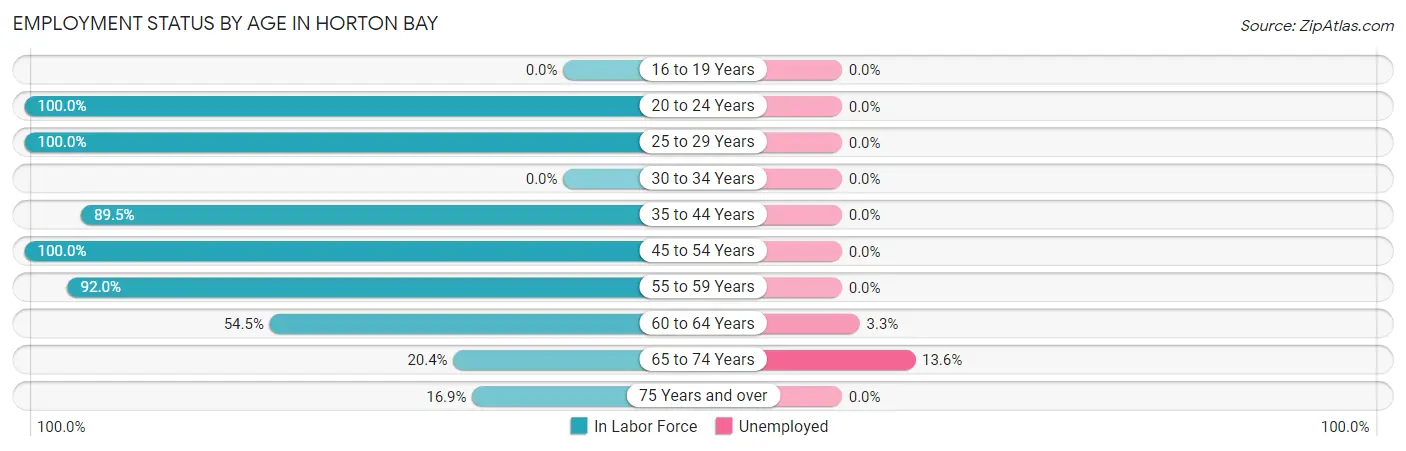
| Age Bracket | In Labor Force | Unemployed |
| 16 to 19 Years | 0 (0.0%) | 0 (0.0%) |
| 20 to 24 Years | 14 (100.0%) | 0 (0.0%) |
| 25 to 29 Years | 9 (100.0%) | 0 (0.0%) |
| 30 to 34 Years | 0 (0.0%) | 0 (0.0%) |
| 35 to 44 Years | 17 (89.5%) | 0 (0.0%) |
| 45 to 54 Years | 32 (100.0%) | 0 (0.0%) |
| 55 to 59 Years | 23 (92.0%) | 0 (0.0%) |
| 60 to 64 Years | 30 (54.5%) | 1 (3.3%) |
| 65 to 74 Years | 22 (20.4%) | 3 (13.6%) |
| 75 Years and over | 12 (16.9%) | 0 (0.0%) |
| Total | 159 (46.2%) | 4 (2.5%) |
Employment Status by Educational Attainment in Horton Bay
According to labor force statistics for Horton Bay, 79.3% of individuals (111) out of the total population between 25 and 64 years of age (140) are in the labor force, with 0.9% or 1 of them being unemployed. The group with the highest labor force participation rate are those with the educational attainment of college / associate degree, with 90.2% or 55 individuals in the labor force. Within the labor force, individuals with college / associate degree education have the highest percentage of unemployment, with 1.8% or 1 of them being unemployed.
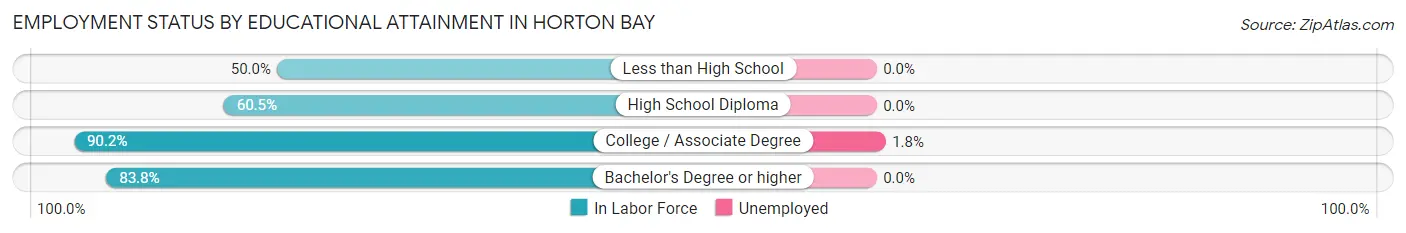
| Educational Attainment | In Labor Force | Unemployed |
| Less than High School | 2 (50.0%) | 0 (0.0%) |
| High School Diploma | 23 (60.5%) | 0 (0.0%) |
| College / Associate Degree | 55 (90.2%) | 1 (1.8%) |
| Bachelor's Degree or higher | 31 (83.8%) | 0 (0.0%) |
| Total | 111 (79.3%) | 1 (0.9%) |
Employment Occupations by Sex in Horton Bay
Management, Business, Science and Arts Occupations
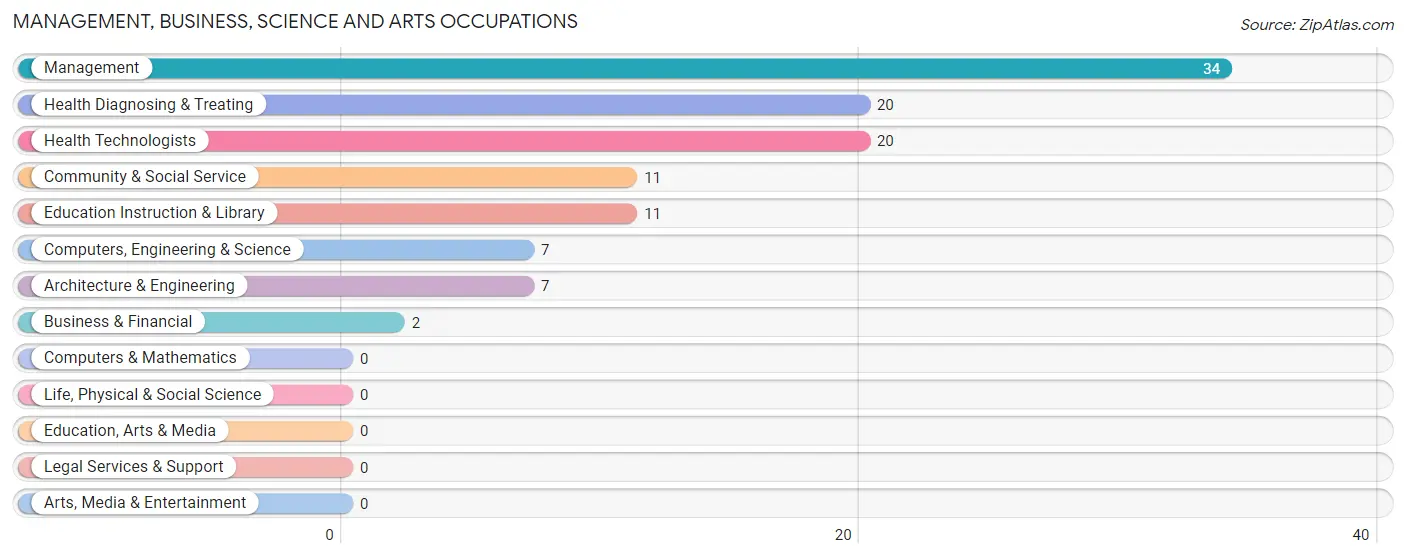
The most common Management, Business, Science and Arts occupations in Horton Bay are Management (34 | 21.9%), Health Diagnosing & Treating (20 | 12.9%), Health Technologists (20 | 12.9%), Community & Social Service (11 | 7.1%), and Education Instruction & Library (11 | 7.1%).
Management, Business, Science and Arts Occupations by Sex
Within the Management, Business, Science and Arts occupations in Horton Bay, the most male-oriented occupations are Computers, Engineering & Science (100.0%), Architecture & Engineering (100.0%), and Community & Social Service (100.0%), while the most female-oriented occupations are Business & Financial (100.0%), Health Diagnosing & Treating (100.0%), and Health Technologists (100.0%).
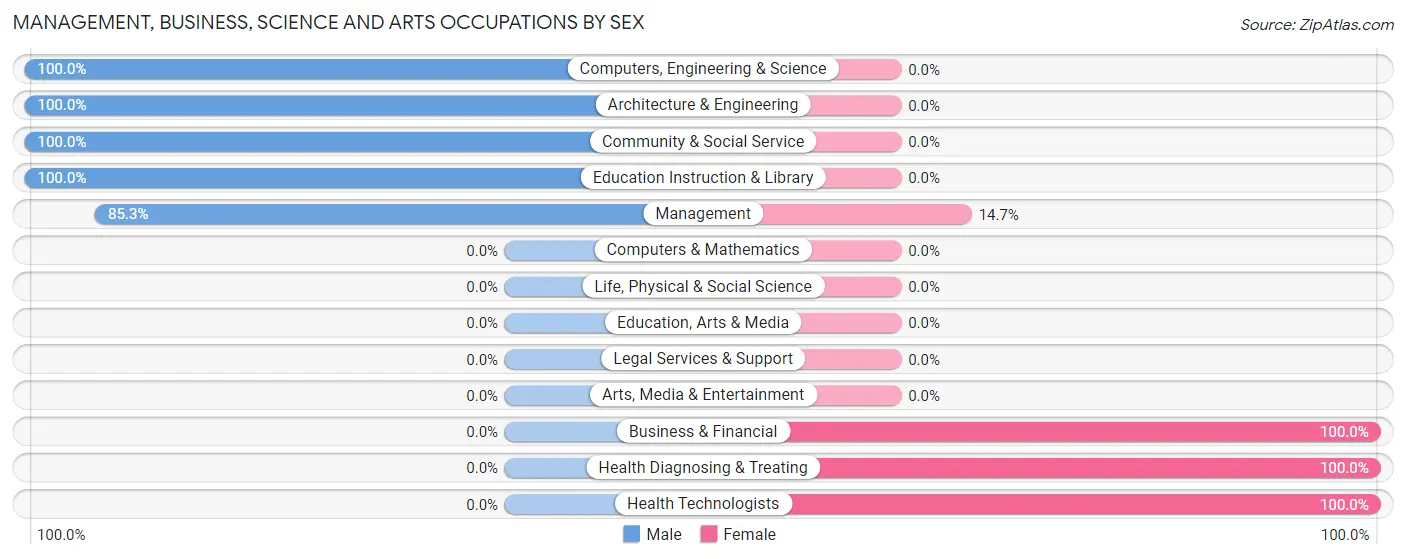
| Occupation | Male | Female |
| Management | 29 (85.3%) | 5 (14.7%) |
| Business & Financial | 0 (0.0%) | 2 (100.0%) |
| Computers, Engineering & Science | 7 (100.0%) | 0 (0.0%) |
| Computers & Mathematics | 0 (0.0%) | 0 (0.0%) |
| Architecture & Engineering | 7 (100.0%) | 0 (0.0%) |
| Life, Physical & Social Science | 0 (0.0%) | 0 (0.0%) |
| Community & Social Service | 11 (100.0%) | 0 (0.0%) |
| Education, Arts & Media | 0 (0.0%) | 0 (0.0%) |
| Legal Services & Support | 0 (0.0%) | 0 (0.0%) |
| Education Instruction & Library | 11 (100.0%) | 0 (0.0%) |
| Arts, Media & Entertainment | 0 (0.0%) | 0 (0.0%) |
| Health Diagnosing & Treating | 0 (0.0%) | 20 (100.0%) |
| Health Technologists | 0 (0.0%) | 20 (100.0%) |
| Total (Category) | 47 (63.5%) | 27 (36.5%) |
| Total (Overall) | 90 (58.1%) | 65 (41.9%) |
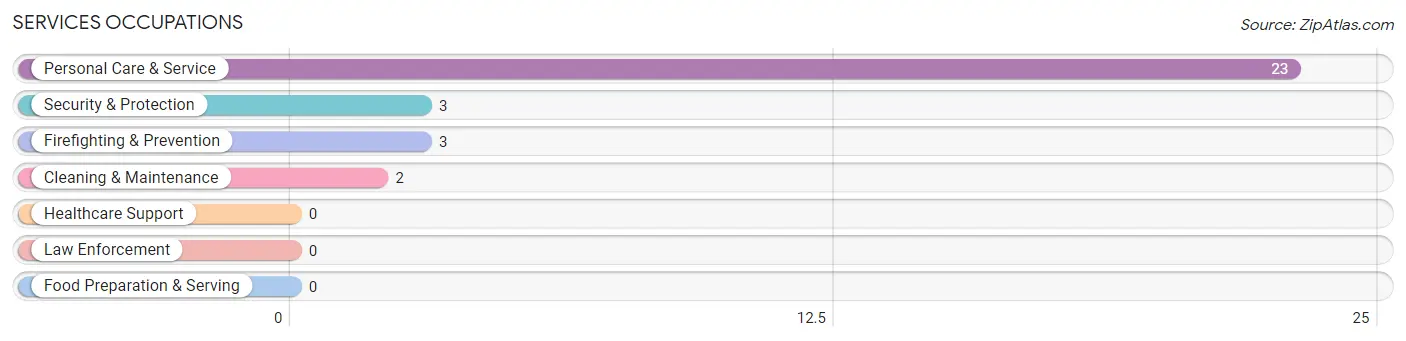
Services Occupations
The most common Services occupations in Horton Bay are Personal Care & Service (23 | 14.8%), Security & Protection (3 | 1.9%), Firefighting & Prevention (3 | 1.9%), and Cleaning & Maintenance (2 | 1.3%).
Services Occupations by Sex
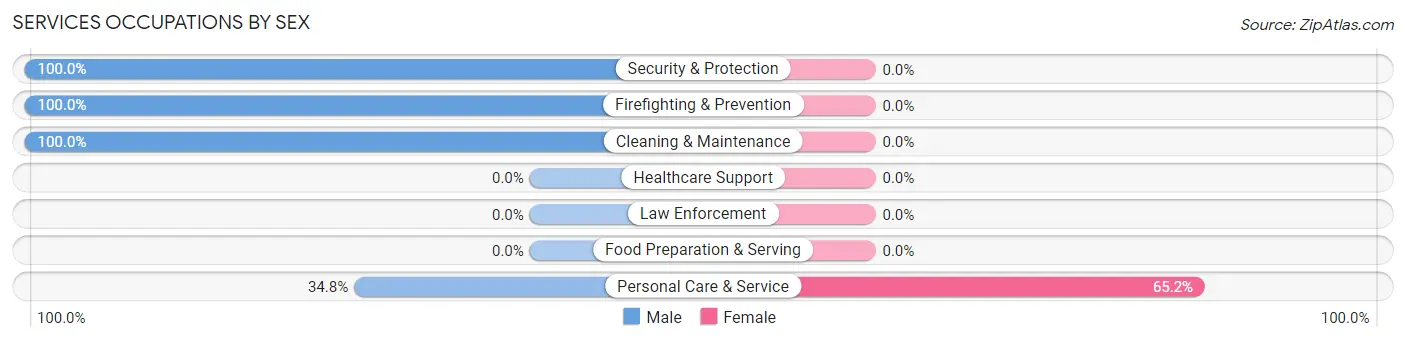
| Occupation | Male | Female |
| Healthcare Support | 0 (0.0%) | 0 (0.0%) |
| Security & Protection | 3 (100.0%) | 0 (0.0%) |
| Firefighting & Prevention | 3 (100.0%) | 0 (0.0%) |
| Law Enforcement | 0 (0.0%) | 0 (0.0%) |
| Food Preparation & Serving | 0 (0.0%) | 0 (0.0%) |
| Cleaning & Maintenance | 2 (100.0%) | 0 (0.0%) |
| Personal Care & Service | 8 (34.8%) | 15 (65.2%) |
| Total (Category) | 13 (46.4%) | 15 (53.6%) |
| Total (Overall) | 90 (58.1%) | 65 (41.9%) |
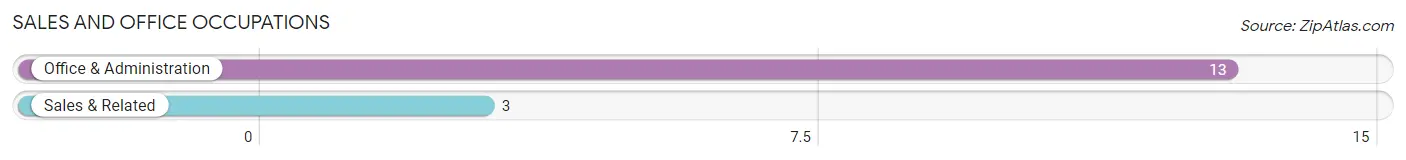
Sales and Office Occupations
The most common Sales and Office occupations in Horton Bay are Office & Administration (13 | 8.4%), and Sales & Related (3 | 1.9%).
Sales and Office Occupations by Sex
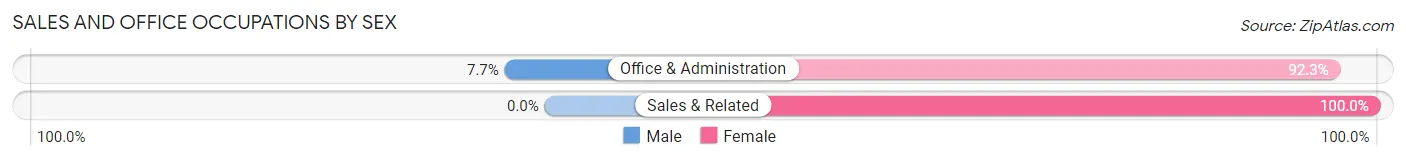
| Occupation | Male | Female |
| Sales & Related | 0 (0.0%) | 3 (100.0%) |
| Office & Administration | 1 (7.7%) | 12 (92.3%) |
| Total (Category) | 1 (6.2%) | 15 (93.8%) |
| Total (Overall) | 90 (58.1%) | 65 (41.9%) |
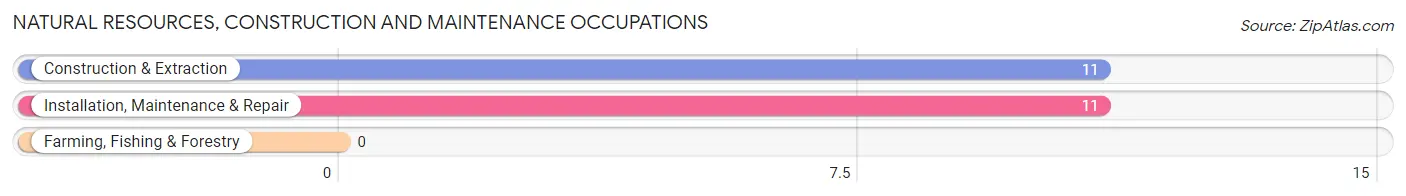
Natural Resources, Construction and Maintenance Occupations
The most common Natural Resources, Construction and Maintenance occupations in Horton Bay are Construction & Extraction (11 | 7.1%), and Installation, Maintenance & Repair (11 | 7.1%).
Natural Resources, Construction and Maintenance Occupations by Sex
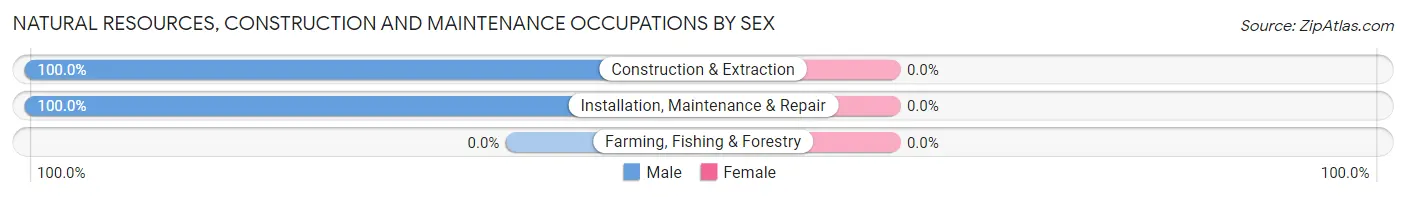
| Occupation | Male | Female |
| Farming, Fishing & Forestry | 0 (0.0%) | 0 (0.0%) |
| Construction & Extraction | 11 (100.0%) | 0 (0.0%) |
| Installation, Maintenance & Repair | 11 (100.0%) | 0 (0.0%) |
| Total (Category) | 22 (100.0%) | 0 (0.0%) |
| Total (Overall) | 90 (58.1%) | 65 (41.9%) |
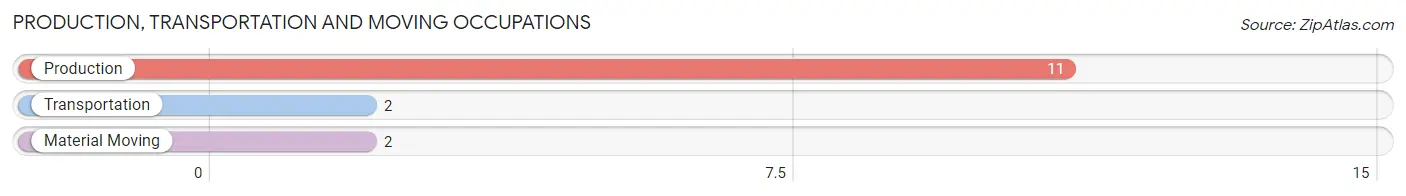
Production, Transportation and Moving Occupations
The most common Production, Transportation and Moving occupations in Horton Bay are Production (11 | 7.1%), Transportation (2 | 1.3%), and Material Moving (2 | 1.3%).
Production, Transportation and Moving Occupations by Sex
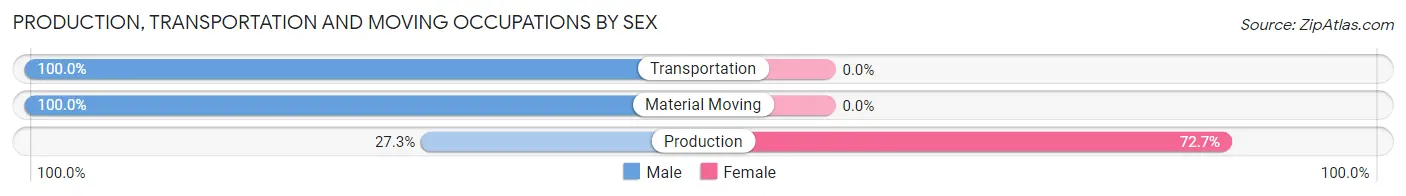
| Occupation | Male | Female |
| Production | 3 (27.3%) | 8 (72.7%) |
| Transportation | 2 (100.0%) | 0 (0.0%) |
| Material Moving | 2 (100.0%) | 0 (0.0%) |
| Total (Category) | 7 (46.7%) | 8 (53.3%) |
| Total (Overall) | 90 (58.1%) | 65 (41.9%) |
Employment Industries by Sex in Horton Bay
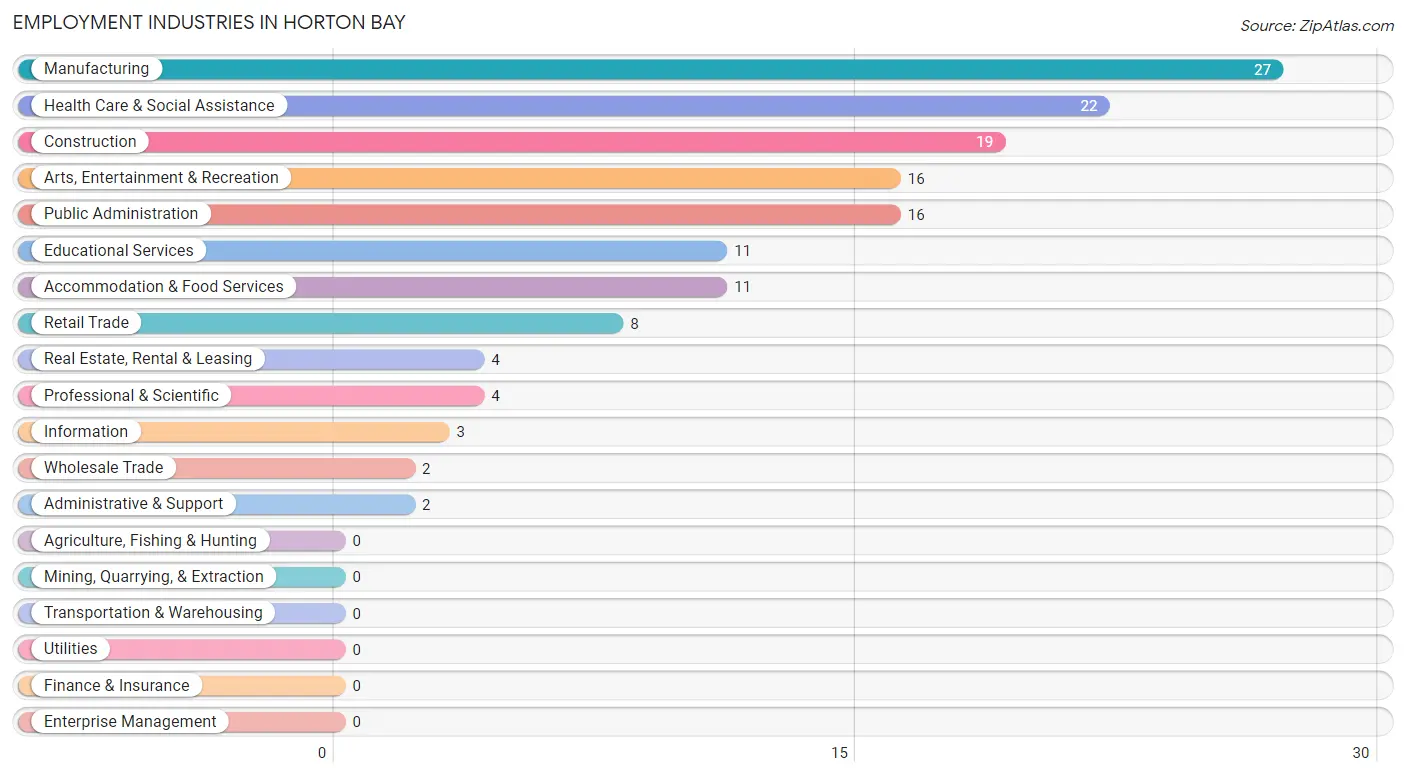
Employment Industries in Horton Bay
The major employment industries in Horton Bay include Manufacturing (27 | 17.4%), Health Care & Social Assistance (22 | 14.2%), Construction (19 | 12.3%), Arts, Entertainment & Recreation (16 | 10.3%), and Public Administration (16 | 10.3%).
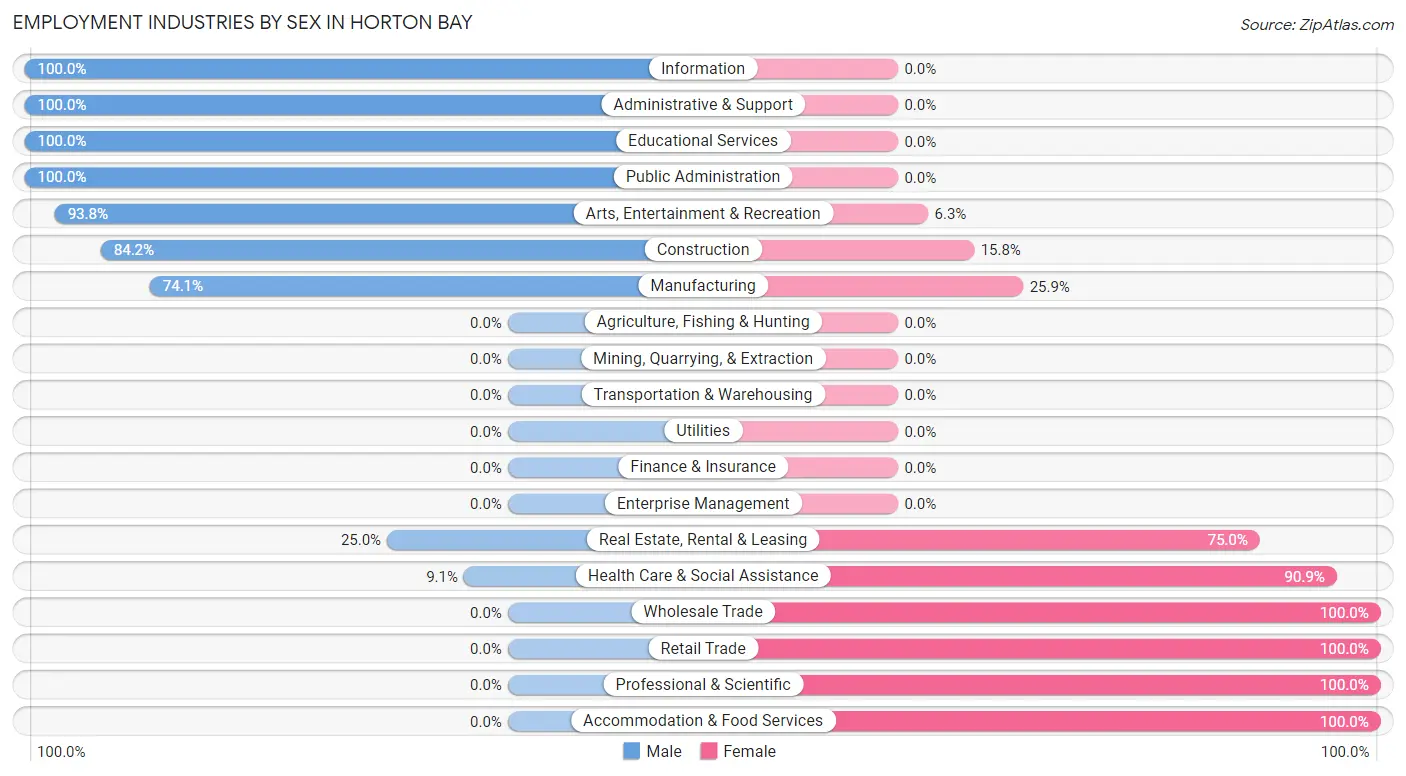
Employment Industries by Sex in Horton Bay
The Horton Bay industries that see more men than women are Information (100.0%), Administrative & Support (100.0%), and Educational Services (100.0%), whereas the industries that tend to have a higher number of women are Wholesale Trade (100.0%), Retail Trade (100.0%), and Professional & Scientific (100.0%).
| Industry | Male | Female |
| Agriculture, Fishing & Hunting | 0 (0.0%) | 0 (0.0%) |
| Mining, Quarrying, & Extraction | 0 (0.0%) | 0 (0.0%) |
| Construction | 16 (84.2%) | 3 (15.8%) |
| Manufacturing | 20 (74.1%) | 7 (25.9%) |
| Wholesale Trade | 0 (0.0%) | 2 (100.0%) |
| Retail Trade | 0 (0.0%) | 8 (100.0%) |
| Transportation & Warehousing | 0 (0.0%) | 0 (0.0%) |
| Utilities | 0 (0.0%) | 0 (0.0%) |
| Information | 3 (100.0%) | 0 (0.0%) |
| Finance & Insurance | 0 (0.0%) | 0 (0.0%) |
| Real Estate, Rental & Leasing | 1 (25.0%) | 3 (75.0%) |
| Professional & Scientific | 0 (0.0%) | 4 (100.0%) |
| Enterprise Management | 0 (0.0%) | 0 (0.0%) |
| Administrative & Support | 2 (100.0%) | 0 (0.0%) |
| Educational Services | 11 (100.0%) | 0 (0.0%) |
| Health Care & Social Assistance | 2 (9.1%) | 20 (90.9%) |
| Arts, Entertainment & Recreation | 15 (93.8%) | 1 (6.2%) |
| Accommodation & Food Services | 0 (0.0%) | 11 (100.0%) |
| Public Administration | 16 (100.0%) | 0 (0.0%) |
| Total | 90 (58.1%) | 65 (41.9%) |
Education in Horton Bay
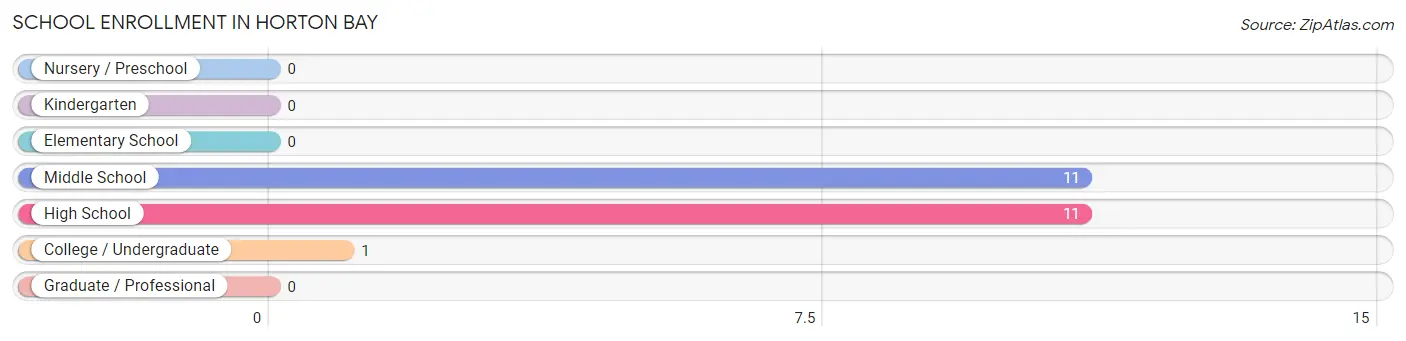
School Enrollment in Horton Bay
The most common levels of schooling among the 23 students in Horton Bay are middle school (11 | 47.8%), high school (11 | 47.8%), and college / undergraduate (1 | 4.3%).
| School Level | # Students | % Students |
| Nursery / Preschool | 0 | 0.0% |
| Kindergarten | 0 | 0.0% |
| Elementary School | 0 | 0.0% |
| Middle School | 11 | 47.8% |
| High School | 11 | 47.8% |
| College / Undergraduate | 1 | 4.3% |
| Graduate / Professional | 0 | 0.0% |
| Total | 23 | 100.0% |
School Enrollment by Age by Funding Source in Horton Bay
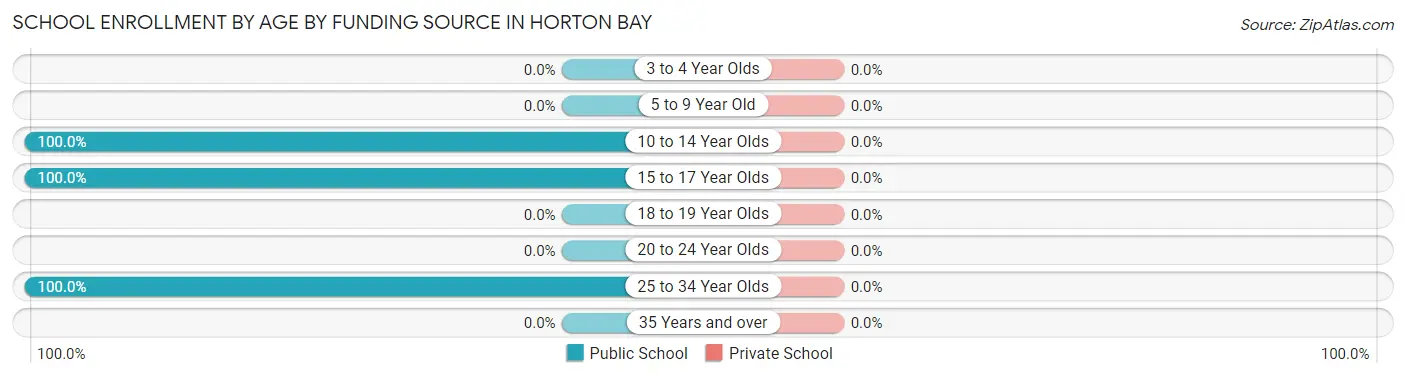
| Age Bracket | Public School | Private School |
| 3 to 4 Year Olds | 0 (0.0%) | 0 (0.0%) |
| 5 to 9 Year Old | 0 (0.0%) | 0 (0.0%) |
| 10 to 14 Year Olds | 11 (100.0%) | 0 (0.0%) |
| 15 to 17 Year Olds | 11 (100.0%) | 0 (0.0%) |
| 18 to 19 Year Olds | 0 (0.0%) | 0 (0.0%) |
| 20 to 24 Year Olds | 0 (0.0%) | 0 (0.0%) |
| 25 to 34 Year Olds | 1 (100.0%) | 0 (0.0%) |
| 35 Years and over | 0 (0.0%) | 0 (0.0%) |
| Total | 23 (100.0%) | 0 (0.0%) |
Educational Attainment by Field of Study in Horton Bay
Education (34 | 27.2%), science & technology (30 | 24.0%), business (20 | 16.0%), arts & humanities (13 | 10.4%), and computers & mathematics (8 | 6.4%) are the most common fields of study among 125 individuals in Horton Bay who have obtained a bachelor's degree or higher.
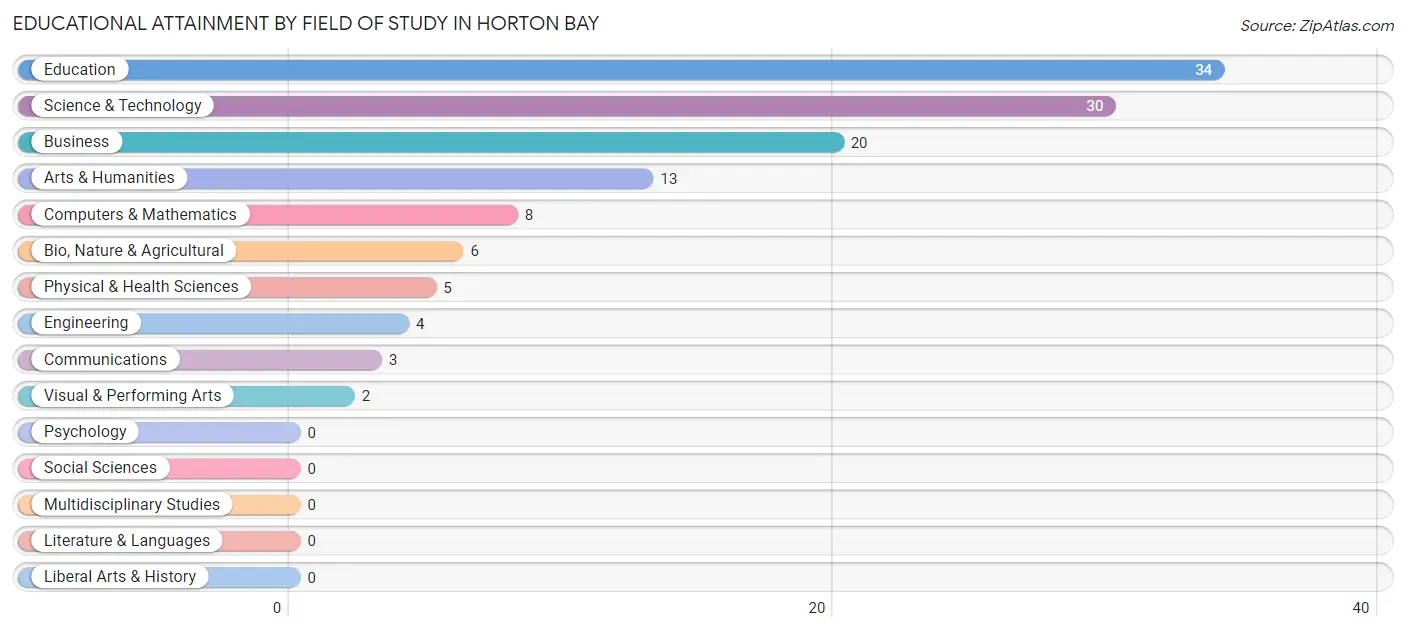
| Field of Study | # Graduates | % Graduates |
| Computers & Mathematics | 8 | 6.4% |
| Bio, Nature & Agricultural | 6 | 4.8% |
| Physical & Health Sciences | 5 | 4.0% |
| Psychology | 0 | 0.0% |
| Social Sciences | 0 | 0.0% |
| Engineering | 4 | 3.2% |
| Multidisciplinary Studies | 0 | 0.0% |
| Science & Technology | 30 | 24.0% |
| Business | 20 | 16.0% |
| Education | 34 | 27.2% |
| Literature & Languages | 0 | 0.0% |
| Liberal Arts & History | 0 | 0.0% |
| Visual & Performing Arts | 2 | 1.6% |
| Communications | 3 | 2.4% |
| Arts & Humanities | 13 | 10.4% |
| Total | 125 | 100.0% |
Transportation & Commute in Horton Bay
Vehicle Availability by Sex in Horton Bay
The most prevalent vehicle ownership categories in Horton Bay are males with 3 vehicles (44, accounting for 53.0%) and females with 3 vehicles (20, making up 67.7%).
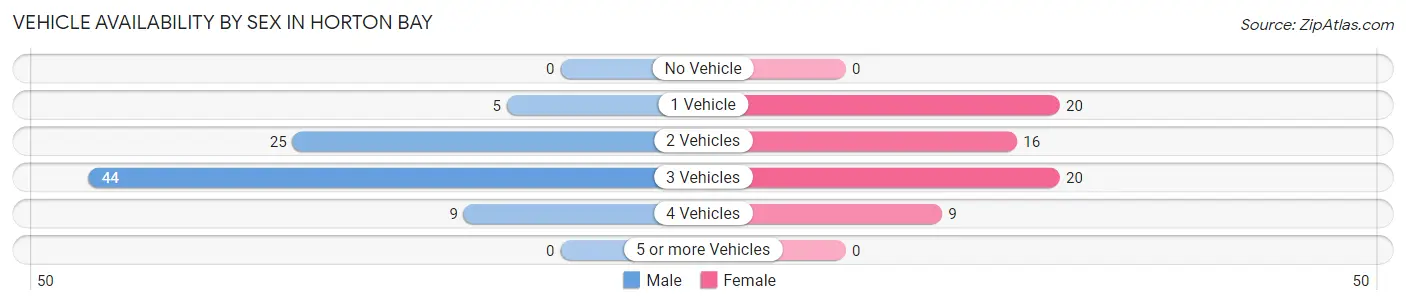
| Vehicles Available | Male | Female |
| No Vehicle | 0 (0.0%) | 0 (0.0%) |
| 1 Vehicle | 5 (6.0%) | 20 (30.8%) |
| 2 Vehicles | 25 (30.1%) | 16 (24.6%) |
| 3 Vehicles | 44 (53.0%) | 20 (30.8%) |
| 4 Vehicles | 9 (10.8%) | 9 (13.9%) |
| 5 or more Vehicles | 0 (0.0%) | 0 (0.0%) |
| Total | 83 (100.0%) | 65 (100.0%) |
Commute Time in Horton Bay
The most frequently occuring commute durations in Horton Bay are 20 to 24 minutes (51 commuters, 40.5%), 15 to 19 minutes (30 commuters, 23.8%), and 10 to 14 minutes (22 commuters, 17.5%).
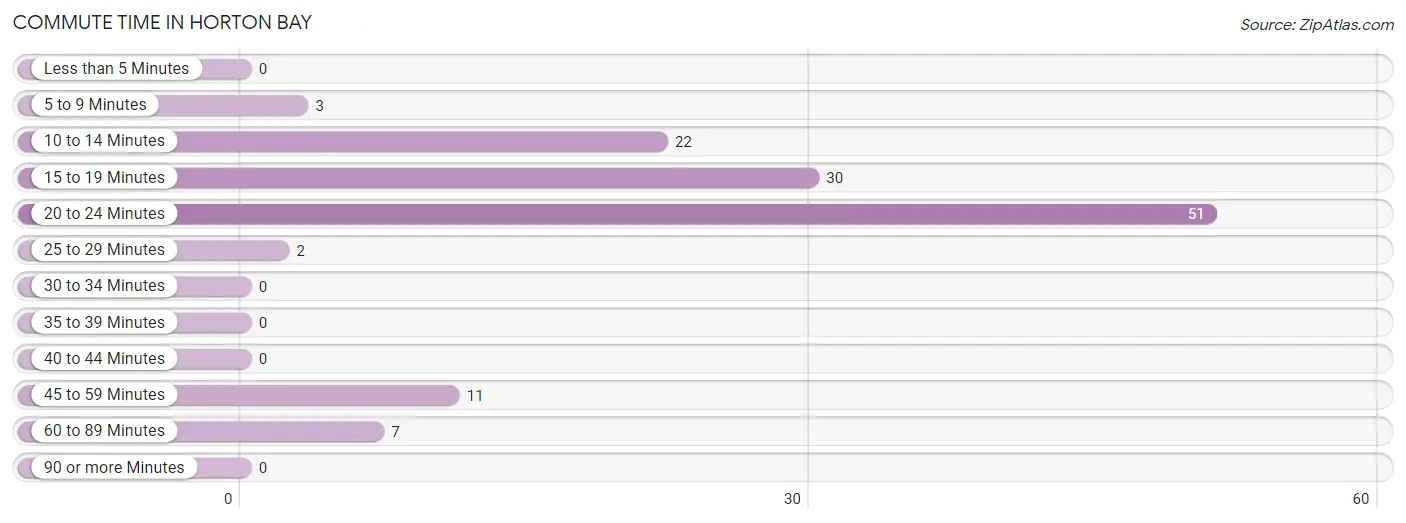
| Commute Time | # Commuters | % Commuters |
| Less than 5 Minutes | 0 | 0.0% |
| 5 to 9 Minutes | 3 | 2.4% |
| 10 to 14 Minutes | 22 | 17.5% |
| 15 to 19 Minutes | 30 | 23.8% |
| 20 to 24 Minutes | 51 | 40.5% |
| 25 to 29 Minutes | 2 | 1.6% |
| 30 to 34 Minutes | 0 | 0.0% |
| 35 to 39 Minutes | 0 | 0.0% |
| 40 to 44 Minutes | 0 | 0.0% |
| 45 to 59 Minutes | 11 | 8.7% |
| 60 to 89 Minutes | 7 | 5.6% |
| 90 or more Minutes | 0 | 0.0% |
Commute Time by Sex in Horton Bay
The most common commute times in Horton Bay are 20 to 24 minutes (24 commuters, 33.3%) for males and 20 to 24 minutes (27 commuters, 50.0%) for females.
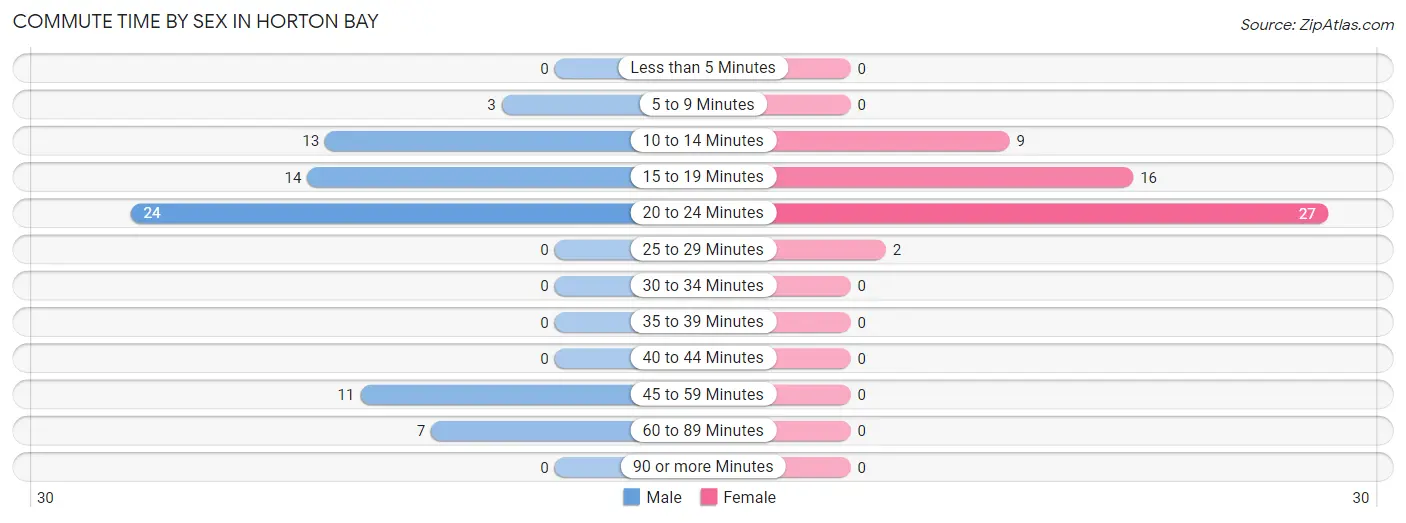
| Commute Time | Male | Female |
| Less than 5 Minutes | 0 (0.0%) | 0 (0.0%) |
| 5 to 9 Minutes | 3 (4.2%) | 0 (0.0%) |
| 10 to 14 Minutes | 13 (18.1%) | 9 (16.7%) |
| 15 to 19 Minutes | 14 (19.4%) | 16 (29.6%) |
| 20 to 24 Minutes | 24 (33.3%) | 27 (50.0%) |
| 25 to 29 Minutes | 0 (0.0%) | 2 (3.7%) |
| 30 to 34 Minutes | 0 (0.0%) | 0 (0.0%) |
| 35 to 39 Minutes | 0 (0.0%) | 0 (0.0%) |
| 40 to 44 Minutes | 0 (0.0%) | 0 (0.0%) |
| 45 to 59 Minutes | 11 (15.3%) | 0 (0.0%) |
| 60 to 89 Minutes | 7 (9.7%) | 0 (0.0%) |
| 90 or more Minutes | 0 (0.0%) | 0 (0.0%) |
Time of Departure to Work by Sex in Horton Bay
The most frequent times of departure to work in Horton Bay are 6:00 AM to 6:29 AM (26, 36.1%) for males and 9:00 AM to 9:59 AM (13, 24.1%) for females.
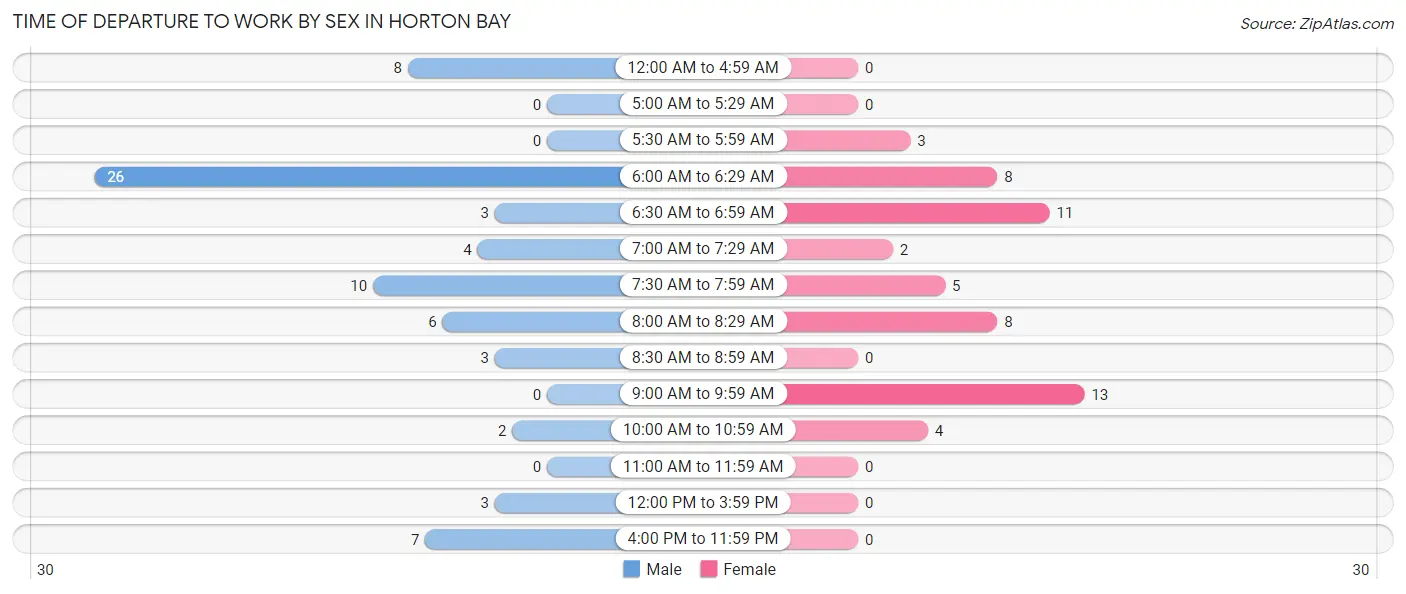
| Time of Departure | Male | Female |
| 12:00 AM to 4:59 AM | 8 (11.1%) | 0 (0.0%) |
| 5:00 AM to 5:29 AM | 0 (0.0%) | 0 (0.0%) |
| 5:30 AM to 5:59 AM | 0 (0.0%) | 3 (5.6%) |
| 6:00 AM to 6:29 AM | 26 (36.1%) | 8 (14.8%) |
| 6:30 AM to 6:59 AM | 3 (4.2%) | 11 (20.4%) |
| 7:00 AM to 7:29 AM | 4 (5.6%) | 2 (3.7%) |
| 7:30 AM to 7:59 AM | 10 (13.9%) | 5 (9.3%) |
| 8:00 AM to 8:29 AM | 6 (8.3%) | 8 (14.8%) |
| 8:30 AM to 8:59 AM | 3 (4.2%) | 0 (0.0%) |
| 9:00 AM to 9:59 AM | 0 (0.0%) | 13 (24.1%) |
| 10:00 AM to 10:59 AM | 2 (2.8%) | 4 (7.4%) |
| 11:00 AM to 11:59 AM | 0 (0.0%) | 0 (0.0%) |
| 12:00 PM to 3:59 PM | 3 (4.2%) | 0 (0.0%) |
| 4:00 PM to 11:59 PM | 7 (9.7%) | 0 (0.0%) |
| Total | 72 (100.0%) | 54 (100.0%) |
Housing Occupancy in Horton Bay
Occupancy by Ownership in Horton Bay
Of the total 204 dwellings in Horton Bay, owner-occupied units account for 190 (93.1%), while renter-occupied units make up 14 (6.9%).
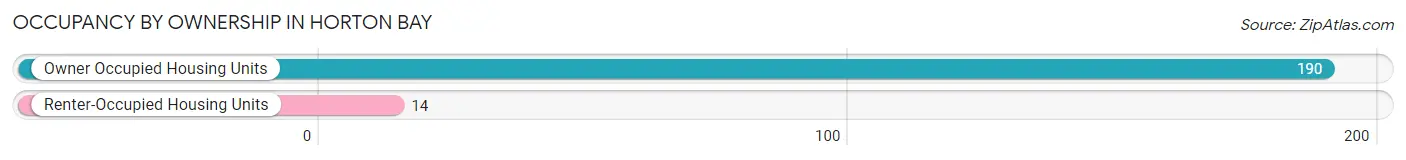
| Occupancy | # Housing Units | % Housing Units |
| Owner Occupied Housing Units | 190 | 93.1% |
| Renter-Occupied Housing Units | 14 | 6.9% |
| Total Occupied Housing Units | 204 | 100.0% |
Occupancy by Household Size in Horton Bay
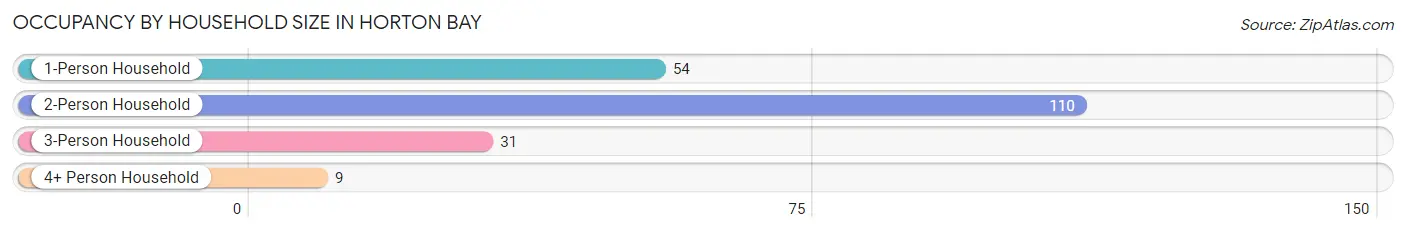
| Household Size | # Housing Units | % Housing Units |
| 1-Person Household | 54 | 26.5% |
| 2-Person Household | 110 | 53.9% |
| 3-Person Household | 31 | 15.2% |
| 4+ Person Household | 9 | 4.4% |
| Total Housing Units | 204 | 100.0% |
Occupancy by Ownership by Household Size in Horton Bay
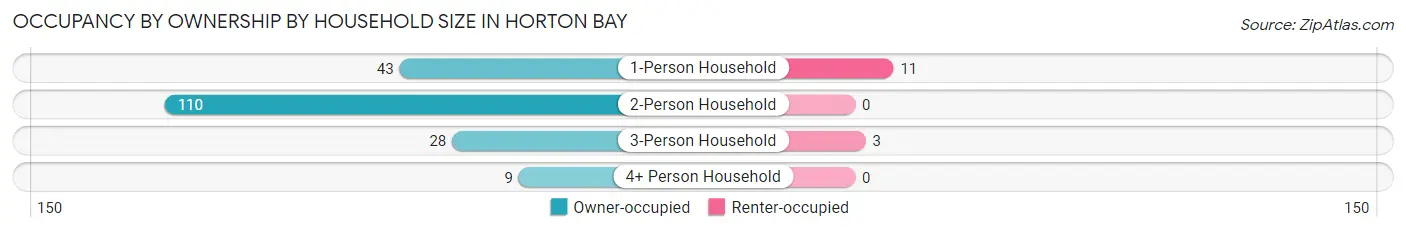
| Household Size | Owner-occupied | Renter-occupied |
| 1-Person Household | 43 (79.6%) | 11 (20.4%) |
| 2-Person Household | 110 (100.0%) | 0 (0.0%) |
| 3-Person Household | 28 (90.3%) | 3 (9.7%) |
| 4+ Person Household | 9 (100.0%) | 0 (0.0%) |
| Total Housing Units | 190 (93.1%) | 14 (6.9%) |
Occupancy by Educational Attainment in Horton Bay
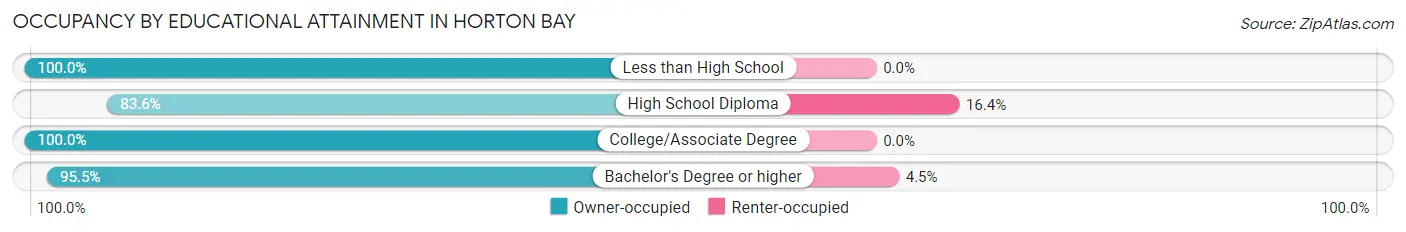
| Household Size | Owner-occupied | Renter-occupied |
| Less than High School | 5 (100.0%) | 0 (0.0%) |
| High School Diploma | 56 (83.6%) | 11 (16.4%) |
| College/Associate Degree | 65 (100.0%) | 0 (0.0%) |
| Bachelor's Degree or higher | 64 (95.5%) | 3 (4.5%) |
Occupancy by Age of Householder in Horton Bay
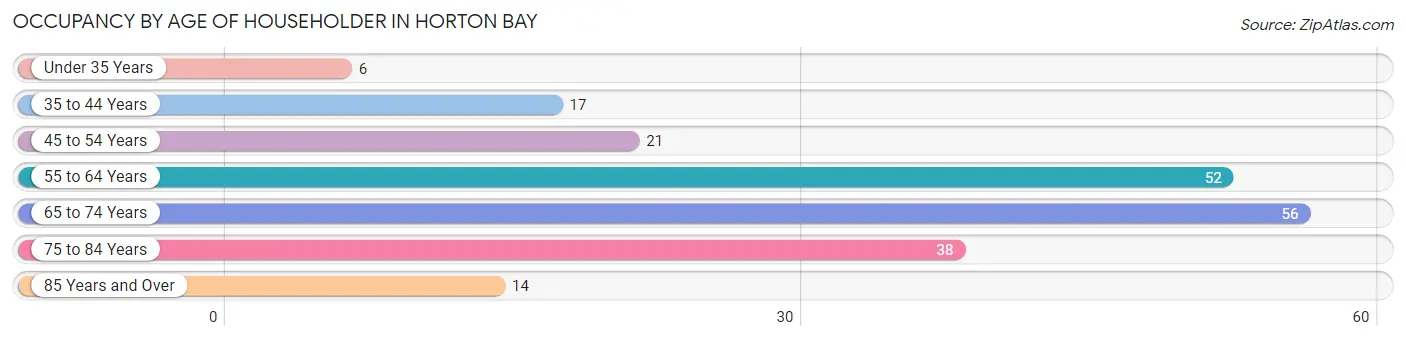
| Age Bracket | # Households | % Households |
| Under 35 Years | 6 | 2.9% |
| 35 to 44 Years | 17 | 8.3% |
| 45 to 54 Years | 21 | 10.3% |
| 55 to 64 Years | 52 | 25.5% |
| 65 to 74 Years | 56 | 27.5% |
| 75 to 84 Years | 38 | 18.6% |
| 85 Years and Over | 14 | 6.9% |
| Total | 204 | 100.0% |
Housing Finances in Horton Bay
Median Income by Occupancy in Horton Bay
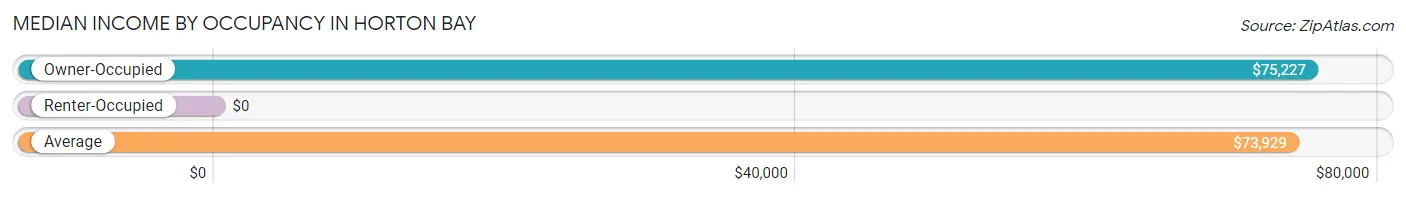
| Occupancy Type | # Households | Median Income |
| Owner-Occupied | 190 (93.1%) | $75,227 |
| Renter-Occupied | 14 (6.9%) | $0 |
| Average | 204 (100.0%) | $73,929 |
Occupancy by Householder Income Bracket in Horton Bay
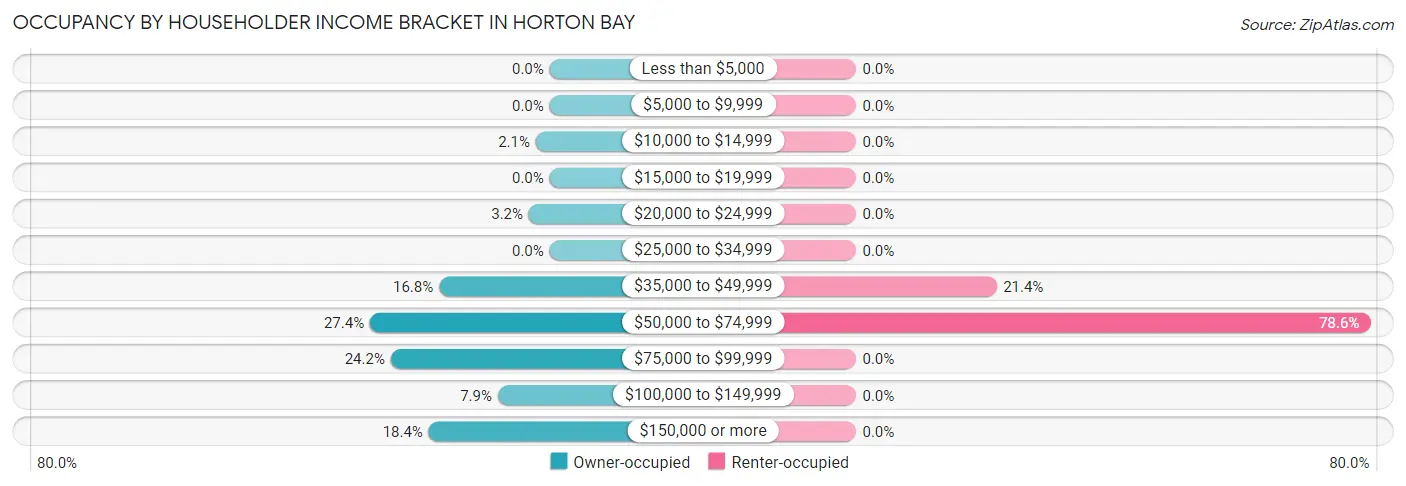
| Income Bracket | Owner-occupied | Renter-occupied |
| Less than $5,000 | 0 (0.0%) | 0 (0.0%) |
| $5,000 to $9,999 | 0 (0.0%) | 0 (0.0%) |
| $10,000 to $14,999 | 4 (2.1%) | 0 (0.0%) |
| $15,000 to $19,999 | 0 (0.0%) | 0 (0.0%) |
| $20,000 to $24,999 | 6 (3.2%) | 0 (0.0%) |
| $25,000 to $34,999 | 0 (0.0%) | 0 (0.0%) |
| $35,000 to $49,999 | 32 (16.8%) | 3 (21.4%) |
| $50,000 to $74,999 | 52 (27.4%) | 11 (78.6%) |
| $75,000 to $99,999 | 46 (24.2%) | 0 (0.0%) |
| $100,000 to $149,999 | 15 (7.9%) | 0 (0.0%) |
| $150,000 or more | 35 (18.4%) | 0 (0.0%) |
| Total | 190 (100.0%) | 14 (100.0%) |
Monthly Housing Cost Tiers in Horton Bay
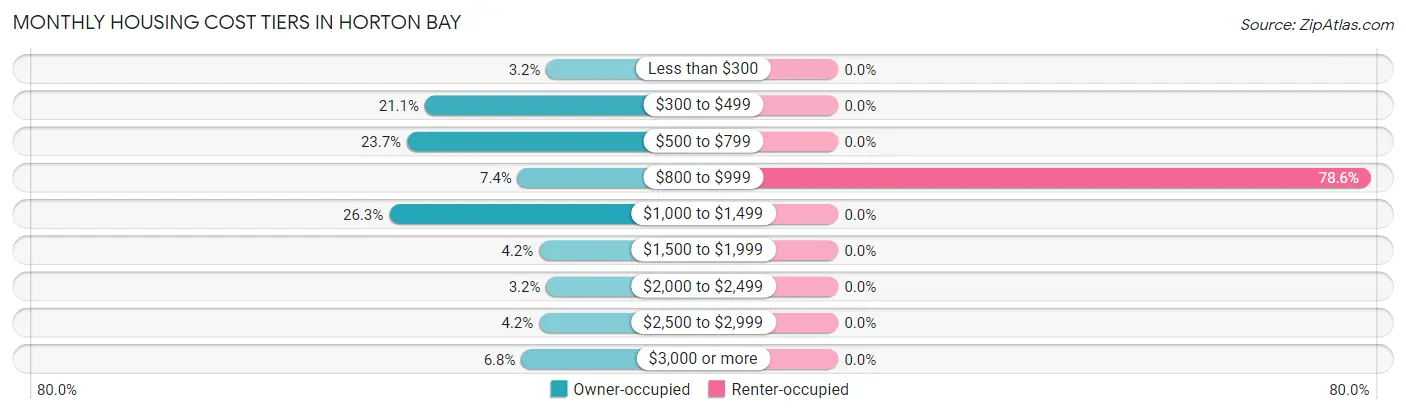
| Monthly Cost | Owner-occupied | Renter-occupied |
| Less than $300 | 6 (3.2%) | 0 (0.0%) |
| $300 to $499 | 40 (21.0%) | 0 (0.0%) |
| $500 to $799 | 45 (23.7%) | 0 (0.0%) |
| $800 to $999 | 14 (7.4%) | 11 (78.6%) |
| $1,000 to $1,499 | 50 (26.3%) | 0 (0.0%) |
| $1,500 to $1,999 | 8 (4.2%) | 0 (0.0%) |
| $2,000 to $2,499 | 6 (3.2%) | 0 (0.0%) |
| $2,500 to $2,999 | 8 (4.2%) | 0 (0.0%) |
| $3,000 or more | 13 (6.8%) | 0 (0.0%) |
| Total | 190 (100.0%) | 14 (100.0%) |
Physical Housing Characteristics in Horton Bay
Housing Structures in Horton Bay
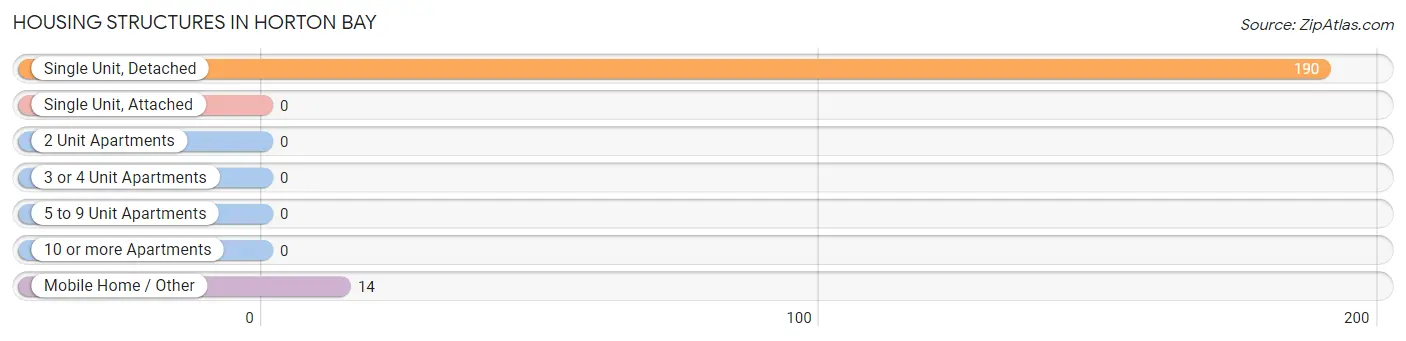
| Structure Type | # Housing Units | % Housing Units |
| Single Unit, Detached | 190 | 93.1% |
| Single Unit, Attached | 0 | 0.0% |
| 2 Unit Apartments | 0 | 0.0% |
| 3 or 4 Unit Apartments | 0 | 0.0% |
| 5 to 9 Unit Apartments | 0 | 0.0% |
| 10 or more Apartments | 0 | 0.0% |
| Mobile Home / Other | 14 | 6.9% |
| Total | 204 | 100.0% |
Housing Structures by Occupancy in Horton Bay
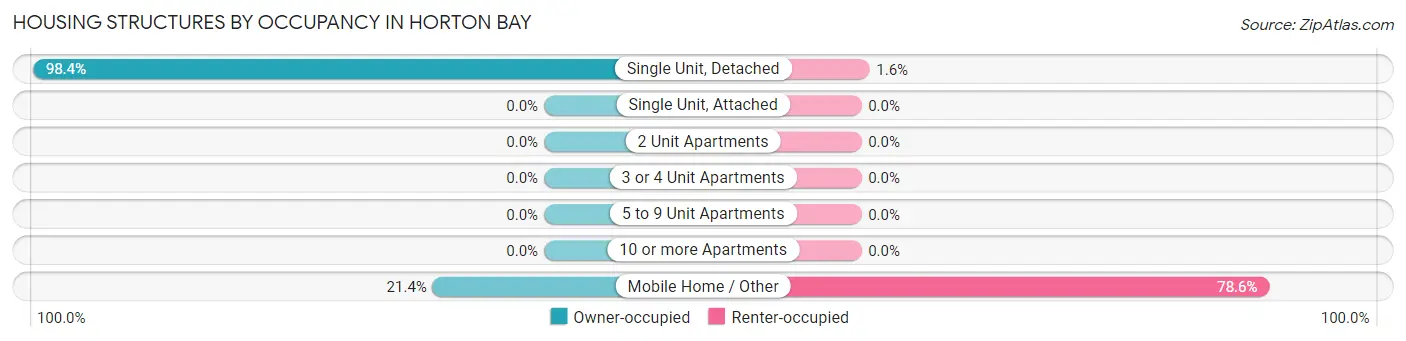
| Structure Type | Owner-occupied | Renter-occupied |
| Single Unit, Detached | 187 (98.4%) | 3 (1.6%) |
| Single Unit, Attached | 0 (0.0%) | 0 (0.0%) |
| 2 Unit Apartments | 0 (0.0%) | 0 (0.0%) |
| 3 or 4 Unit Apartments | 0 (0.0%) | 0 (0.0%) |
| 5 to 9 Unit Apartments | 0 (0.0%) | 0 (0.0%) |
| 10 or more Apartments | 0 (0.0%) | 0 (0.0%) |
| Mobile Home / Other | 3 (21.4%) | 11 (78.6%) |
| Total | 190 (93.1%) | 14 (6.9%) |
Housing Structures by Number of Rooms in Horton Bay
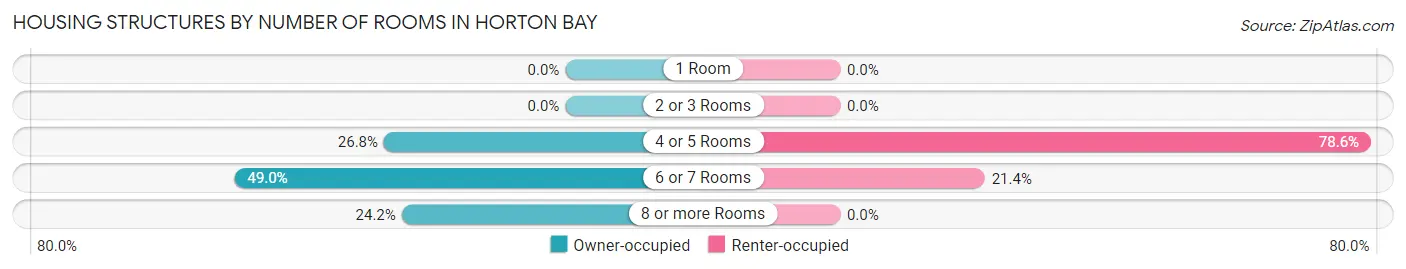
| Number of Rooms | Owner-occupied | Renter-occupied |
| 1 Room | 0 (0.0%) | 0 (0.0%) |
| 2 or 3 Rooms | 0 (0.0%) | 0 (0.0%) |
| 4 or 5 Rooms | 51 (26.8%) | 11 (78.6%) |
| 6 or 7 Rooms | 93 (48.9%) | 3 (21.4%) |
| 8 or more Rooms | 46 (24.2%) | 0 (0.0%) |
| Total | 190 (100.0%) | 14 (100.0%) |
Housing Structure by Heating Type in Horton Bay
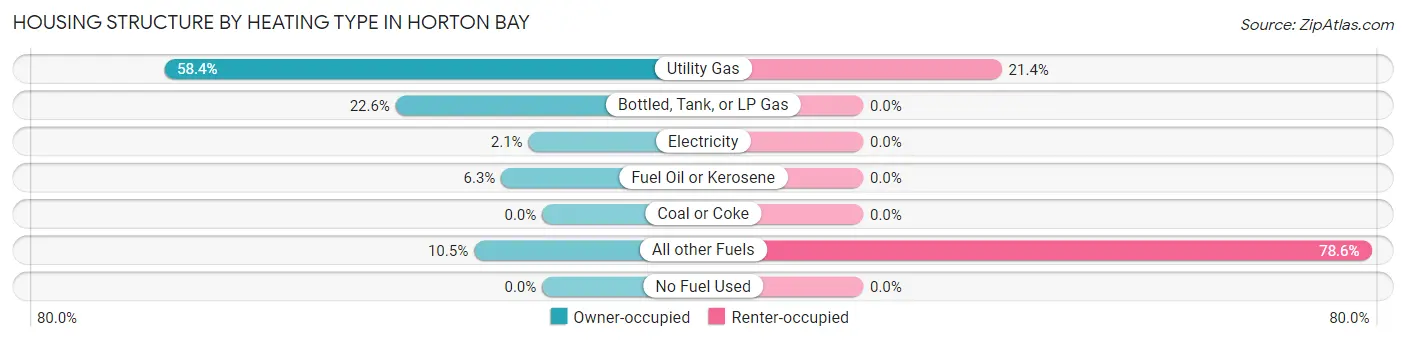
| Heating Type | Owner-occupied | Renter-occupied |
| Utility Gas | 111 (58.4%) | 3 (21.4%) |
| Bottled, Tank, or LP Gas | 43 (22.6%) | 0 (0.0%) |
| Electricity | 4 (2.1%) | 0 (0.0%) |
| Fuel Oil or Kerosene | 12 (6.3%) | 0 (0.0%) |
| Coal or Coke | 0 (0.0%) | 0 (0.0%) |
| All other Fuels | 20 (10.5%) | 11 (78.6%) |
| No Fuel Used | 0 (0.0%) | 0 (0.0%) |
| Total | 190 (100.0%) | 14 (100.0%) |
Household Vehicle Usage in Horton Bay
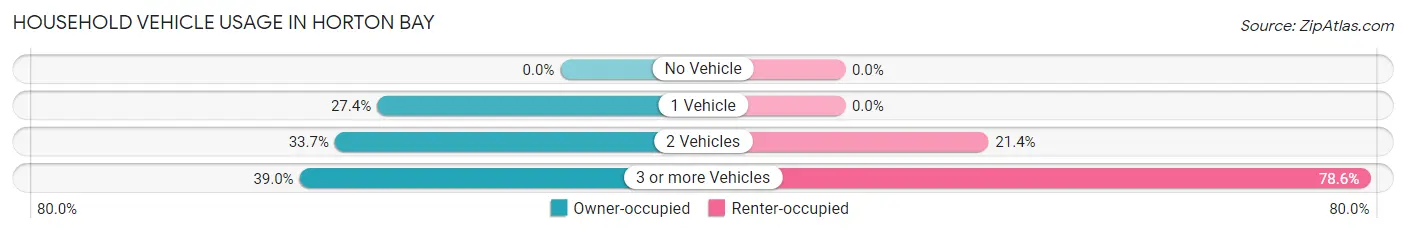
| Vehicles per Household | Owner-occupied | Renter-occupied |
| No Vehicle | 0 (0.0%) | 0 (0.0%) |
| 1 Vehicle | 52 (27.4%) | 0 (0.0%) |
| 2 Vehicles | 64 (33.7%) | 3 (21.4%) |
| 3 or more Vehicles | 74 (39.0%) | 11 (78.6%) |
| Total | 190 (100.0%) | 14 (100.0%) |
Real Estate & Mortgages in Horton Bay
Real Estate and Mortgage Overview in Horton Bay
| Characteristic | Without Mortgage | With Mortgage |
| Housing Units | 97 | 93 |
| Median Property Value | $275,000 | $303,600 |
| Median Household Income | $75,795 | $28 |
| Monthly Housing Costs | $528 | $13 |
| Real Estate Taxes | $2,150 | $4 |
Property Value by Mortgage Status in Horton Bay
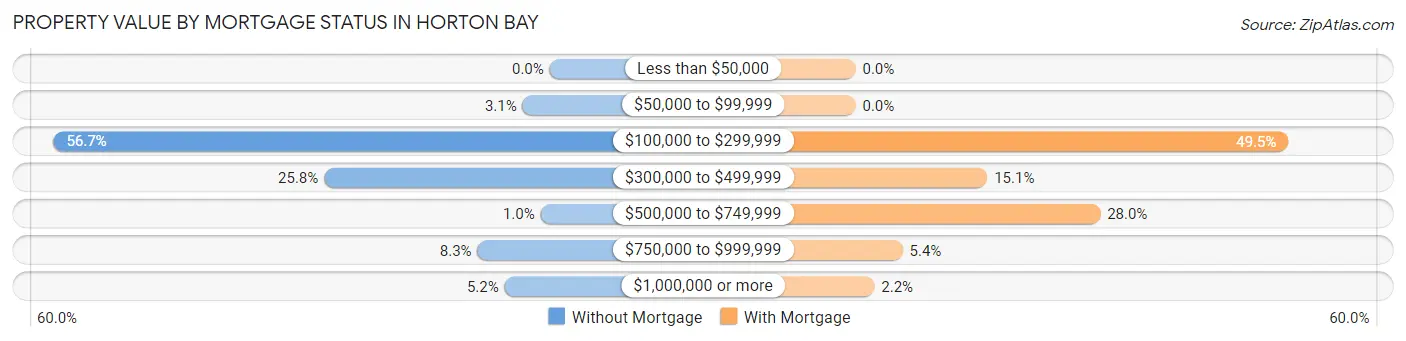
| Property Value | Without Mortgage | With Mortgage |
| Less than $50,000 | 0 (0.0%) | 0 (0.0%) |
| $50,000 to $99,999 | 3 (3.1%) | 0 (0.0%) |
| $100,000 to $299,999 | 55 (56.7%) | 46 (49.5%) |
| $300,000 to $499,999 | 25 (25.8%) | 14 (15.0%) |
| $500,000 to $749,999 | 1 (1.0%) | 26 (28.0%) |
| $750,000 to $999,999 | 8 (8.3%) | 5 (5.4%) |
| $1,000,000 or more | 5 (5.1%) | 2 (2.1%) |
| Total | 97 (100.0%) | 93 (100.0%) |
Household Income by Mortgage Status in Horton Bay
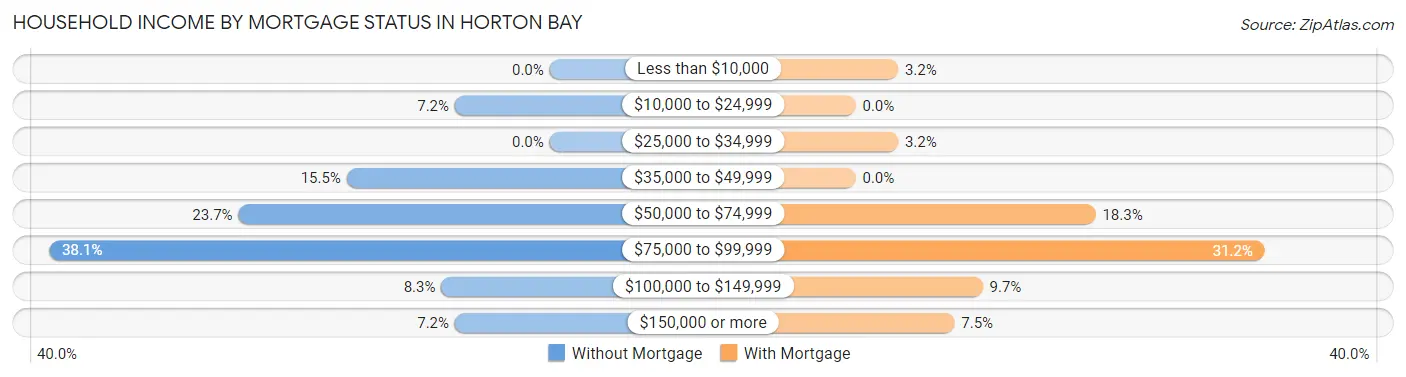
| Household Income | Without Mortgage | With Mortgage |
| Less than $10,000 | 0 (0.0%) | 3 (3.2%) |
| $10,000 to $24,999 | 7 (7.2%) | 0 (0.0%) |
| $25,000 to $34,999 | 0 (0.0%) | 3 (3.2%) |
| $35,000 to $49,999 | 15 (15.5%) | 0 (0.0%) |
| $50,000 to $74,999 | 23 (23.7%) | 17 (18.3%) |
| $75,000 to $99,999 | 37 (38.1%) | 29 (31.2%) |
| $100,000 to $149,999 | 8 (8.3%) | 9 (9.7%) |
| $150,000 or more | 7 (7.2%) | 7 (7.5%) |
| Total | 97 (100.0%) | 93 (100.0%) |
Property Value to Household Income Ratio in Horton Bay
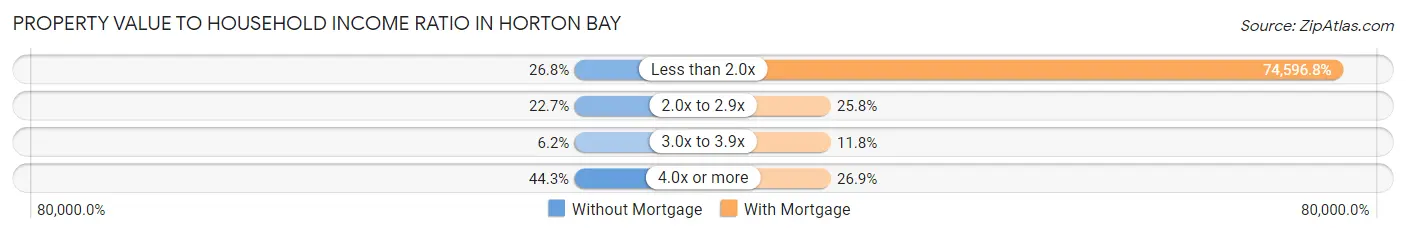
| Value-to-Income Ratio | Without Mortgage | With Mortgage |
| Less than 2.0x | 26 (26.8%) | 69,375 (74,596.8%) |
| 2.0x to 2.9x | 22 (22.7%) | 24 (25.8%) |
| 3.0x to 3.9x | 6 (6.2%) | 11 (11.8%) |
| 4.0x or more | 43 (44.3%) | 25 (26.9%) |
| Total | 97 (100.0%) | 93 (100.0%) |
Real Estate Taxes by Mortgage Status in Horton Bay
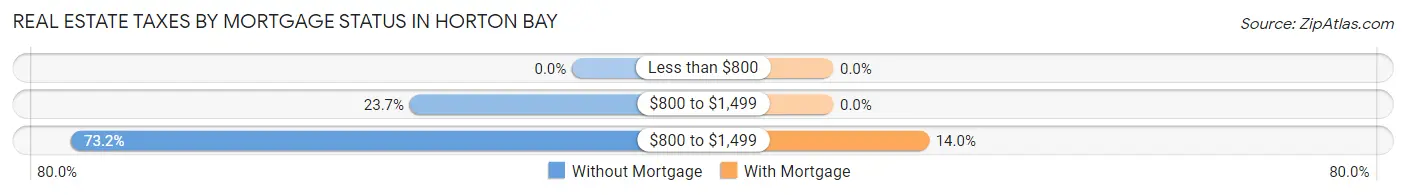
| Property Taxes | Without Mortgage | With Mortgage |
| Less than $800 | 0 (0.0%) | 0 (0.0%) |
| $800 to $1,499 | 23 (23.7%) | 0 (0.0%) |
| $800 to $1,499 | 71 (73.2%) | 13 (14.0%) |
| Total | 97 (100.0%) | 93 (100.0%) |
Health & Disability in Horton Bay
Health Insurance Coverage by Age in Horton Bay
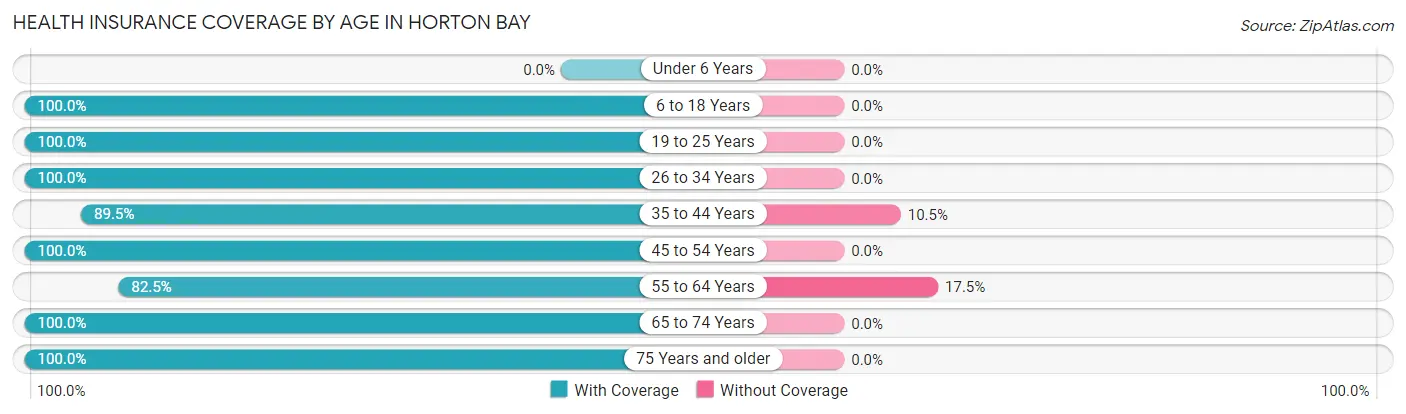
| Age Bracket | With Coverage | Without Coverage |
| Under 6 Years | 0 (0.0%) | 0 (0.0%) |
| 6 to 18 Years | 46 (100.0%) | 0 (0.0%) |
| 19 to 25 Years | 15 (100.0%) | 0 (0.0%) |
| 26 to 34 Years | 8 (100.0%) | 0 (0.0%) |
| 35 to 44 Years | 17 (89.5%) | 2 (10.5%) |
| 45 to 54 Years | 32 (100.0%) | 0 (0.0%) |
| 55 to 64 Years | 66 (82.5%) | 14 (17.5%) |
| 65 to 74 Years | 108 (100.0%) | 0 (0.0%) |
| 75 Years and older | 71 (100.0%) | 0 (0.0%) |
| Total | 363 (95.8%) | 16 (4.2%) |
Health Insurance Coverage by Citizenship Status in Horton Bay
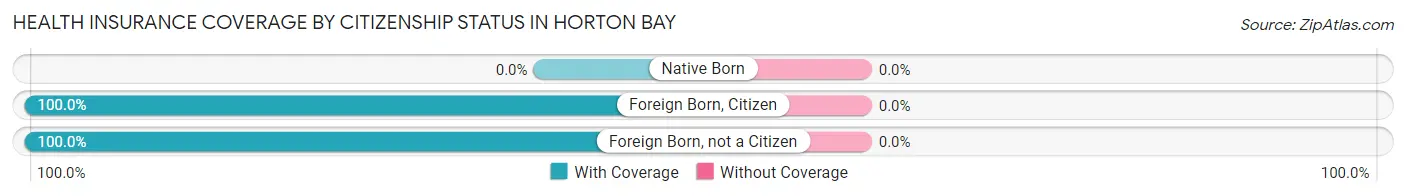
| Citizenship Status | With Coverage | Without Coverage |
| Native Born | 0 (0.0%) | 0 (0.0%) |
| Foreign Born, Citizen | 46 (100.0%) | 0 (0.0%) |
| Foreign Born, not a Citizen | 15 (100.0%) | 0 (0.0%) |
Health Insurance Coverage by Household Income in Horton Bay
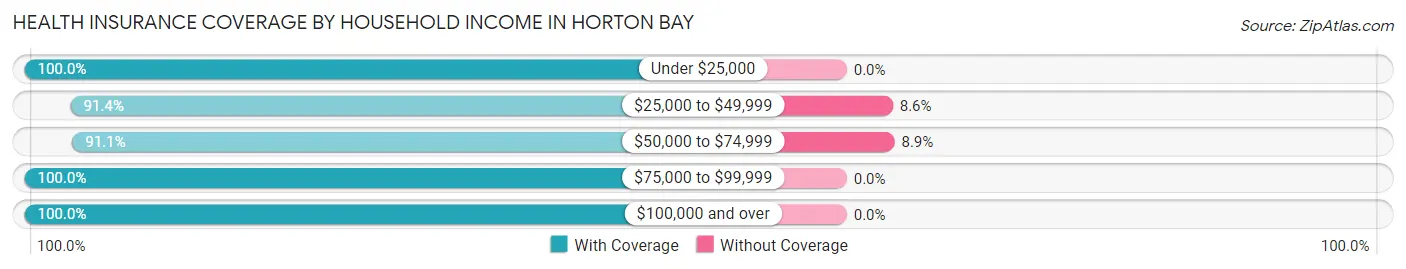
| Household Income | With Coverage | Without Coverage |
| Under $25,000 | 14 (100.0%) | 0 (0.0%) |
| $25,000 to $49,999 | 53 (91.4%) | 5 (8.6%) |
| $50,000 to $74,999 | 112 (91.1%) | 11 (8.9%) |
| $75,000 to $99,999 | 75 (100.0%) | 0 (0.0%) |
| $100,000 and over | 109 (100.0%) | 0 (0.0%) |
Public vs Private Health Insurance Coverage by Age in Horton Bay
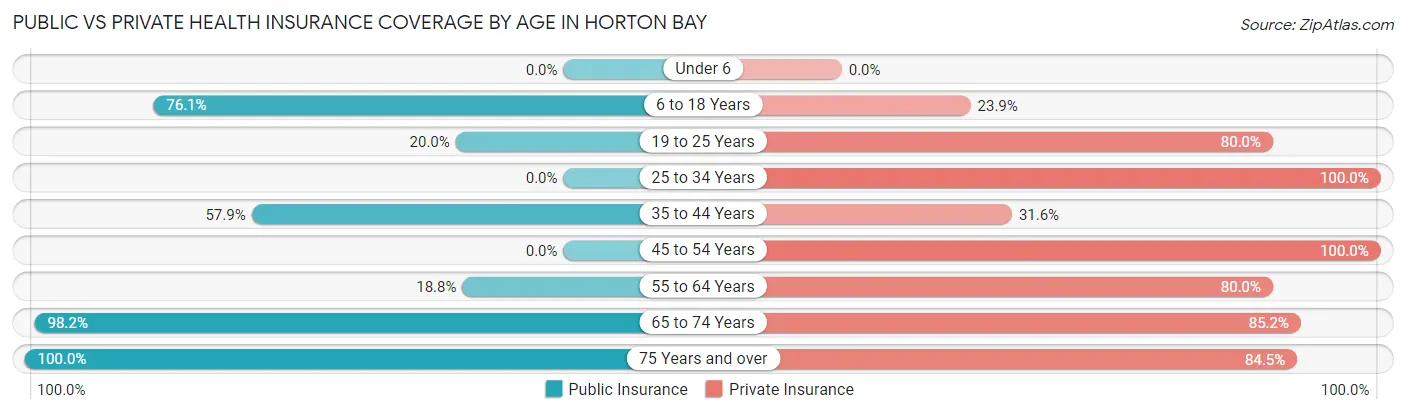
| Age Bracket | Public Insurance | Private Insurance |
| Under 6 | 0 (0.0%) | 0 (0.0%) |
| 6 to 18 Years | 35 (76.1%) | 11 (23.9%) |
| 19 to 25 Years | 3 (20.0%) | 12 (80.0%) |
| 25 to 34 Years | 0 (0.0%) | 8 (100.0%) |
| 35 to 44 Years | 11 (57.9%) | 6 (31.6%) |
| 45 to 54 Years | 0 (0.0%) | 32 (100.0%) |
| 55 to 64 Years | 15 (18.8%) | 64 (80.0%) |
| 65 to 74 Years | 106 (98.2%) | 92 (85.2%) |
| 75 Years and over | 71 (100.0%) | 60 (84.5%) |
| Total | 241 (63.6%) | 285 (75.2%) |
Disability Status by Sex by Age in Horton Bay
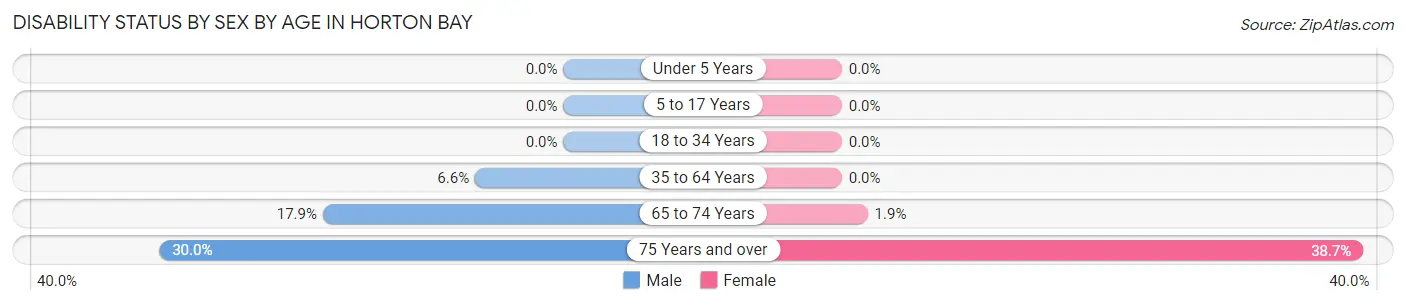
| Age Bracket | Male | Female |
| Under 5 Years | 0 (0.0%) | 0 (0.0%) |
| 5 to 17 Years | 0 (0.0%) | 0 (0.0%) |
| 18 to 34 Years | 0 (0.0%) | 0 (0.0%) |
| 35 to 64 Years | 4 (6.6%) | 0 (0.0%) |
| 65 to 74 Years | 10 (17.9%) | 1 (1.9%) |
| 75 Years and over | 12 (30.0%) | 12 (38.7%) |
Disability Class by Sex by Age in Horton Bay
Disability Class: Hearing Difficulty
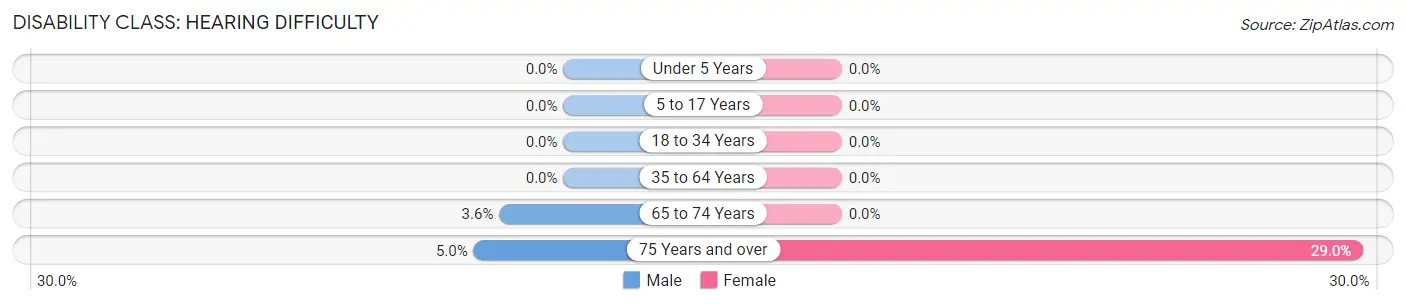
| Age Bracket | Male | Female |
| Under 5 Years | 0 (0.0%) | 0 (0.0%) |
| 5 to 17 Years | 0 (0.0%) | 0 (0.0%) |
| 18 to 34 Years | 0 (0.0%) | 0 (0.0%) |
| 35 to 64 Years | 0 (0.0%) | 0 (0.0%) |
| 65 to 74 Years | 2 (3.6%) | 0 (0.0%) |
| 75 Years and over | 2 (5.0%) | 9 (29.0%) |
Disability Class: Vision Difficulty
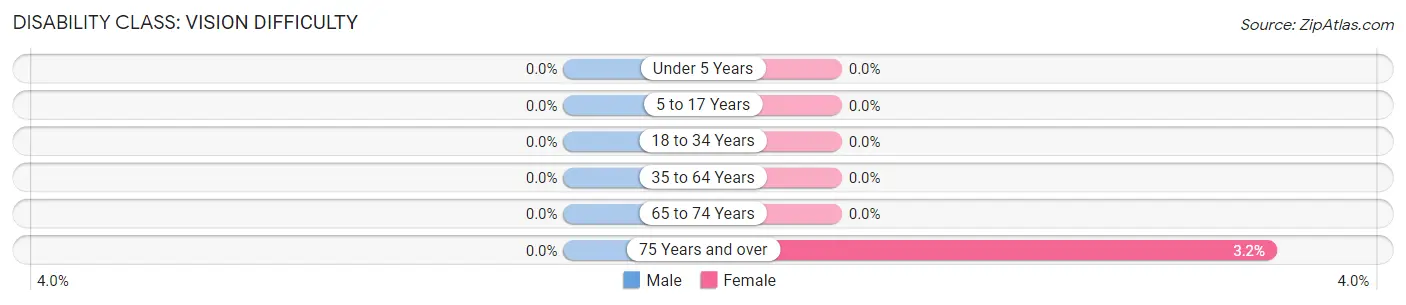
| Age Bracket | Male | Female |
| Under 5 Years | 0 (0.0%) | 0 (0.0%) |
| 5 to 17 Years | 0 (0.0%) | 0 (0.0%) |
| 18 to 34 Years | 0 (0.0%) | 0 (0.0%) |
| 35 to 64 Years | 0 (0.0%) | 0 (0.0%) |
| 65 to 74 Years | 0 (0.0%) | 0 (0.0%) |
| 75 Years and over | 0 (0.0%) | 1 (3.2%) |
Disability Class: Cognitive Difficulty
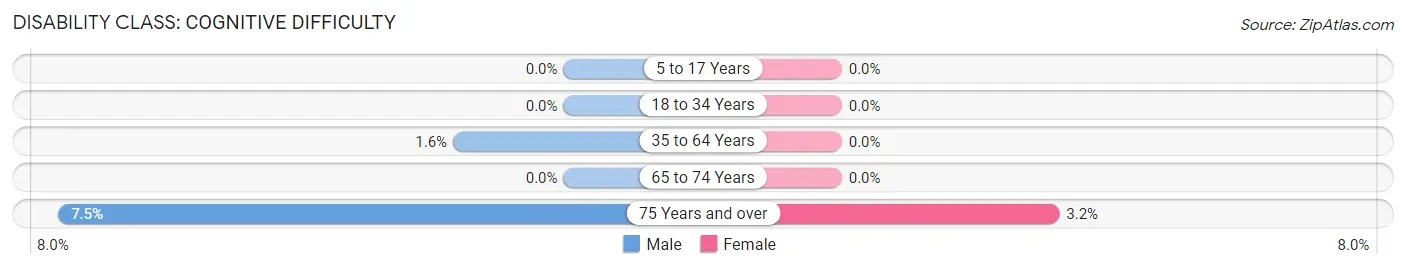
| Age Bracket | Male | Female |
| 5 to 17 Years | 0 (0.0%) | 0 (0.0%) |
| 18 to 34 Years | 0 (0.0%) | 0 (0.0%) |
| 35 to 64 Years | 1 (1.6%) | 0 (0.0%) |
| 65 to 74 Years | 0 (0.0%) | 0 (0.0%) |
| 75 Years and over | 3 (7.5%) | 1 (3.2%) |
Disability Class: Ambulatory Difficulty
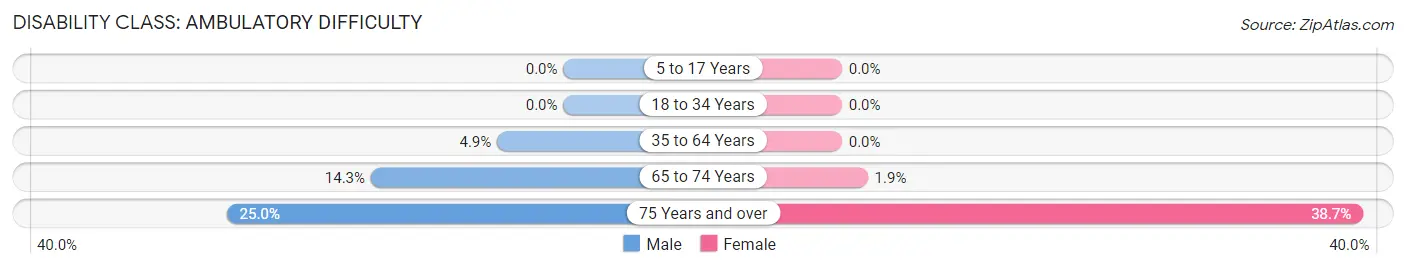
| Age Bracket | Male | Female |
| 5 to 17 Years | 0 (0.0%) | 0 (0.0%) |
| 18 to 34 Years | 0 (0.0%) | 0 (0.0%) |
| 35 to 64 Years | 3 (4.9%) | 0 (0.0%) |
| 65 to 74 Years | 8 (14.3%) | 1 (1.9%) |
| 75 Years and over | 10 (25.0%) | 12 (38.7%) |
Disability Class: Self-Care Difficulty
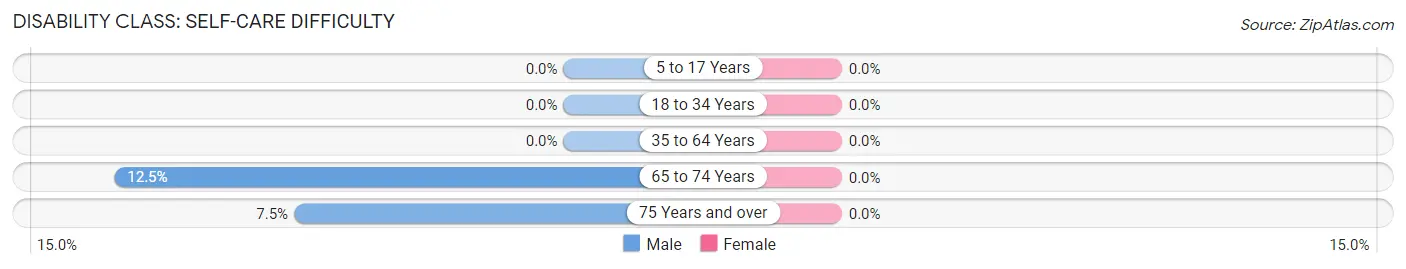
| Age Bracket | Male | Female |
| 5 to 17 Years | 0 (0.0%) | 0 (0.0%) |
| 18 to 34 Years | 0 (0.0%) | 0 (0.0%) |
| 35 to 64 Years | 0 (0.0%) | 0 (0.0%) |
| 65 to 74 Years | 7 (12.5%) | 0 (0.0%) |
| 75 Years and over | 3 (7.5%) | 0 (0.0%) |
Technology Access in Horton Bay
Computing Device Access in Horton Bay
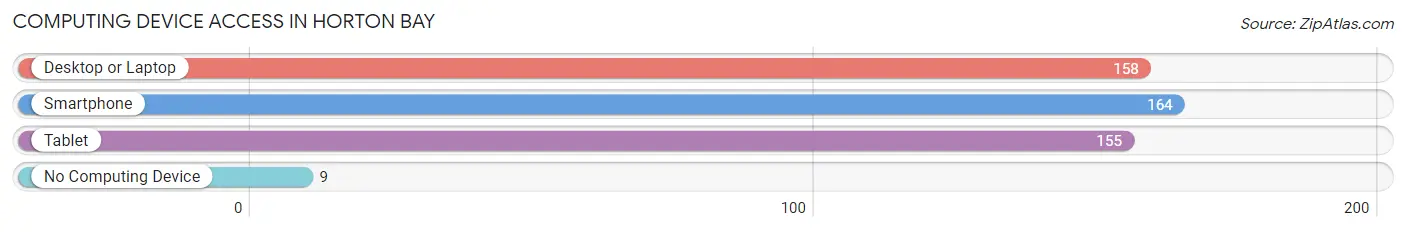
| Device Type | # Households | % Households |
| Desktop or Laptop | 158 | 77.4% |
| Smartphone | 164 | 80.4% |
| Tablet | 155 | 76.0% |
| No Computing Device | 9 | 4.4% |
| Total | 204 | 100.0% |
Internet Access in Horton Bay
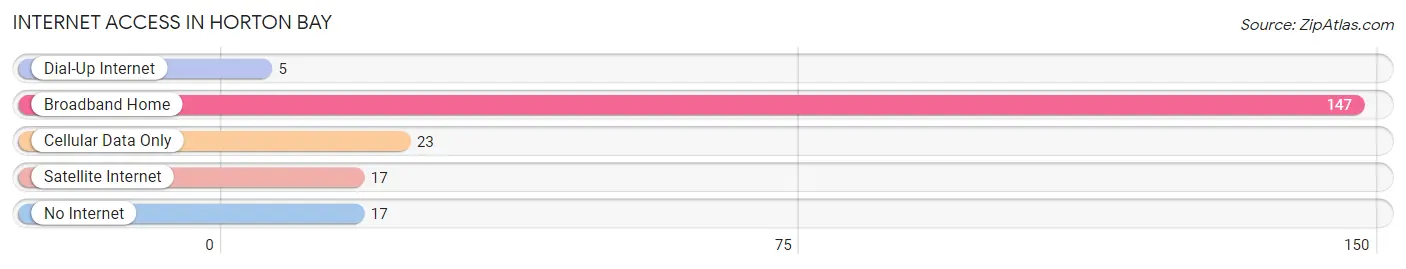
| Internet Type | # Households | % Households |
| Dial-Up Internet | 5 | 2.5% |
| Broadband Home | 147 | 72.1% |
| Cellular Data Only | 23 | 11.3% |
| Satellite Internet | 17 | 8.3% |
| No Internet | 17 | 8.3% |
| Total | 204 | 100.0% |
Horton Bay Summary
Horton Bay is a small unincorporated community located in Charlevoix County, Michigan. It is situated on the eastern shore of Lake Charlevoix, approximately 10 miles south of Charlevoix. The community is known for its picturesque views of the lake and its historic buildings.
History
Horton Bay was first settled in 1871 by William and Mary Horton, who had moved to the area from New York. The Hortons built a sawmill and a general store, and the community quickly grew. By the early 1900s, Horton Bay had become a popular summer destination for wealthy families from Detroit and Chicago. The community was home to several resorts, including the Horton Bay Club, which was founded in 1902.
The community was also home to a number of other businesses, including a post office, a blacksmith shop, a grist mill, and a cheese factory. In the 1920s, the community was home to a movie theater, a bowling alley, and a dance hall.
Geography
Horton Bay is located in Charlevoix County, Michigan. It is situated on the eastern shore of Lake Charlevoix, approximately 10 miles south of Charlevoix. The community is surrounded by rolling hills and forests, and is known for its picturesque views of the lake.
Economy
Horton Bay is a small, rural community with a limited economy. The primary industries in the area are tourism and agriculture. The community is home to several resorts, including the Horton Bay Club, which is a popular destination for summer vacationers. The community is also home to a number of small businesses, including a general store, a post office, and a cheese factory.
Demographics
As of the 2010 census, the population of Horton Bay was 545. The racial makeup of the community was 97.3% White, 0.2% African American, 0.4% Native American, 0.2% Asian, 0.2% from other races, and 1.7% from two or more races. The median household income in the community was $41,250, and the median family income was $50,000.
Conclusion
Horton Bay is a small, rural community located in Charlevoix County, Michigan. It is situated on the eastern shore of Lake Charlevoix, and is known for its picturesque views of the lake and its historic buildings. The primary industries in the area are tourism and agriculture, and the community is home to several resorts and small businesses. As of the 2010 census, the population of Horton Bay was 545.
Common Questions
What is Per Capita Income in Horton Bay?
Per Capita income in Horton Bay is $50,944.
What is the Median Family Income in Horton Bay?
Median Family Income in Horton Bay is $76,932.
What is the Median Household income in Horton Bay?
Median Household Income in Horton Bay is $73,929.
What is Income or Wage Gap in Horton Bay?
Income or Wage Gap in Horton Bay is 33.2%.
Women in Horton Bay earn 66.8 cents for every dollar earned by a man.
What is Inequality or Gini Index in Horton Bay?
Inequality or Gini Index in Horton Bay is 0.37.
What is the Total Population of Horton Bay?
Total Population of Horton Bay is 379.
What is the Total Male Population of Horton Bay?
Total Male Population of Horton Bay is 168.
What is the Total Female Population of Horton Bay?
Total Female Population of Horton Bay is 211.
What is the Ratio of Males per 100 Females in Horton Bay?
There are 79.62 Males per 100 Females in Horton Bay.
What is the Ratio of Females per 100 Males in Horton Bay?
There are 125.60 Females per 100 Males in Horton Bay.
What is the Median Population Age in Horton Bay?
Median Population Age in Horton Bay is 64.3 Years.
What is the Average Family Size in Horton Bay
Average Family Size in Horton Bay is 2.1 People.
What is the Average Household Size in Horton Bay
Average Household Size in Horton Bay is 1.9 People.
How Large is the Labor Force in Horton Bay?
There are 159 People in the Labor Forcein in Horton Bay.
What is the Percentage of People in the Labor Force in Horton Bay?
46.2% of People are in the Labor Force in Horton Bay.
What is the Unemployment Rate in Horton Bay?
Unemployment Rate in Horton Bay is 2.5%.