Cities with the Highest Percentage of Households with Income Above $200,000 in Kansas
RELATED REPORTS & OPTIONS
Household Income | $200k+
Kansas
Compare Cities
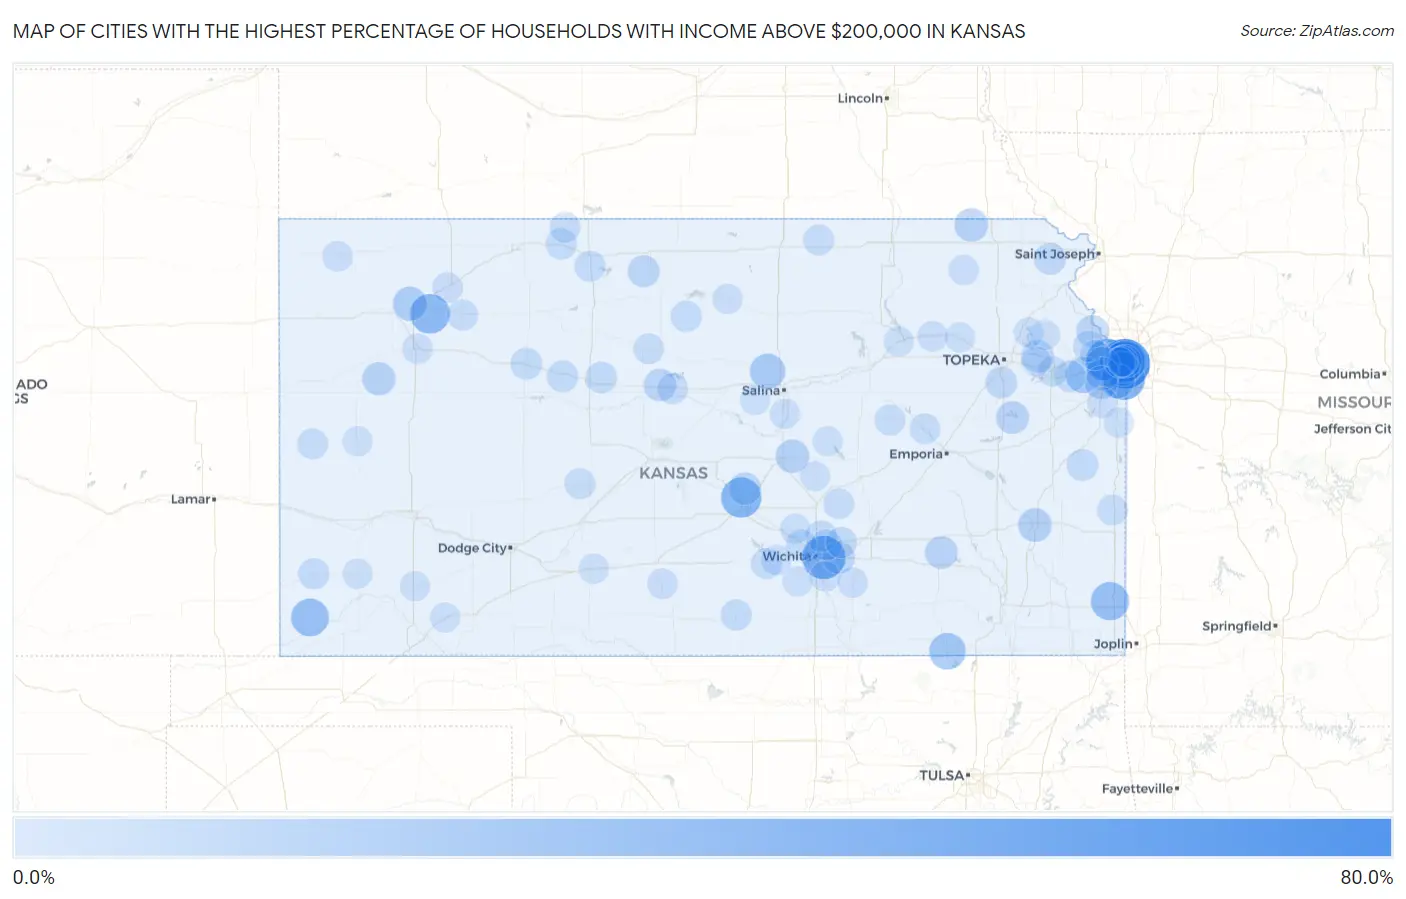
Map of Cities with the Highest Percentage of Households with Income Above $200,000 in Kansas
0.0%
80.0%
Cities with the Highest Percentage of Households with Income Above $200,000 in Kansas
| City | Households with Income > $200k | vs State | vs National | |
| 1. | Mission Hills | 68.2% | 8.0%(+60.2)#1 | 11.4%(+56.8)#91 |
| 2. | Bremen | 55.2% | 8.0%(+47.2)#2 | 11.4%(+43.8)#285 |
| 3. | Mission Woods | 49.2% | 8.0%(+41.2)#3 | 11.4%(+37.8)#478 |
| 4. | Eastborough | 47.6% | 8.0%(+39.6)#4 | 11.4%(+36.2)#516 |
| 5. | Peck | 46.4% | 8.0%(+38.4)#5 | 11.4%(+35.0)#566 |
| 6. | Leawood | 44.7% | 8.0%(+36.7)#6 | 11.4%(+33.3)#623 |
| 7. | Lake Quivira | 44.2% | 8.0%(+36.2)#7 | 11.4%(+32.8)#645 |
| 8. | Fairway | 40.5% | 8.0%(+32.5)#8 | 11.4%(+29.1)#798 |
| 9. | Westwood Hills | 39.9% | 8.0%(+31.9)#9 | 11.4%(+28.5)#846 |
| 10. | Willowbrook | 37.9% | 8.0%(+29.9)#10 | 11.4%(+26.5)#970 |
| 11. | Menlo | 35.7% | 8.0%(+27.7)#11 | 11.4%(+24.3)#1,115 |
| 12. | Chicopee | 31.3% | 8.0%(+23.3)#12 | 11.4%(+19.9)#1,494 |
| 13. | Richfield | 30.0% | 8.0%(+22.0)#13 | 11.4%(+18.6)#1,626 |
| 14. | Chautauqua | 25.9% | 8.0%(+17.9)#14 | 11.4%(+14.5)#2,073 |
| 15. | Piedmont | 25.6% | 8.0%(+17.6)#15 | 11.4%(+14.2)#2,108 |
| 16. | De Soto | 24.4% | 8.0%(+16.4)#16 | 11.4%(+13.0)#2,244 |
| 17. | Keats | 22.5% | 8.0%(+14.5)#17 | 11.4%(+11.1)#2,576 |
| 18. | Culver | 21.9% | 8.0%(+13.9)#18 | 11.4%(+10.5)#2,689 |
| 19. | St. Marks | 21.4% | 8.0%(+13.4)#19 | 11.4%(+10.00)#2,778 |
| 20. | Prairie Village | 19.5% | 8.0%(+11.5)#20 | 11.4%(+8.10)#3,150 |
| 21. | Gem | 19.1% | 8.0%(+11.1)#21 | 11.4%(+7.70)#3,259 |
| 22. | Overland Park | 18.3% | 8.0%(+10.3)#22 | 11.4%(+6.90)#3,426 |
| 23. | Shawnee | 17.2% | 8.0%(+9.20)#23 | 11.4%(+5.80)#3,669 |
| 24. | Bassett | 16.7% | 8.0%(+8.70)#24 | 11.4%(+5.30)#3,806 |
| 25. | Bern | 16.1% | 8.0%(+8.10)#25 | 11.4%(+4.70)#3,964 |
| 26. | Galva | 16.0% | 8.0%(+8.00)#26 | 11.4%(+4.60)#3,979 |
| 27. | Russell Springs | 15.8% | 8.0%(+7.80)#27 | 11.4%(+4.40)#4,053 |
| 28. | Lenexa | 15.6% | 8.0%(+7.60)#28 | 11.4%(+4.20)#4,084 |
| 29. | Olathe | 14.9% | 8.0%(+6.90)#29 | 11.4%(+3.50)#4,310 |
| 30. | Westwood | 14.9% | 8.0%(+6.90)#30 | 11.4%(+3.50)#4,334 |
| 31. | Vassar | 14.7% | 8.0%(+6.70)#31 | 11.4%(+3.30)#4,403 |
| 32. | Climax | 14.3% | 8.0%(+6.30)#32 | 11.4%(+2.90)#4,570 |
| 33. | Perry | 13.6% | 8.0%(+5.60)#33 | 11.4%(+2.20)#4,834 |
| 34. | Bunker Hill | 13.6% | 8.0%(+5.60)#34 | 11.4%(+2.20)#4,843 |
| 35. | The Highlands | 13.2% | 8.0%(+5.20)#35 | 11.4%(+1.80)#4,993 |
| 36. | Lansing | 13.1% | 8.0%(+5.10)#36 | 11.4%(+1.70)#5,014 |
| 37. | Andover | 12.8% | 8.0%(+4.80)#37 | 11.4%(+1.40)#5,148 |
| 38. | Gaylord | 11.8% | 8.0%(+3.80)#38 | 11.4%(+0.400)#5,648 |
| 39. | Denton | 11.1% | 8.0%(+3.10)#39 | 11.4%(-0.300)#5,944 |
| 40. | Wakarusa | 10.9% | 8.0%(+2.90)#40 | 11.4%(-0.500)#6,051 |
| 41. | Wakeeney | 10.7% | 8.0%(+2.70)#41 | 11.4%(-0.700)#6,141 |
| 42. | Parker | 10.6% | 8.0%(+2.60)#42 | 11.4%(-0.800)#6,207 |
| 43. | Kechi | 10.3% | 8.0%(+2.30)#43 | 11.4%(-1.10)#6,344 |
| 44. | Ellis | 10.3% | 8.0%(+2.30)#44 | 11.4%(-1.10)#6,348 |
| 45. | Catharine | 10.1% | 8.0%(+2.10)#45 | 11.4%(-1.30)#6,484 |
| 46. | Eudora | 10.0% | 8.0%(+2.00)#46 | 11.4%(-1.40)#6,505 |
| 47. | Basehor | 9.5% | 8.0%(+1.50)#47 | 11.4%(-1.90)#6,846 |
| 48. | Harper | 9.4% | 8.0%(+1.40)#48 | 11.4%(-2.00)#6,938 |
| 49. | Tipton | 9.4% | 8.0%(+1.40)#49 | 11.4%(-2.00)#6,958 |
| 50. | Prairie View | 9.4% | 8.0%(+1.40)#50 | 11.4%(-2.00)#6,961 |
| 51. | Bel Aire | 9.2% | 8.0%(+1.20)#51 | 11.4%(-2.20)#7,043 |
| 52. | Johnson City | 9.1% | 8.0%(+1.10)#52 | 11.4%(-2.30)#7,135 |
| 53. | Benton | 9.1% | 8.0%(+1.10)#53 | 11.4%(-2.30)#7,142 |
| 54. | Glade | 9.1% | 8.0%(+1.10)#54 | 11.4%(-2.30)#7,159 |
| 55. | Maize | 8.7% | 8.0%(+0.700)#55 | 11.4%(-2.70)#7,377 |
| 56. | Tecumseh | 8.7% | 8.0%(+0.700)#56 | 11.4%(-2.70)#7,414 |
| 57. | Wilsey | 8.6% | 8.0%(+0.600)#57 | 11.4%(-2.80)#7,494 |
| 58. | Long Island | 8.6% | 8.0%(+0.600)#58 | 11.4%(-2.80)#7,495 |
| 59. | Rozel | 8.6% | 8.0%(+0.600)#59 | 11.4%(-2.80)#7,497 |
| 60. | Haddam | 8.6% | 8.0%(+0.600)#60 | 11.4%(-2.80)#7,498 |
| 61. | Tribune | 8.4% | 8.0%(+0.400)#61 | 11.4%(-3.00)#7,626 |
| 62. | Dorrance | 8.4% | 8.0%(+0.400)#62 | 11.4%(-3.00)#7,648 |
| 63. | Hoxie | 8.3% | 8.0%(+0.300)#63 | 11.4%(-3.10)#7,696 |
| 64. | Fulton | 8.3% | 8.0%(+0.300)#64 | 11.4%(-3.10)#7,724 |
| 65. | Cheney | 8.1% | 8.0%(+0.100)#65 | 11.4%(-3.30)#7,858 |
| 66. | Elbing | 8.0% | 8.0%(=0.000)#66 | 11.4%(-3.40)#7,975 |
| 67. | Lawrence | 7.8% | 8.0%(-0.200)#67 | 11.4%(-3.60)#8,058 |
| 68. | Waldo | 7.7% | 8.0%(-0.300)#68 | 11.4%(-3.70)#8,222 |
| 69. | Dunlap | 7.7% | 8.0%(-0.300)#69 | 11.4%(-3.70)#8,223 |
| 70. | Spring Hill | 7.6% | 8.0%(-0.400)#70 | 11.4%(-3.80)#8,255 |
| 71. | Garden Plain | 7.4% | 8.0%(-0.600)#71 | 11.4%(-4.00)#8,462 |
| 72. | Wamego | 7.3% | 8.0%(-0.700)#72 | 11.4%(-4.10)#8,534 |
| 73. | Sawyer | 7.3% | 8.0%(-0.700)#73 | 11.4%(-4.10)#8,582 |
| 74. | Oakley | 7.2% | 8.0%(-0.800)#74 | 11.4%(-4.20)#8,630 |
| 75. | Bird City | 7.1% | 8.0%(-0.900)#75 | 11.4%(-4.30)#8,742 |
| 76. | Selden | 7.1% | 8.0%(-0.900)#76 | 11.4%(-4.30)#8,745 |
| 77. | Derby | 7.0% | 8.0%(-1.000)#77 | 11.4%(-4.40)#8,770 |
| 78. | Corning | 7.0% | 8.0%(-1.000)#78 | 11.4%(-4.40)#8,860 |
| 79. | Douglass | 6.8% | 8.0%(-1.20)#79 | 11.4%(-4.60)#9,046 |
| 80. | Assaria | 6.8% | 8.0%(-1.20)#80 | 11.4%(-4.60)#9,072 |
| 81. | Manhattan | 6.6% | 8.0%(-1.40)#81 | 11.4%(-4.80)#9,220 |
| 82. | Bonner Springs | 6.6% | 8.0%(-1.40)#82 | 11.4%(-4.80)#9,237 |
| 83. | Louisburg | 6.6% | 8.0%(-1.40)#83 | 11.4%(-4.80)#9,247 |
| 84. | Brookville | 6.6% | 8.0%(-1.40)#84 | 11.4%(-4.80)#9,308 |
| 85. | Roeland Park | 6.5% | 8.0%(-1.50)#85 | 11.4%(-4.90)#9,344 |
| 86. | Beloit | 6.5% | 8.0%(-1.50)#86 | 11.4%(-4.90)#9,356 |
| 87. | Clearwater | 6.5% | 8.0%(-1.50)#87 | 11.4%(-4.90)#9,361 |
| 88. | Oskaloosa | 6.5% | 8.0%(-1.50)#88 | 11.4%(-4.90)#9,378 |
| 89. | Durham | 6.5% | 8.0%(-1.50)#89 | 11.4%(-4.90)#9,422 |
| 90. | St Marys | 6.3% | 8.0%(-1.70)#90 | 11.4%(-5.10)#9,579 |
| 91. | Leoti | 6.3% | 8.0%(-1.70)#91 | 11.4%(-5.10)#9,592 |
| 92. | Plains | 6.3% | 8.0%(-1.70)#92 | 11.4%(-5.10)#9,597 |
| 93. | Lecompton | 6.3% | 8.0%(-1.70)#93 | 11.4%(-5.10)#9,607 |
| 94. | Ozawkie | 6.3% | 8.0%(-1.70)#94 | 11.4%(-5.10)#9,614 |
| 95. | Greensburg | 6.3% | 8.0%(-1.70)#95 | 11.4%(-5.10)#9,621 |
| 96. | Goessel | 6.3% | 8.0%(-1.70)#96 | 11.4%(-5.10)#9,627 |
| 97. | Bentley | 6.3% | 8.0%(-1.70)#97 | 11.4%(-5.10)#9,635 |
| 98. | Ulysses | 6.2% | 8.0%(-1.80)#98 | 11.4%(-5.20)#9,704 |
| 99. | Sublette | 6.2% | 8.0%(-1.80)#99 | 11.4%(-5.20)#9,730 |
| 100. | Mission | 6.1% | 8.0%(-1.90)#100 | 11.4%(-5.30)#9,805 |
Common Questions
What are the Top 10 Cities with the Highest Percentage of Households with Income Above $200,000 in Kansas?
Top 10 Cities with the Highest Percentage of Households with Income Above $200,000 in Kansas are:
#1
68.2%
#2
49.2%
#3
47.6%
#4
44.7%
#5
44.2%
#6
40.5%
#7
39.9%
#8
37.9%
#9
35.7%
#10
31.3%
What city has the Highest Percentage of Households with Income Above $200,000 in Kansas?
Mission Hills has the Highest Percentage of Households with Income Above $200,000 in Kansas with 68.2%.
What is the Percentage of Households with Income Above $200,000 in the State of Kansas?
Percentage of Households with Income Above $200,000 in Kansas is 8.0%.
What is the Percentage of Households with Income Above $200,000 in the United States?
Percentage of Households with Income Above $200,000 in the United States is 11.4%.