Empire, MI Map & Demographics
Empire Map
Empire Overview
$55,687
PER CAPITA INCOME
$83,750
AVG FAMILY INCOME
$66,563
AVG HOUSEHOLD INCOME
19.3%
WAGE / INCOME GAP [ % ]
80.7¢/ $1
WAGE / INCOME GAP [ $ ]
0.54
INEQUALITY / GINI INDEX
392
TOTAL POPULATION
189
MALE POPULATION
203
FEMALE POPULATION
93.10
MALES / 100 FEMALES
107.41
FEMALES / 100 MALES
63.1
MEDIAN AGE
2.6
AVG FAMILY SIZE
2.0
AVG HOUSEHOLD SIZE
150
LABOR FORCE [ PEOPLE ]
46.7%
PERCENT IN LABOR FORCE
1.3%
UNEMPLOYMENT RATE
Empire Zip Codes
Empire Area Codes
Income in Empire
Income Overview in Empire
Per Capita Income in Empire is $55,687, while median incomes of families and households are $83,750 and $66,563 respectively.
| Characteristic | Number | Measure |
| Per Capita Income | 392 | $55,687 |
| Median Family Income | 106 | $83,750 |
| Mean Family Income | 106 | $123,600 |
| Median Household Income | 197 | $66,563 |
| Mean Household Income | 197 | $107,798 |
| Income Deficit | 106 | $0 |
| Wage / Income Gap (%) | 392 | 19.31% |
| Wage / Income Gap ($) | 392 | 80.69¢ per $1 |
| Gini / Inequality Index | 392 | 0.54 |
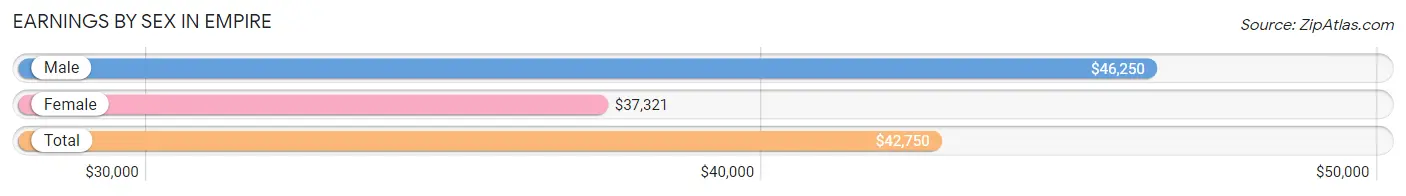
Earnings by Sex in Empire
Average Earnings in Empire are $42,750, $46,250 for men and $37,321 for women, a difference of 19.3%.
| Sex | Number | Average Earnings |
| Male | 85 (50.6%) | $46,250 |
| Female | 83 (49.4%) | $37,321 |
| Total | 168 (100.0%) | $42,750 |
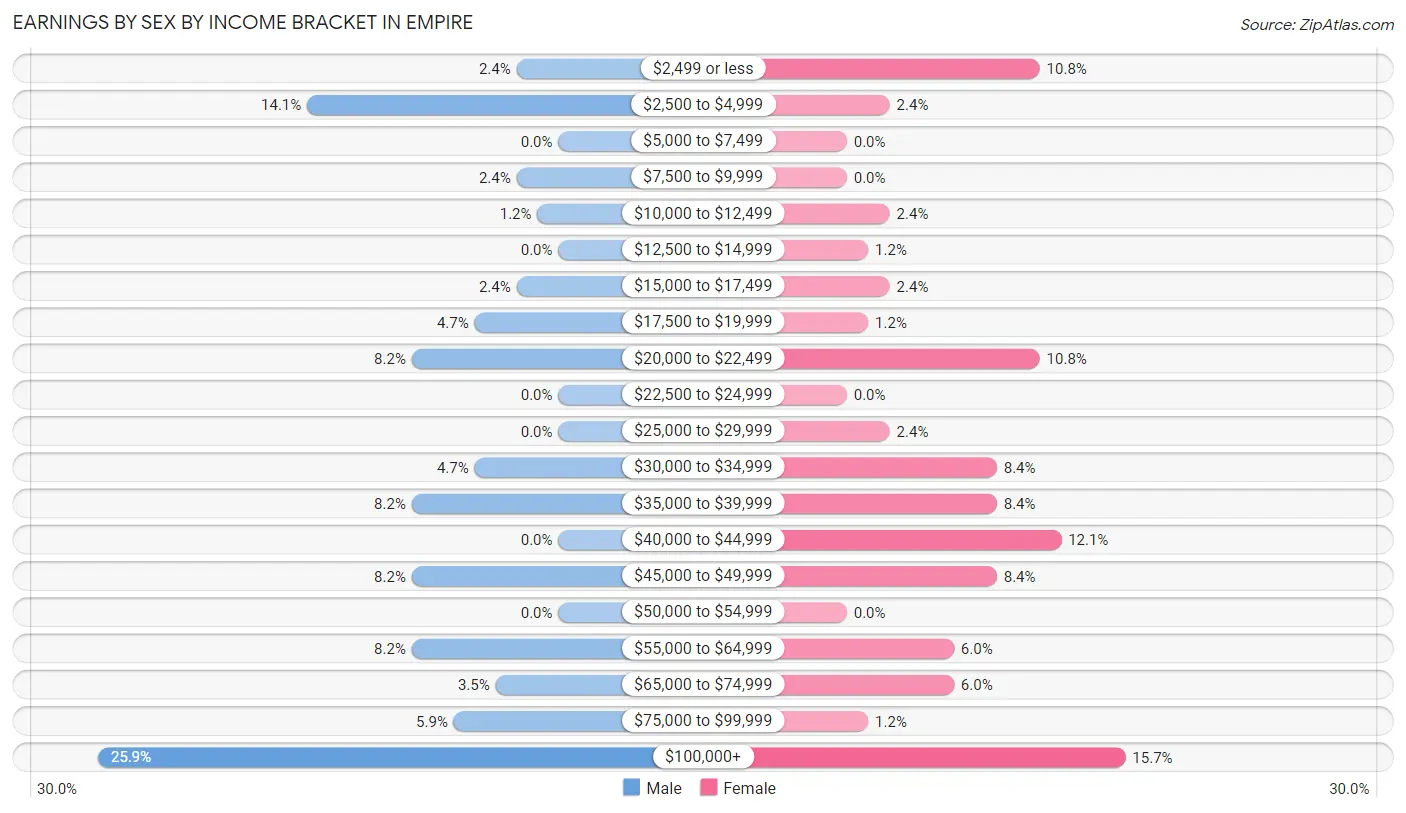
Earnings by Sex by Income Bracket in Empire
The most common earnings brackets in Empire are $100,000+ for men (22 | 25.9%) and $100,000+ for women (13 | 15.7%).
| Income | Male | Female |
| $2,499 or less | 2 (2.4%) | 9 (10.8%) |
| $2,500 to $4,999 | 12 (14.1%) | 2 (2.4%) |
| $5,000 to $7,499 | 0 (0.0%) | 0 (0.0%) |
| $7,500 to $9,999 | 2 (2.4%) | 0 (0.0%) |
| $10,000 to $12,499 | 1 (1.2%) | 2 (2.4%) |
| $12,500 to $14,999 | 0 (0.0%) | 1 (1.2%) |
| $15,000 to $17,499 | 2 (2.4%) | 2 (2.4%) |
| $17,500 to $19,999 | 4 (4.7%) | 1 (1.2%) |
| $20,000 to $22,499 | 7 (8.2%) | 9 (10.8%) |
| $22,500 to $24,999 | 0 (0.0%) | 0 (0.0%) |
| $25,000 to $29,999 | 0 (0.0%) | 2 (2.4%) |
| $30,000 to $34,999 | 4 (4.7%) | 7 (8.4%) |
| $35,000 to $39,999 | 7 (8.2%) | 7 (8.4%) |
| $40,000 to $44,999 | 0 (0.0%) | 10 (12.0%) |
| $45,000 to $49,999 | 7 (8.2%) | 7 (8.4%) |
| $50,000 to $54,999 | 0 (0.0%) | 0 (0.0%) |
| $55,000 to $64,999 | 7 (8.2%) | 5 (6.0%) |
| $65,000 to $74,999 | 3 (3.5%) | 5 (6.0%) |
| $75,000 to $99,999 | 5 (5.9%) | 1 (1.2%) |
| $100,000+ | 22 (25.9%) | 13 (15.7%) |
| Total | 85 (100.0%) | 83 (100.0%) |
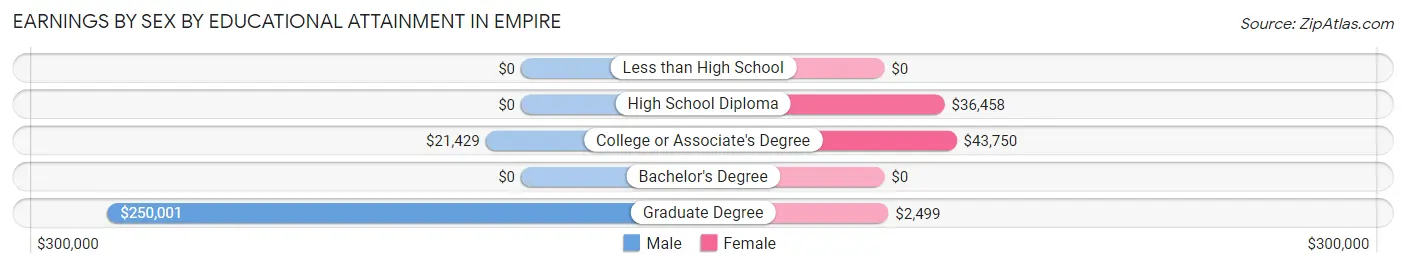
Earnings by Sex by Educational Attainment in Empire
Average earnings in Empire are $46,250 for men and $43,500 for women, a difference of 5.9%. Men with an educational attainment of graduate degree enjoy the highest average annual earnings of $250,001, while those with college or associate's degree education earn the least with $21,429. Women with an educational attainment of college or associate's degree earn the most with the average annual earnings of $43,750, while those with graduate degree education have the smallest earnings of $2,499.
| Educational Attainment | Male Income | Female Income |
| Less than High School | - | - |
| High School Diploma | - | - |
| College or Associate's Degree | $21,429 | $43,750 |
| Bachelor's Degree | - | - |
| Graduate Degree | $250,001 | $2,499 |
| Total | $46,250 | $43,500 |
Family Income in Empire
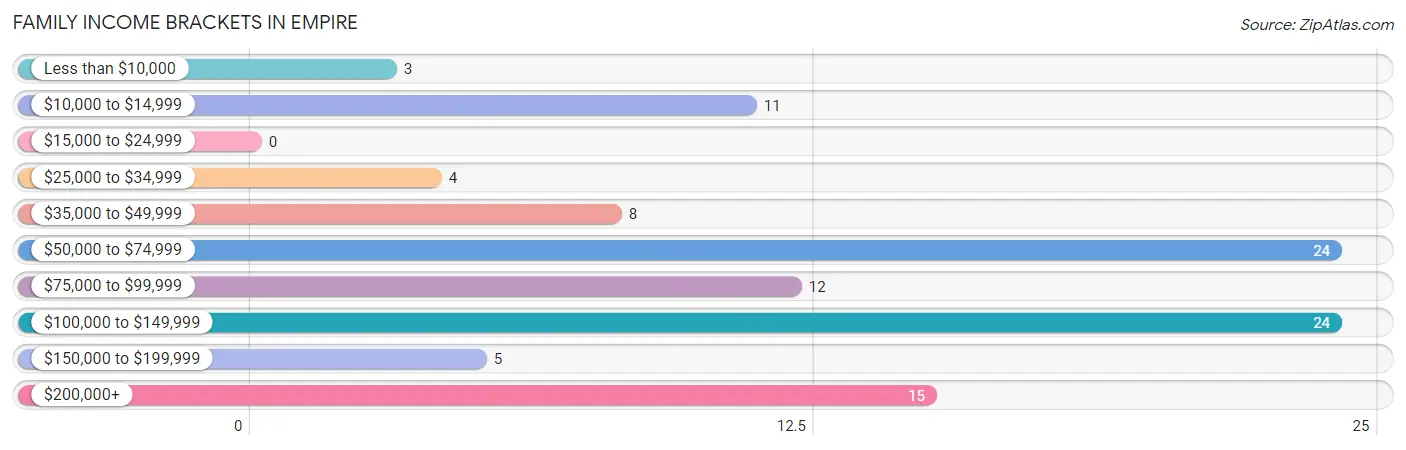
Family Income Brackets in Empire
According to the Empire family income data, there are 24 families falling into the $50,000 to $74,999 income range, which is the most common income bracket and makes up 22.6% of all families.
| Income Bracket | # Families | % Families |
| Less than $10,000 | 3 | 2.8% |
| $10,000 to $14,999 | 11 | 10.4% |
| $15,000 to $24,999 | 0 | 0.0% |
| $25,000 to $34,999 | 4 | 3.8% |
| $35,000 to $49,999 | 8 | 7.5% |
| $50,000 to $74,999 | 24 | 22.6% |
| $75,000 to $99,999 | 12 | 11.3% |
| $100,000 to $149,999 | 24 | 22.6% |
| $150,000 to $199,999 | 5 | 4.7% |
| $200,000+ | 15 | 14.2% |
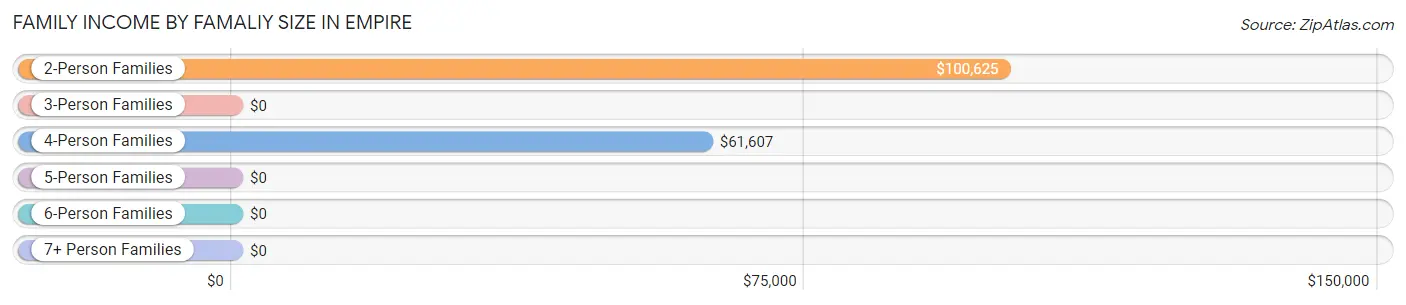
Family Income by Famaliy Size in Empire
2-person families (77 | 72.6%) account for the highest median family income in Empire with $100,625 per family, while 2-person families (77 | 72.6%) have the highest median income of $50,312 per family member.
| Income Bracket | # Families | Median Income |
| 2-Person Families | 77 (72.6%) | $100,625 |
| 3-Person Families | 12 (11.3%) | $0 |
| 4-Person Families | 17 (16.0%) | $61,607 |
| 5-Person Families | 0 (0.0%) | $0 |
| 6-Person Families | 0 (0.0%) | $0 |
| 7+ Person Families | 0 (0.0%) | $0 |
| Total | 106 (100.0%) | $83,750 |
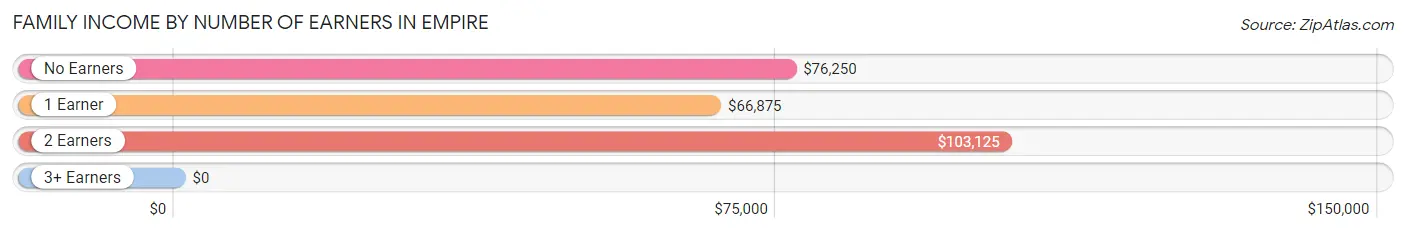
Family Income by Number of Earners in Empire
| Number of Earners | # Families | Median Income |
| No Earners | 40 (37.7%) | $76,250 |
| 1 Earner | 27 (25.5%) | $66,875 |
| 2 Earners | 36 (34.0%) | $103,125 |
| 3+ Earners | 3 (2.8%) | $0 |
| Total | 106 (100.0%) | $83,750 |
Household Income in Empire
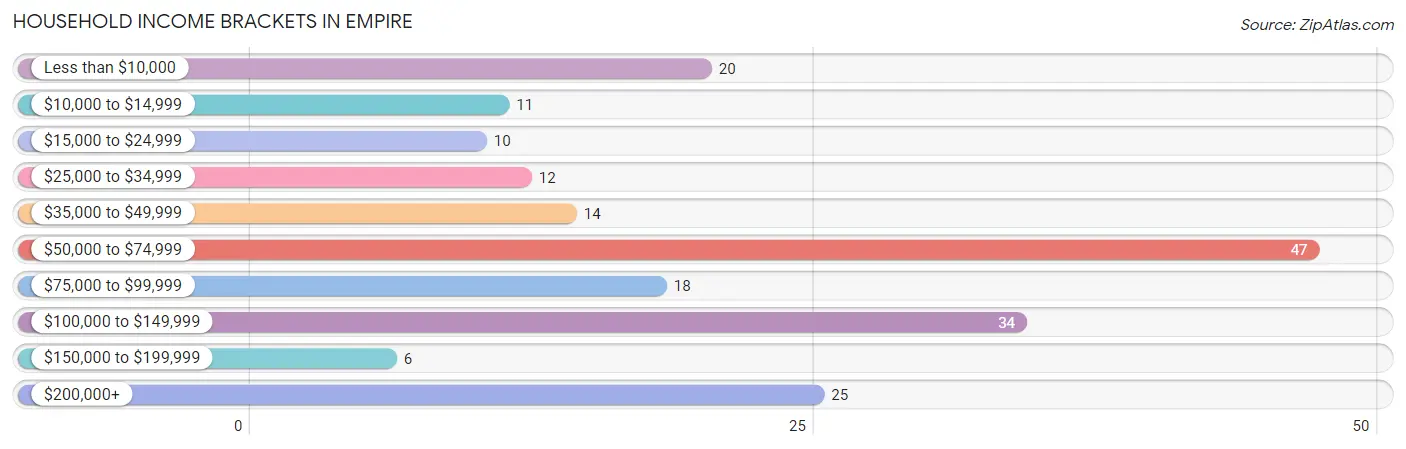
Household Income Brackets in Empire
With 47 households falling in the category, the $50,000 to $74,999 income range is the most frequent in Empire, accounting for 23.9% of all households. In contrast, only 6 households (3.0%) fall into the $150,000 to $199,999 income bracket, making it the least populous group.
| Income Bracket | # Households | % Households |
| Less than $10,000 | 20 | 10.2% |
| $10,000 to $14,999 | 11 | 5.6% |
| $15,000 to $24,999 | 10 | 5.1% |
| $25,000 to $34,999 | 12 | 6.1% |
| $35,000 to $49,999 | 14 | 7.1% |
| $50,000 to $74,999 | 47 | 23.9% |
| $75,000 to $99,999 | 18 | 9.1% |
| $100,000 to $149,999 | 34 | 17.3% |
| $150,000 to $199,999 | 6 | 3.0% |
| $200,000+ | 25 | 12.7% |
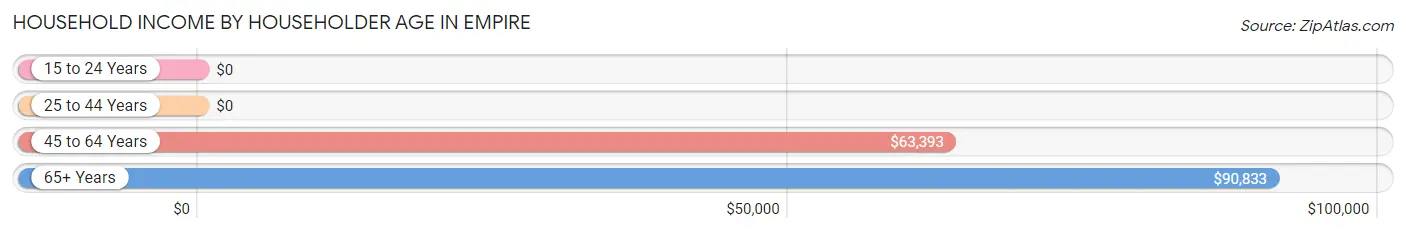
Household Income by Householder Age in Empire
The median household income in Empire is $66,563, with the highest median household income of $90,833 found in the 65+ years age bracket for the primary householder. A total of 98 households (49.7%) fall into this category. Meanwhile, the 15 to 24 years age bracket for the primary householder has the lowest median household income of $0, with 9 households (4.6%) in this group.
| Income Bracket | # Households | Median Income |
| 15 to 24 Years | 9 (4.6%) | $0 |
| 25 to 44 Years | 31 (15.7%) | $0 |
| 45 to 64 Years | 59 (29.9%) | $63,393 |
| 65+ Years | 98 (49.7%) | $90,833 |
| Total | 197 (100.0%) | $66,563 |
Poverty in Empire
Income Below Poverty by Sex and Age in Empire
With 21.7% poverty level for males and 12.8% for females among the residents of Empire, 5 year old males and under 5 year old females are the most vulnerable to poverty, with 2 males (100.0%) and 4 females (100.0%) in their respective age groups living below the poverty level.
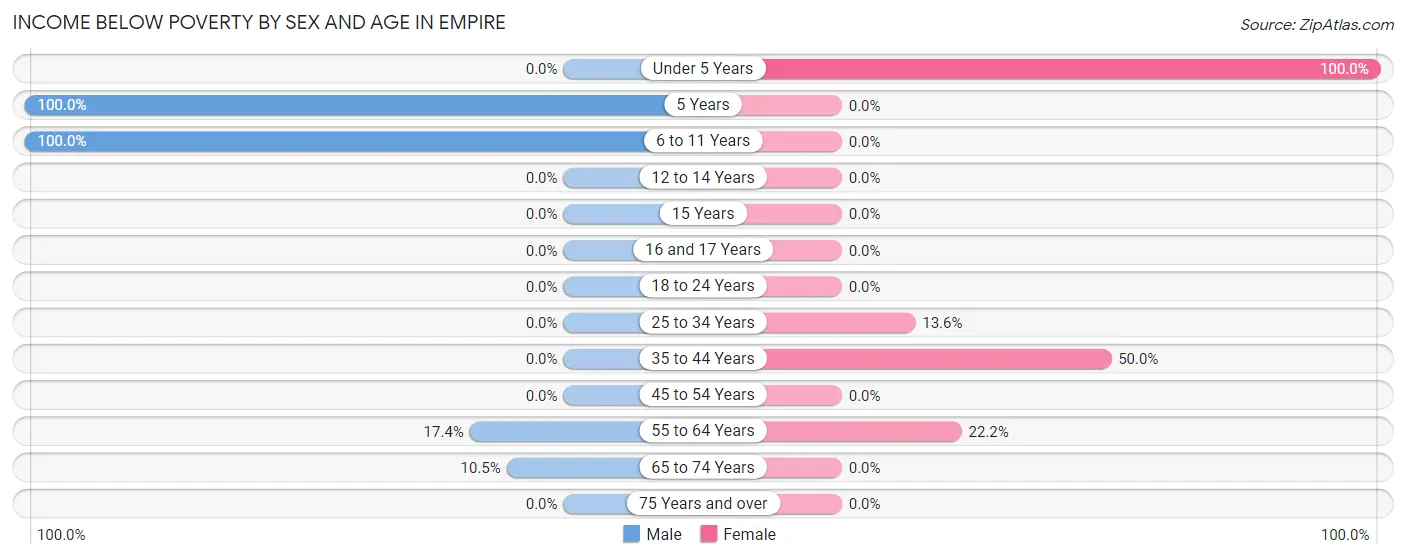
| Age Bracket | Male | Female |
| Under 5 Years | 0 (0.0%) | 4 (100.0%) |
| 5 Years | 2 (100.0%) | 0 (0.0%) |
| 6 to 11 Years | 25 (100.0%) | 0 (0.0%) |
| 12 to 14 Years | 0 (0.0%) | 0 (0.0%) |
| 15 Years | 0 (0.0%) | 0 (0.0%) |
| 16 and 17 Years | 0 (0.0%) | 0 (0.0%) |
| 18 to 24 Years | 0 (0.0%) | 0 (0.0%) |
| 25 to 34 Years | 0 (0.0%) | 3 (13.6%) |
| 35 to 44 Years | 0 (0.0%) | 11 (50.0%) |
| 45 to 54 Years | 0 (0.0%) | 0 (0.0%) |
| 55 to 64 Years | 8 (17.4%) | 8 (22.2%) |
| 65 to 74 Years | 6 (10.5%) | 0 (0.0%) |
| 75 Years and over | 0 (0.0%) | 0 (0.0%) |
| Total | 41 (21.7%) | 26 (12.8%) |
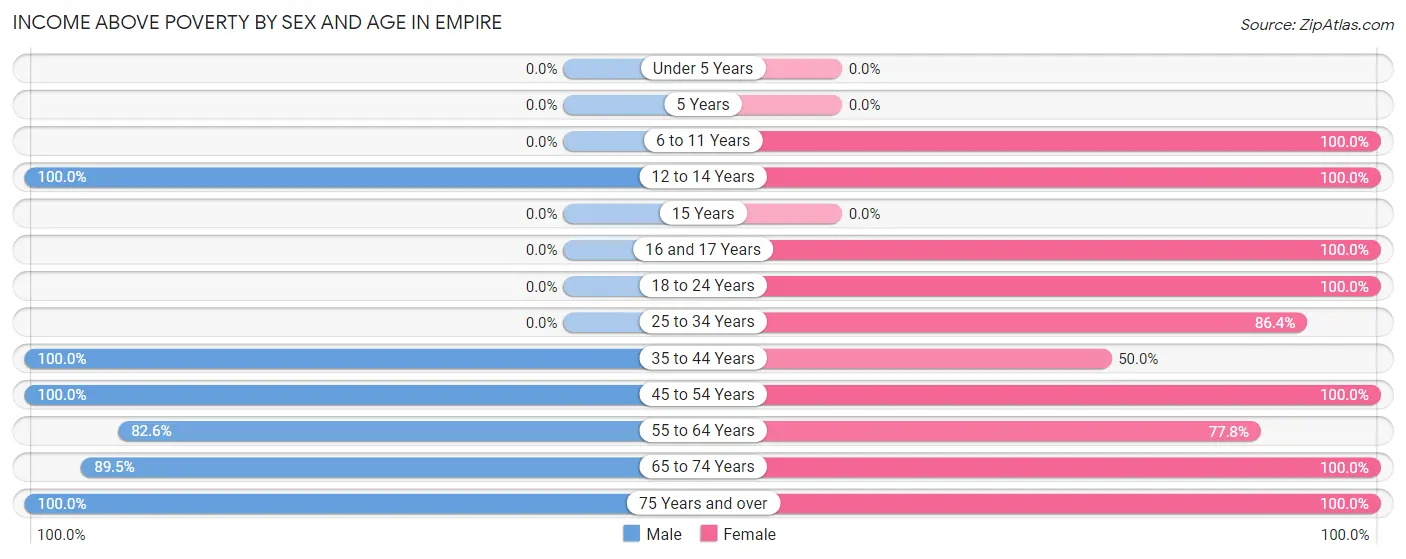
Income Above Poverty by Sex and Age in Empire
According to the poverty statistics in Empire, males aged 12 to 14 years and females aged 6 to 11 years are the age groups that are most secure financially, with 100.0% of males and 100.0% of females in these age groups living above the poverty line.
| Age Bracket | Male | Female |
| Under 5 Years | 0 (0.0%) | 0 (0.0%) |
| 5 Years | 0 (0.0%) | 0 (0.0%) |
| 6 to 11 Years | 0 (0.0%) | 8 (100.0%) |
| 12 to 14 Years | 6 (100.0%) | 26 (100.0%) |
| 15 Years | 0 (0.0%) | 0 (0.0%) |
| 16 and 17 Years | 0 (0.0%) | 3 (100.0%) |
| 18 to 24 Years | 0 (0.0%) | 9 (100.0%) |
| 25 to 34 Years | 0 (0.0%) | 19 (86.4%) |
| 35 to 44 Years | 15 (100.0%) | 11 (50.0%) |
| 45 to 54 Years | 2 (100.0%) | 5 (100.0%) |
| 55 to 64 Years | 38 (82.6%) | 28 (77.8%) |
| 65 to 74 Years | 51 (89.5%) | 42 (100.0%) |
| 75 Years and over | 36 (100.0%) | 26 (100.0%) |
| Total | 148 (78.3%) | 177 (87.2%) |
Income Below Poverty Among Married-Couple Families in Empire
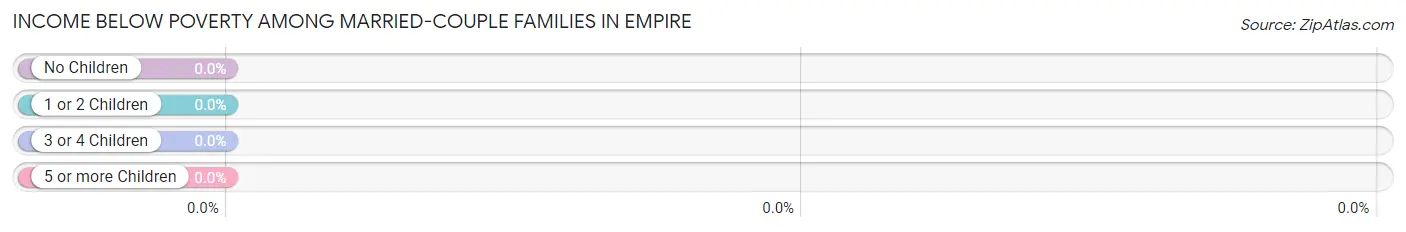
| Children | Above Poverty | Below Poverty |
| No Children | 68 (100.0%) | 0 (0.0%) |
| 1 or 2 Children | 19 (100.0%) | 0 (0.0%) |
| 3 or 4 Children | 0 (0.0%) | 0 (0.0%) |
| 5 or more Children | 0 (0.0%) | 0 (0.0%) |
| Total | 87 (100.0%) | 0 (0.0%) |
Income Below Poverty Among Single-Parent Households in Empire
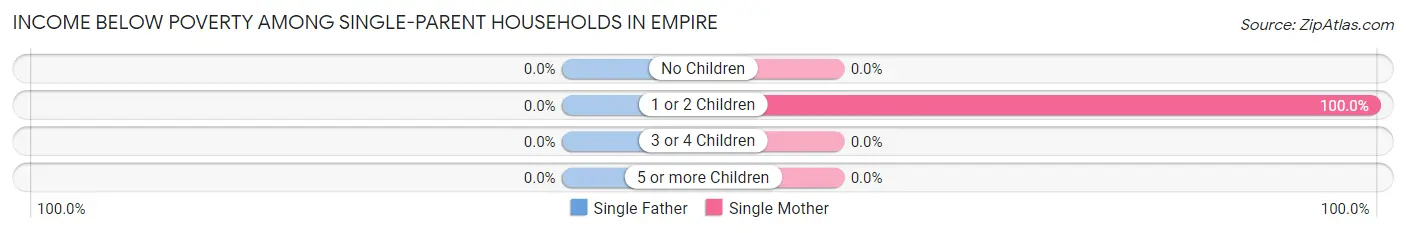
| Children | Single Father | Single Mother |
| No Children | 0 (0.0%) | 0 (0.0%) |
| 1 or 2 Children | 0 (0.0%) | 14 (100.0%) |
| 3 or 4 Children | 0 (0.0%) | 0 (0.0%) |
| 5 or more Children | 0 (0.0%) | 0 (0.0%) |
| Total | 0 (0.0%) | 14 (82.4%) |
Income Below Poverty Among Married-Couple vs Single-Parent Households in Empire
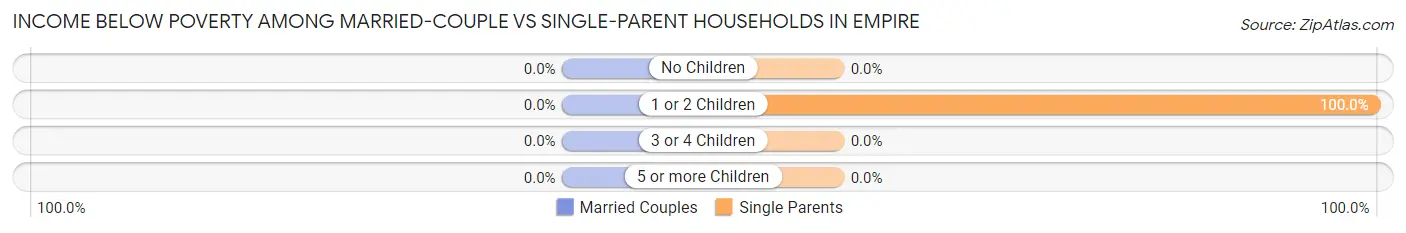
| Children | Married-Couple Families | Single-Parent Households |
| No Children | 0 (0.0%) | 0 (0.0%) |
| 1 or 2 Children | 0 (0.0%) | 14 (100.0%) |
| 3 or 4 Children | 0 (0.0%) | 0 (0.0%) |
| 5 or more Children | 0 (0.0%) | 0 (0.0%) |
| Total | 0 (0.0%) | 14 (73.7%) |
Race in Empire
The most populous races in Empire are White / Caucasian (357 | 91.1%), Two or more Races (26 | 6.6%), and Hispanic or Latino (25 | 6.4%).
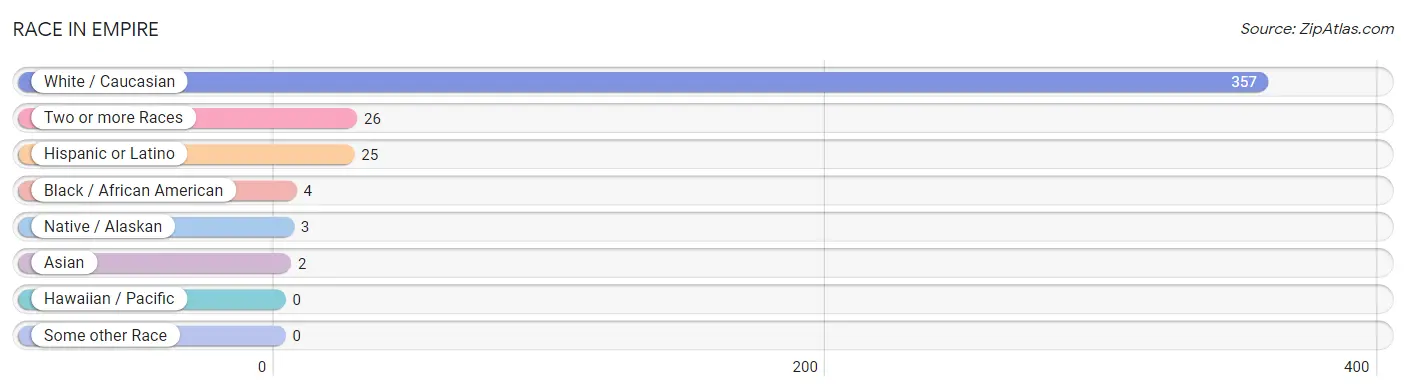
| Race | # Population | % Population |
| Asian | 2 | 0.5% |
| Black / African American | 4 | 1.0% |
| Hawaiian / Pacific | 0 | 0.0% |
| Hispanic or Latino | 25 | 6.4% |
| Native / Alaskan | 3 | 0.8% |
| White / Caucasian | 357 | 91.1% |
| Two or more Races | 26 | 6.6% |
| Some other Race | 0 | 0.0% |
| Total | 392 | 100.0% |
Ancestry in Empire
The most populous ancestries reported in Empire are German (143 | 36.5%), English (95 | 24.2%), Irish (44 | 11.2%), French (36 | 9.2%), and Mexican (25 | 6.4%), together accounting for 87.5% of all Empire residents.
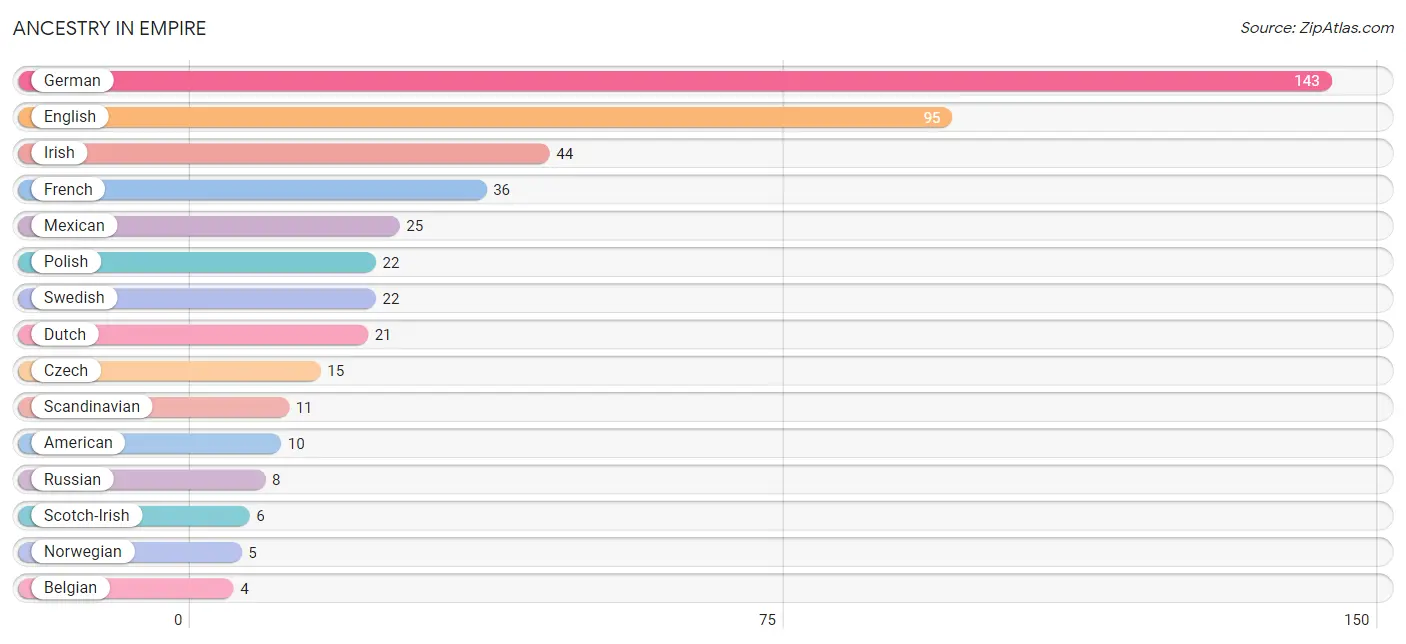
| Ancestry | # Population | % Population |
| American | 10 | 2.5% |
| Belgian | 4 | 1.0% |
| Canadian | 1 | 0.3% |
| Choctaw | 1 | 0.3% |
| Czech | 15 | 3.8% |
| Dutch | 21 | 5.4% |
| English | 95 | 24.2% |
| European | 3 | 0.8% |
| Finnish | 3 | 0.8% |
| French | 36 | 9.2% |
| French Canadian | 4 | 1.0% |
| German | 143 | 36.5% |
| Greek | 2 | 0.5% |
| Irish | 44 | 11.2% |
| Italian | 3 | 0.8% |
| Korean | 2 | 0.5% |
| Mexican | 25 | 6.4% |
| Norwegian | 5 | 1.3% |
| Ottawa | 1 | 0.3% |
| Pennsylvania German | 4 | 1.0% |
| Polish | 22 | 5.6% |
| Potawatomi | 2 | 0.5% |
| Russian | 8 | 2.0% |
| Scandinavian | 11 | 2.8% |
| Scotch-Irish | 6 | 1.5% |
| Scottish | 4 | 1.0% |
| Swedish | 22 | 5.6% |
| Swiss | 4 | 1.0% | View All 28 Rows |
Immigrants in Empire
The most numerous immigrant groups reported in Empire came from Asia (2 | 0.5%), Europe (2 | 0.5%), Netherlands (2 | 0.5%), Philippines (2 | 0.5%), and South Eastern Asia (2 | 0.5%), together accounting for 2.6% of all Empire residents.
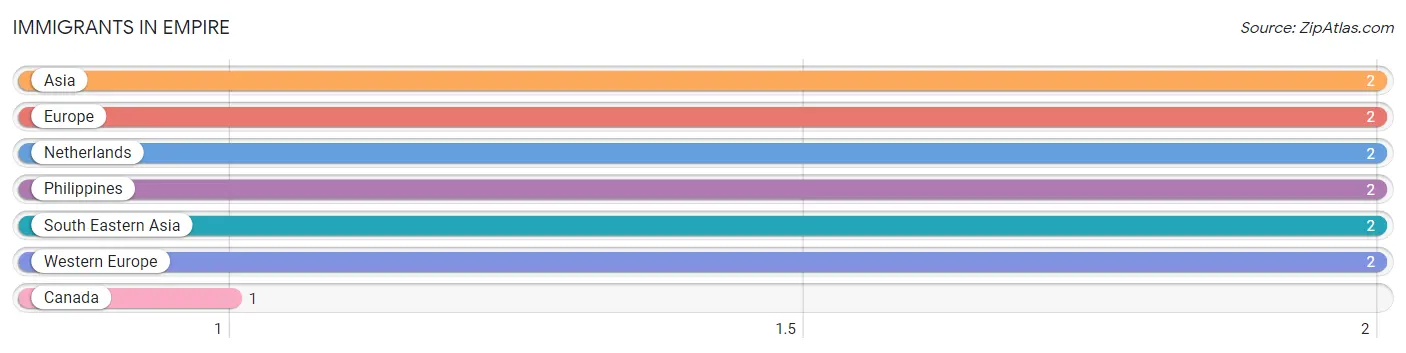
| Immigration Origin | # Population | % Population |
| Asia | 2 | 0.5% |
| Canada | 1 | 0.3% |
| Europe | 2 | 0.5% |
| Netherlands | 2 | 0.5% |
| Philippines | 2 | 0.5% |
| South Eastern Asia | 2 | 0.5% |
| Western Europe | 2 | 0.5% | View All 7 Rows |
Sex and Age in Empire
Sex and Age in Empire
The most populous age groups in Empire are 70 to 74 Years (32 | 16.9%) for men and 65 to 69 Years (34 | 16.8%) for women.
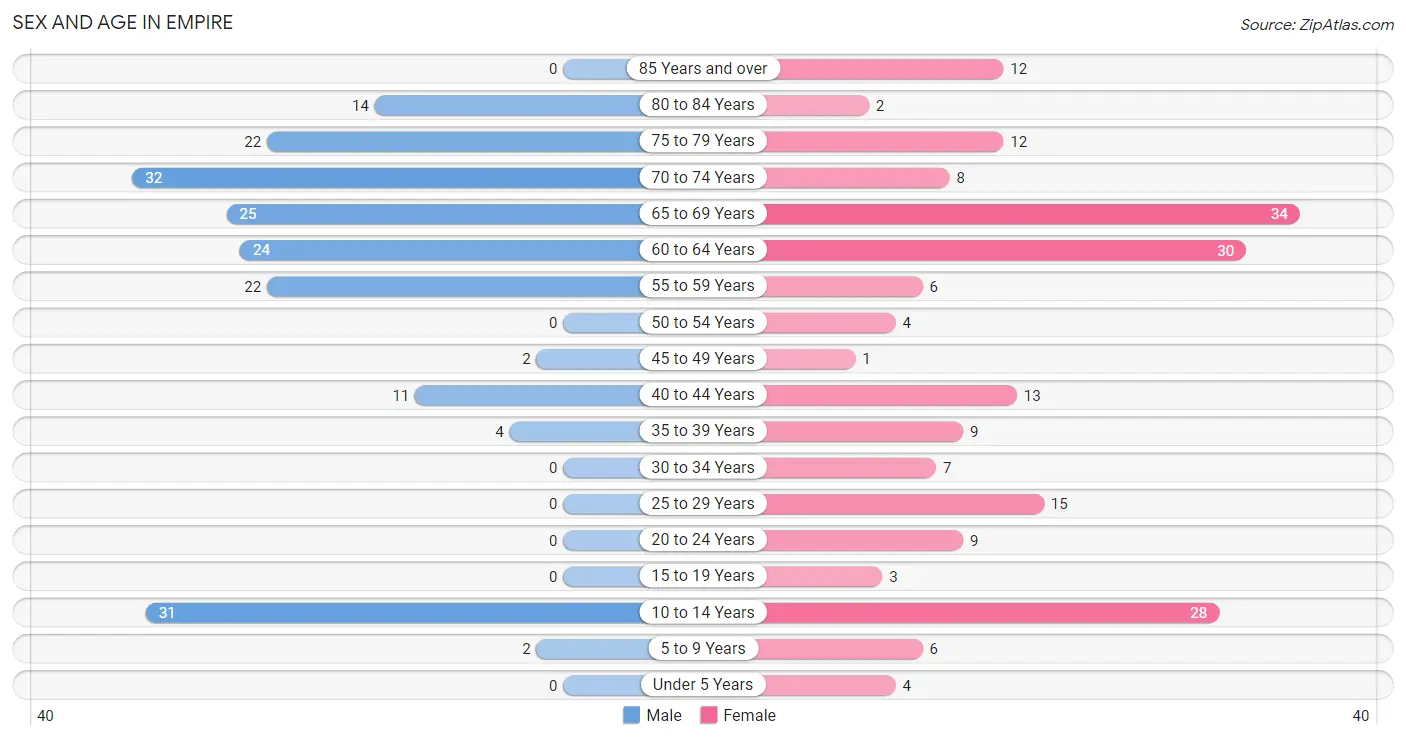
| Age Bracket | Male | Female |
| Under 5 Years | 0 (0.0%) | 4 (2.0%) |
| 5 to 9 Years | 2 (1.1%) | 6 (3.0%) |
| 10 to 14 Years | 31 (16.4%) | 28 (13.8%) |
| 15 to 19 Years | 0 (0.0%) | 3 (1.5%) |
| 20 to 24 Years | 0 (0.0%) | 9 (4.4%) |
| 25 to 29 Years | 0 (0.0%) | 15 (7.4%) |
| 30 to 34 Years | 0 (0.0%) | 7 (3.5%) |
| 35 to 39 Years | 4 (2.1%) | 9 (4.4%) |
| 40 to 44 Years | 11 (5.8%) | 13 (6.4%) |
| 45 to 49 Years | 2 (1.1%) | 1 (0.5%) |
| 50 to 54 Years | 0 (0.0%) | 4 (2.0%) |
| 55 to 59 Years | 22 (11.6%) | 6 (3.0%) |
| 60 to 64 Years | 24 (12.7%) | 30 (14.8%) |
| 65 to 69 Years | 25 (13.2%) | 34 (16.8%) |
| 70 to 74 Years | 32 (16.9%) | 8 (3.9%) |
| 75 to 79 Years | 22 (11.6%) | 12 (5.9%) |
| 80 to 84 Years | 14 (7.4%) | 2 (1.0%) |
| 85 Years and over | 0 (0.0%) | 12 (5.9%) |
| Total | 189 (100.0%) | 203 (100.0%) |
Families and Households in Empire
Median Family Size in Empire
The median family size in Empire is 2.62 persons per family, with single male/father families (2 | 1.9%) accounting for the largest median family size of 3 persons per family. On the other hand, married-couple families (87 | 82.1%) represent the smallest median family size with 2.54 persons per family.
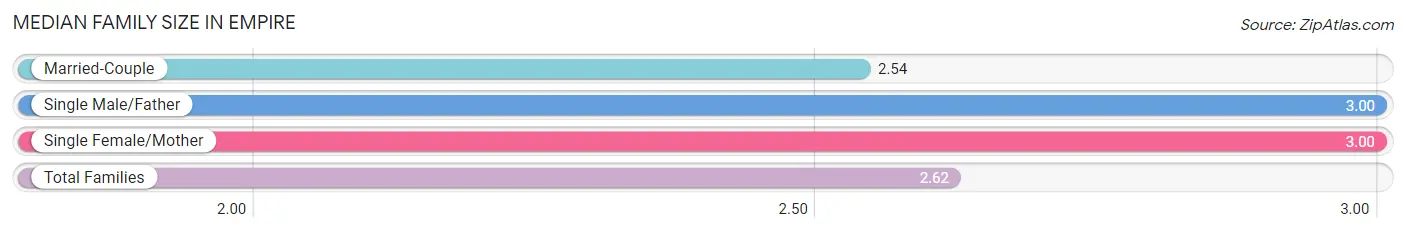
| Family Type | # Families | Family Size |
| Married-Couple | 87 (82.1%) | 2.54 |
| Single Male/Father | 2 (1.9%) | 3.00 |
| Single Female/Mother | 17 (16.0%) | 3.00 |
| Total Families | 106 (100.0%) | 2.62 |
Median Household Size in Empire
The median household size in Empire is 1.99 persons per household, with single male/father households (2 | 1.0%) accounting for the largest median household size of 5 persons per household. non-family households (91 | 46.2%) represent the smallest median household size with 1.18 persons per household.
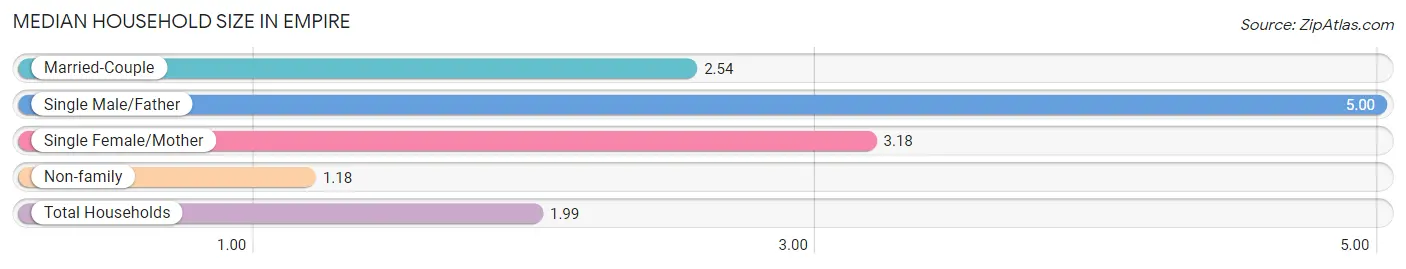
| Household Type | # Households | Household Size |
| Married-Couple | 87 (44.2%) | 2.54 |
| Single Male/Father | 2 (1.0%) | 5.00 |
| Single Female/Mother | 17 (8.6%) | 3.18 |
| Non-family | 91 (46.2%) | 1.18 |
| Total Households | 197 (100.0%) | 1.99 |
Household Size by Marriage Status in Empire
Out of a total of 197 households in Empire, 106 (53.8%) are family households, while 91 (46.2%) are nonfamily households. The most numerous type of family households are 2-person households, comprising 74, and the most common type of nonfamily households are 1-person households, comprising 73.
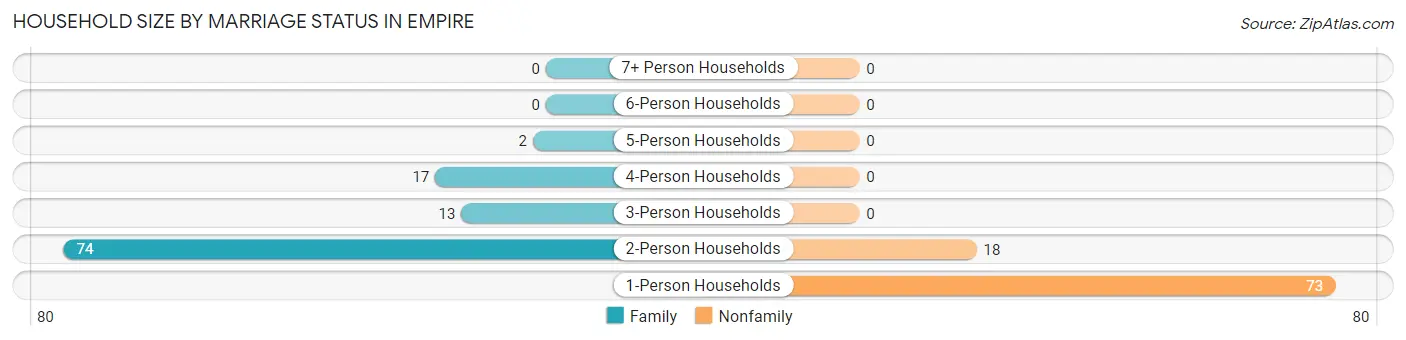
| Household Size | Family Households | Nonfamily Households |
| 1-Person Households | - | 73 (37.1%) |
| 2-Person Households | 74 (37.6%) | 18 (9.1%) |
| 3-Person Households | 13 (6.6%) | 0 (0.0%) |
| 4-Person Households | 17 (8.6%) | 0 (0.0%) |
| 5-Person Households | 2 (1.0%) | 0 (0.0%) |
| 6-Person Households | 0 (0.0%) | 0 (0.0%) |
| 7+ Person Households | 0 (0.0%) | 0 (0.0%) |
| Total | 106 (53.8%) | 91 (46.2%) |
Female Fertility in Empire
Fertility by Age in Empire
Average fertility rate in Empire is 53.0 births per 1,000 women. Women in the age bracket of 20 to 34 years have the highest fertility rate with 97.0 births per 1,000 women. Women in the age bracket of 20 to 34 years acount for 100.0% of all women with births.
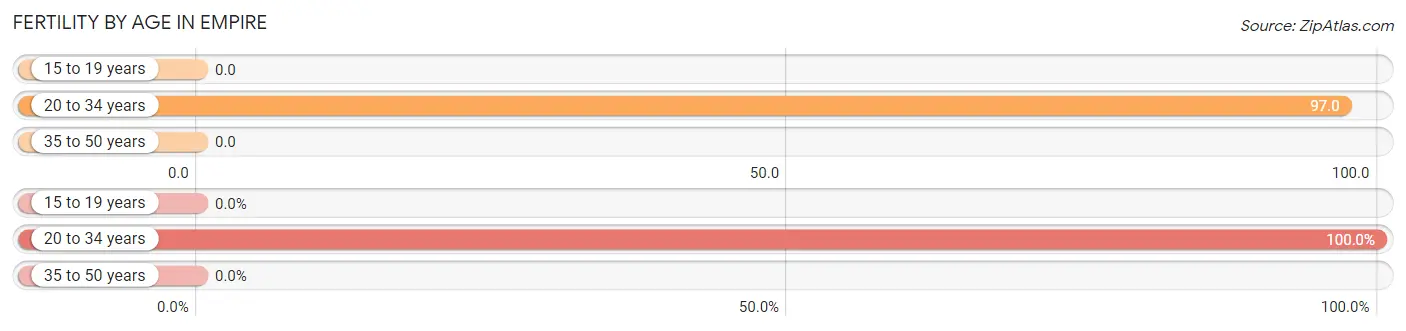
| Age Bracket | Women with Births | Births / 1,000 Women |
| 15 to 19 years | 0 (0.0%) | 0.0 |
| 20 to 34 years | 3 (100.0%) | 97.0 |
| 35 to 50 years | 0 (0.0%) | 0.0 |
| Total | 3 (100.0%) | 53.0 |
Fertility by Age by Marriage Status in Empire
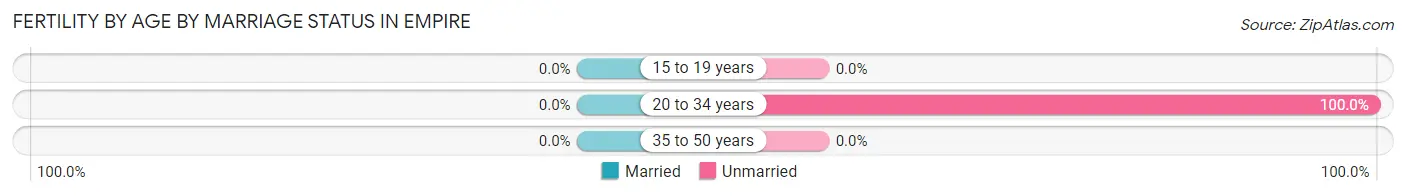
| Age Bracket | Married | Unmarried |
| 15 to 19 years | 0 (0.0%) | 0 (0.0%) |
| 20 to 34 years | 0 (0.0%) | 3 (100.0%) |
| 35 to 50 years | 0 (0.0%) | 0 (0.0%) |
| Total | 0 (0.0%) | 3 (100.0%) |
Fertility by Education in Empire
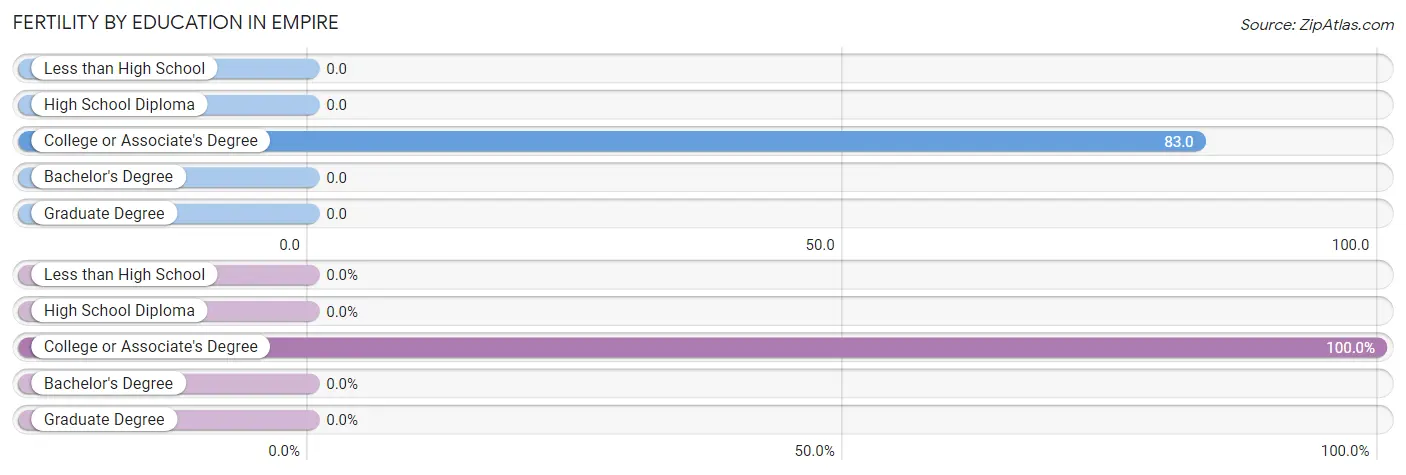
| Educational Attainment | Women with Births | Births / 1,000 Women |
| Less than High School | 0 (0.0%) | 0.0 |
| High School Diploma | 0 (0.0%) | 0.0 |
| College or Associate's Degree | 3 (100.0%) | 83.0 |
| Bachelor's Degree | 0 (0.0%) | 0.0 |
| Graduate Degree | 0 (0.0%) | 0.0 |
| Total | 3 (100.0%) | 53.0 |
Fertility by Education by Marriage Status in Empire
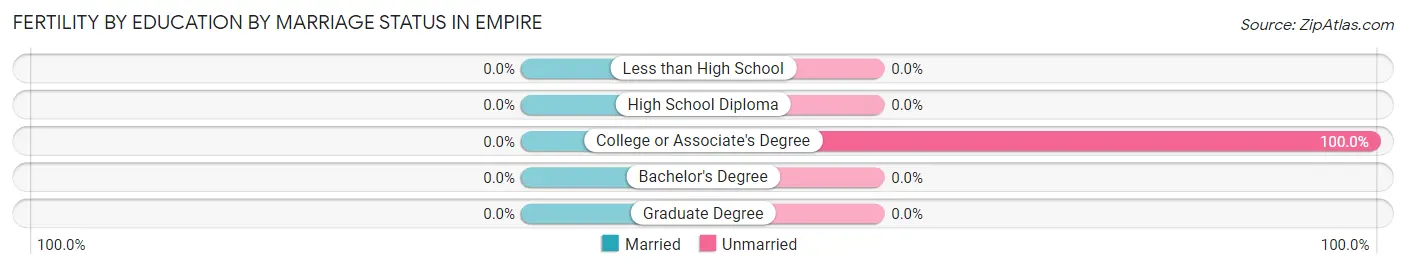
| Educational Attainment | Married | Unmarried |
| Less than High School | 0 (0.0%) | 0 (0.0%) |
| High School Diploma | 0 (0.0%) | 0 (0.0%) |
| College or Associate's Degree | 0 (0.0%) | 3 (100.0%) |
| Bachelor's Degree | 0 (0.0%) | 0 (0.0%) |
| Graduate Degree | 0 (0.0%) | 0 (0.0%) |
| Total | 0 (0.0%) | 3 (100.0%) |
Employment Characteristics in Empire
Employment by Class of Employer in Empire
Among the 146 employed individuals in Empire, private company employees (111 | 76.0%), self-employed (not incorporated) (10 | 6.9%), and not-for-profit organizations (8 | 5.5%) make up the most common classes of employment.
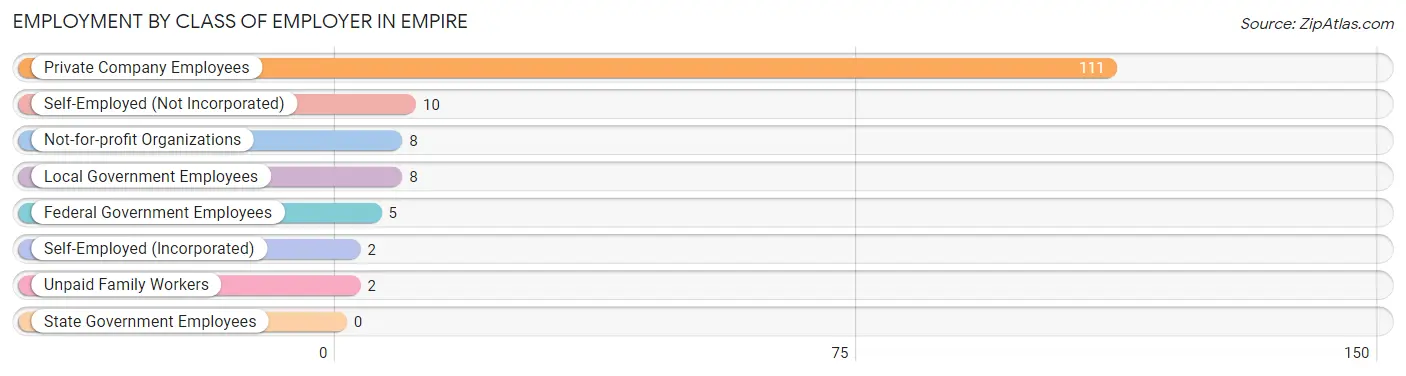
| Employer Class | # Employees | % Employees |
| Private Company Employees | 111 | 76.0% |
| Self-Employed (Incorporated) | 2 | 1.4% |
| Self-Employed (Not Incorporated) | 10 | 6.9% |
| Not-for-profit Organizations | 8 | 5.5% |
| Local Government Employees | 8 | 5.5% |
| State Government Employees | 0 | 0.0% |
| Federal Government Employees | 5 | 3.4% |
| Unpaid Family Workers | 2 | 1.4% |
| Total | 146 | 100.0% |
Employment Status by Age in Empire
According to the labor force statistics for Empire, out of the total population over 16 years of age (321), 46.7% or 150 individuals are in the labor force, with 1.3% or 2 of them unemployed. The age group with the highest labor force participation rate is 20 to 24 years, with 100.0% or 9 individuals in the labor force. Within the labor force, the 45 to 54 years age range has the highest percentage of unemployed individuals, with 40.0% or 2 of them being unemployed.
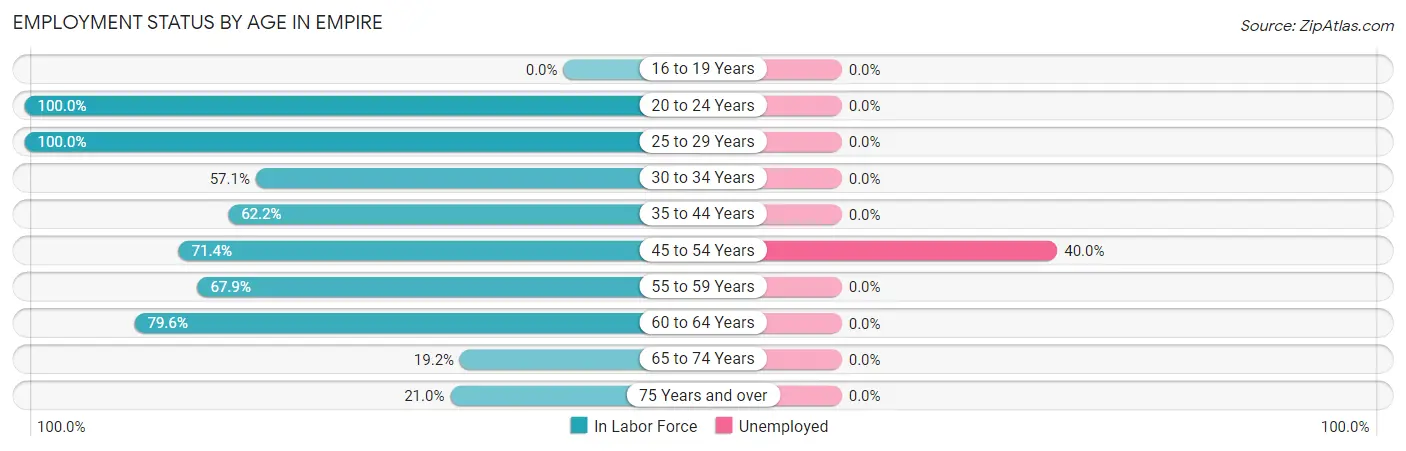
| Age Bracket | In Labor Force | Unemployed |
| 16 to 19 Years | 0 (0.0%) | 0 (0.0%) |
| 20 to 24 Years | 9 (100.0%) | 0 (0.0%) |
| 25 to 29 Years | 15 (100.0%) | 0 (0.0%) |
| 30 to 34 Years | 4 (57.1%) | 0 (0.0%) |
| 35 to 44 Years | 23 (62.2%) | 0 (0.0%) |
| 45 to 54 Years | 5 (71.4%) | 2 (40.0%) |
| 55 to 59 Years | 19 (67.9%) | 0 (0.0%) |
| 60 to 64 Years | 43 (79.6%) | 0 (0.0%) |
| 65 to 74 Years | 19 (19.2%) | 0 (0.0%) |
| 75 Years and over | 13 (21.0%) | 0 (0.0%) |
| Total | 150 (46.7%) | 2 (1.3%) |
Employment Status by Educational Attainment in Empire
According to labor force statistics for Empire, 73.6% of individuals (109) out of the total population between 25 and 64 years of age (148) are in the labor force, with 1.8% or 2 of them being unemployed. The group with the highest labor force participation rate are those with the educational attainment of bachelor's degree or higher, with 92.2% or 47 individuals in the labor force. Within the labor force, individuals with bachelor's degree or higher education have the highest percentage of unemployment, with 4.3% or 2 of them being unemployed.
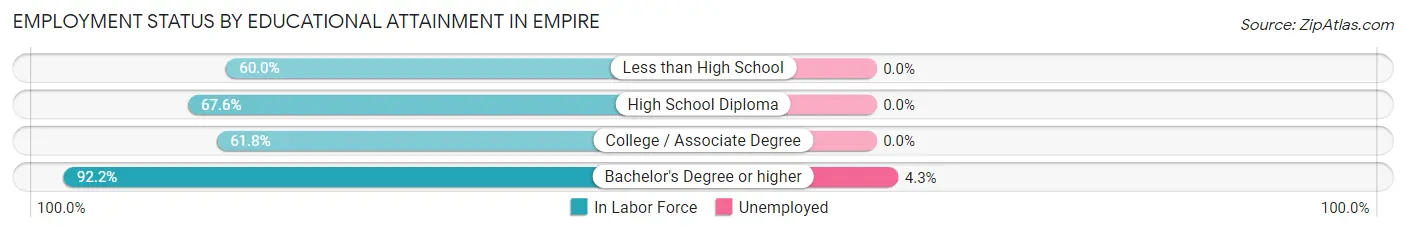
| Educational Attainment | In Labor Force | Unemployed |
| Less than High School | 3 (60.0%) | 0 (0.0%) |
| High School Diploma | 25 (67.6%) | 0 (0.0%) |
| College / Associate Degree | 34 (61.8%) | 0 (0.0%) |
| Bachelor's Degree or higher | 47 (92.2%) | 2 (4.3%) |
| Total | 109 (73.6%) | 3 (1.8%) |
Employment Occupations by Sex in Empire
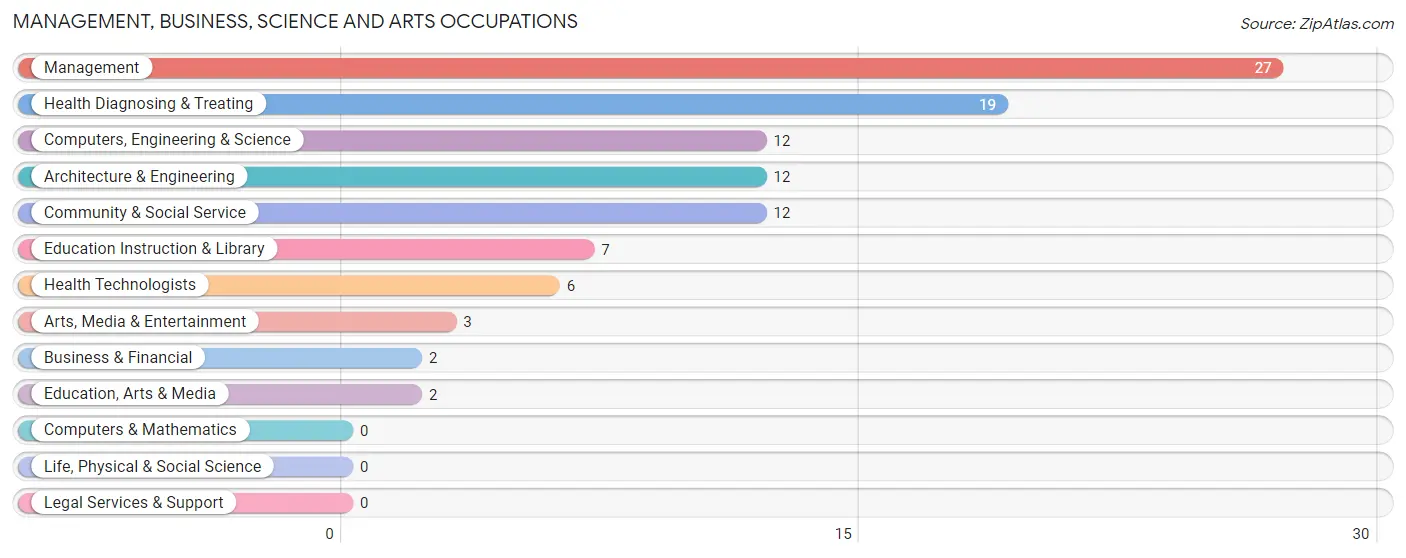
Management, Business, Science and Arts Occupations
The most common Management, Business, Science and Arts occupations in Empire are Management (27 | 18.2%), Health Diagnosing & Treating (19 | 12.8%), Computers, Engineering & Science (12 | 8.1%), Architecture & Engineering (12 | 8.1%), and Community & Social Service (12 | 8.1%).
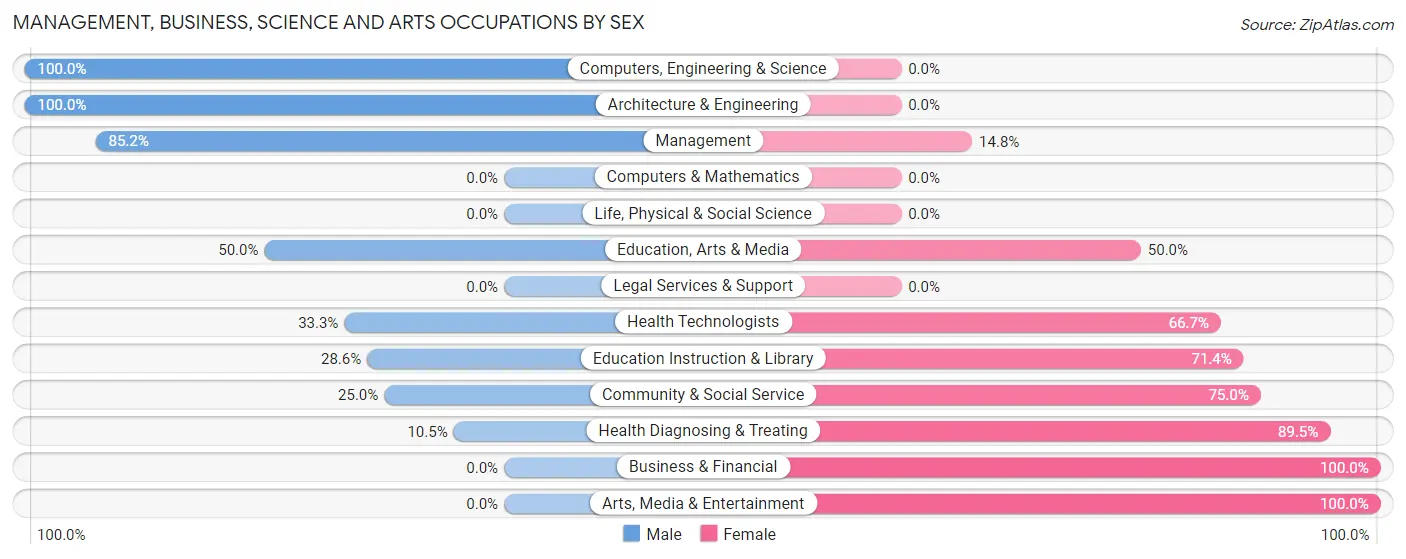
Management, Business, Science and Arts Occupations by Sex
Within the Management, Business, Science and Arts occupations in Empire, the most male-oriented occupations are Computers, Engineering & Science (100.0%), Architecture & Engineering (100.0%), and Management (85.2%), while the most female-oriented occupations are Business & Financial (100.0%), Arts, Media & Entertainment (100.0%), and Health Diagnosing & Treating (89.5%).
| Occupation | Male | Female |
| Management | 23 (85.2%) | 4 (14.8%) |
| Business & Financial | 0 (0.0%) | 2 (100.0%) |
| Computers, Engineering & Science | 12 (100.0%) | 0 (0.0%) |
| Computers & Mathematics | 0 (0.0%) | 0 (0.0%) |
| Architecture & Engineering | 12 (100.0%) | 0 (0.0%) |
| Life, Physical & Social Science | 0 (0.0%) | 0 (0.0%) |
| Community & Social Service | 3 (25.0%) | 9 (75.0%) |
| Education, Arts & Media | 1 (50.0%) | 1 (50.0%) |
| Legal Services & Support | 0 (0.0%) | 0 (0.0%) |
| Education Instruction & Library | 2 (28.6%) | 5 (71.4%) |
| Arts, Media & Entertainment | 0 (0.0%) | 3 (100.0%) |
| Health Diagnosing & Treating | 2 (10.5%) | 17 (89.5%) |
| Health Technologists | 2 (33.3%) | 4 (66.7%) |
| Total (Category) | 40 (55.6%) | 32 (44.4%) |
| Total (Overall) | 72 (48.6%) | 76 (51.3%) |
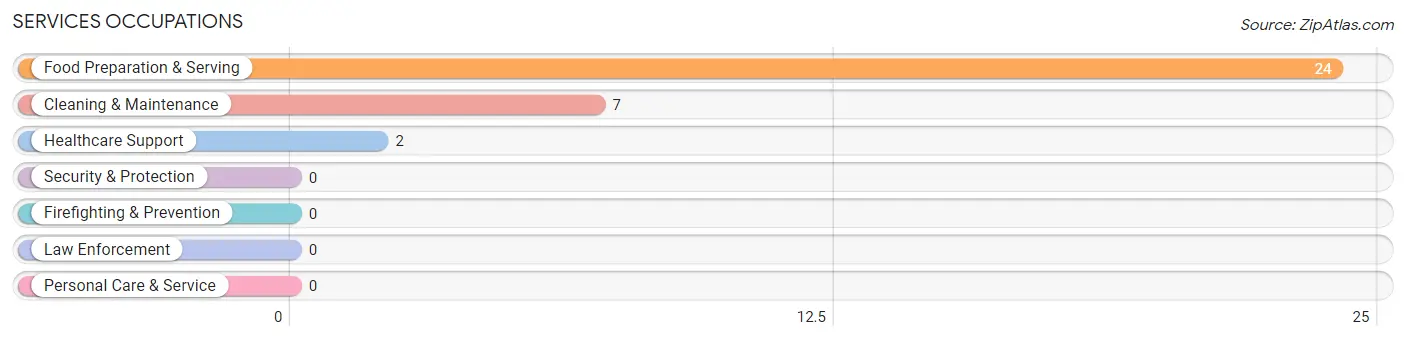
Services Occupations
The most common Services occupations in Empire are Food Preparation & Serving (24 | 16.2%), Cleaning & Maintenance (7 | 4.7%), and Healthcare Support (2 | 1.3%).
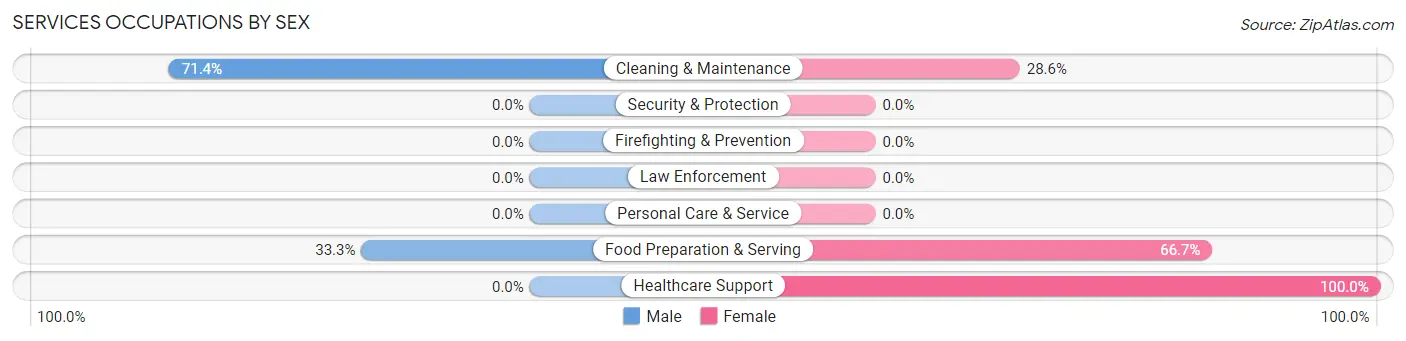
Services Occupations by Sex
Within the Services occupations in Empire, the most male-oriented occupations are Cleaning & Maintenance (71.4%), and Food Preparation & Serving (33.3%), while the most female-oriented occupations are Healthcare Support (100.0%), Food Preparation & Serving (66.7%), and Cleaning & Maintenance (28.6%).
| Occupation | Male | Female |
| Healthcare Support | 0 (0.0%) | 2 (100.0%) |
| Security & Protection | 0 (0.0%) | 0 (0.0%) |
| Firefighting & Prevention | 0 (0.0%) | 0 (0.0%) |
| Law Enforcement | 0 (0.0%) | 0 (0.0%) |
| Food Preparation & Serving | 8 (33.3%) | 16 (66.7%) |
| Cleaning & Maintenance | 5 (71.4%) | 2 (28.6%) |
| Personal Care & Service | 0 (0.0%) | 0 (0.0%) |
| Total (Category) | 13 (39.4%) | 20 (60.6%) |
| Total (Overall) | 72 (48.6%) | 76 (51.3%) |
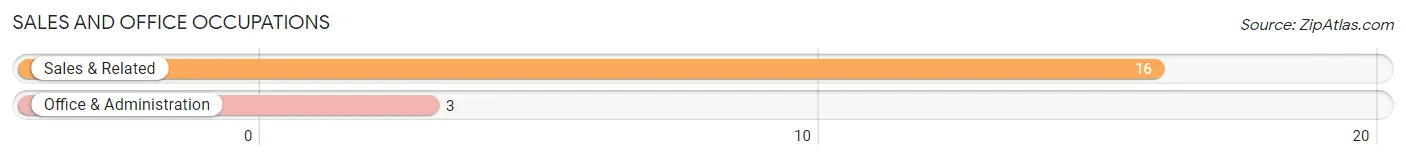
Sales and Office Occupations
The most common Sales and Office occupations in Empire are Sales & Related (16 | 10.8%), and Office & Administration (3 | 2.0%).
Sales and Office Occupations by Sex
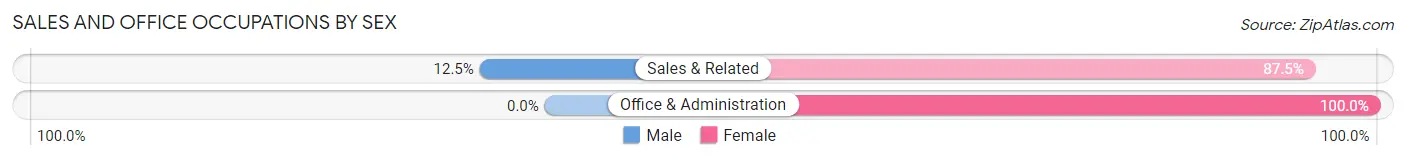
| Occupation | Male | Female |
| Sales & Related | 2 (12.5%) | 14 (87.5%) |
| Office & Administration | 0 (0.0%) | 3 (100.0%) |
| Total (Category) | 2 (10.5%) | 17 (89.5%) |
| Total (Overall) | 72 (48.6%) | 76 (51.3%) |
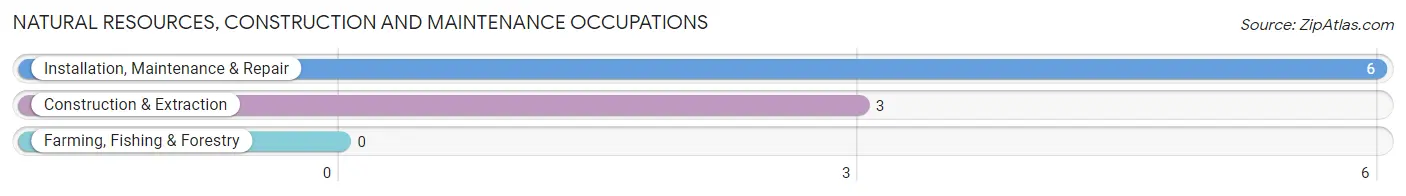
Natural Resources, Construction and Maintenance Occupations
The most common Natural Resources, Construction and Maintenance occupations in Empire are Installation, Maintenance & Repair (6 | 4.1%), and Construction & Extraction (3 | 2.0%).
Natural Resources, Construction and Maintenance Occupations by Sex
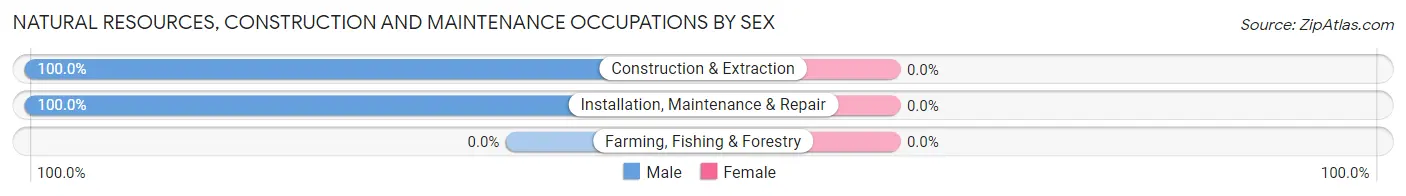
| Occupation | Male | Female |
| Farming, Fishing & Forestry | 0 (0.0%) | 0 (0.0%) |
| Construction & Extraction | 3 (100.0%) | 0 (0.0%) |
| Installation, Maintenance & Repair | 6 (100.0%) | 0 (0.0%) |
| Total (Category) | 9 (100.0%) | 0 (0.0%) |
| Total (Overall) | 72 (48.6%) | 76 (51.3%) |
Production, Transportation and Moving Occupations
The most common Production, Transportation and Moving occupations in Empire are Production (9 | 6.1%), and Material Moving (6 | 4.1%).
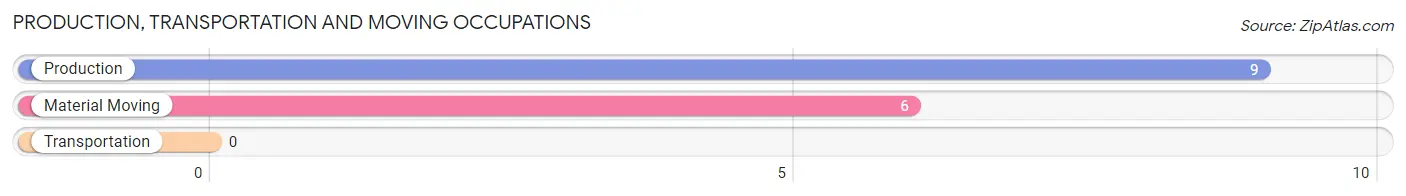
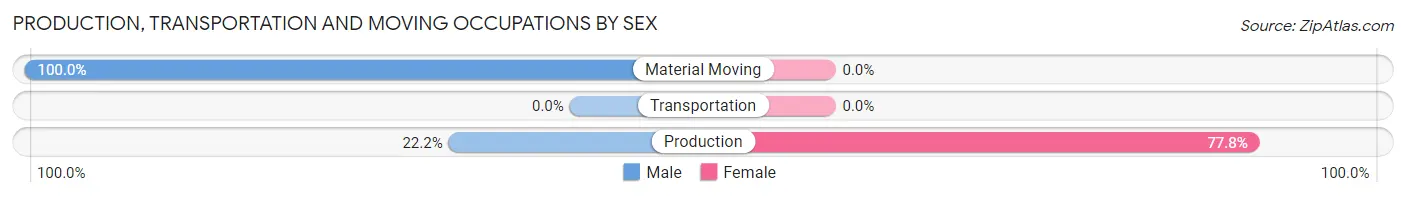
Production, Transportation and Moving Occupations by Sex
| Occupation | Male | Female |
| Production | 2 (22.2%) | 7 (77.8%) |
| Transportation | 0 (0.0%) | 0 (0.0%) |
| Material Moving | 6 (100.0%) | 0 (0.0%) |
| Total (Category) | 8 (53.3%) | 7 (46.7%) |
| Total (Overall) | 72 (48.6%) | 76 (51.3%) |
Employment Industries by Sex in Empire
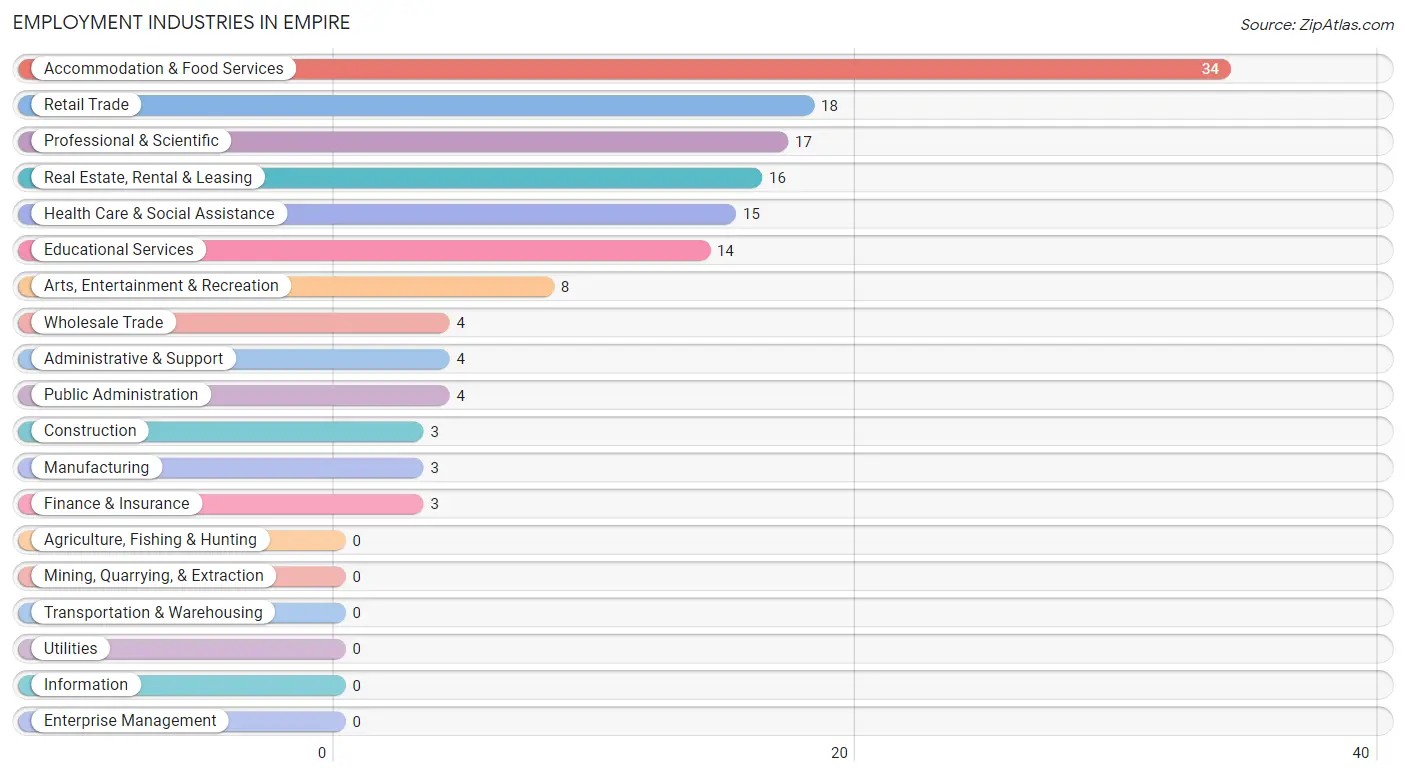
Employment Industries in Empire
The major employment industries in Empire include Accommodation & Food Services (34 | 23.0%), Retail Trade (18 | 12.2%), Professional & Scientific (17 | 11.5%), Real Estate, Rental & Leasing (16 | 10.8%), and Health Care & Social Assistance (15 | 10.1%).
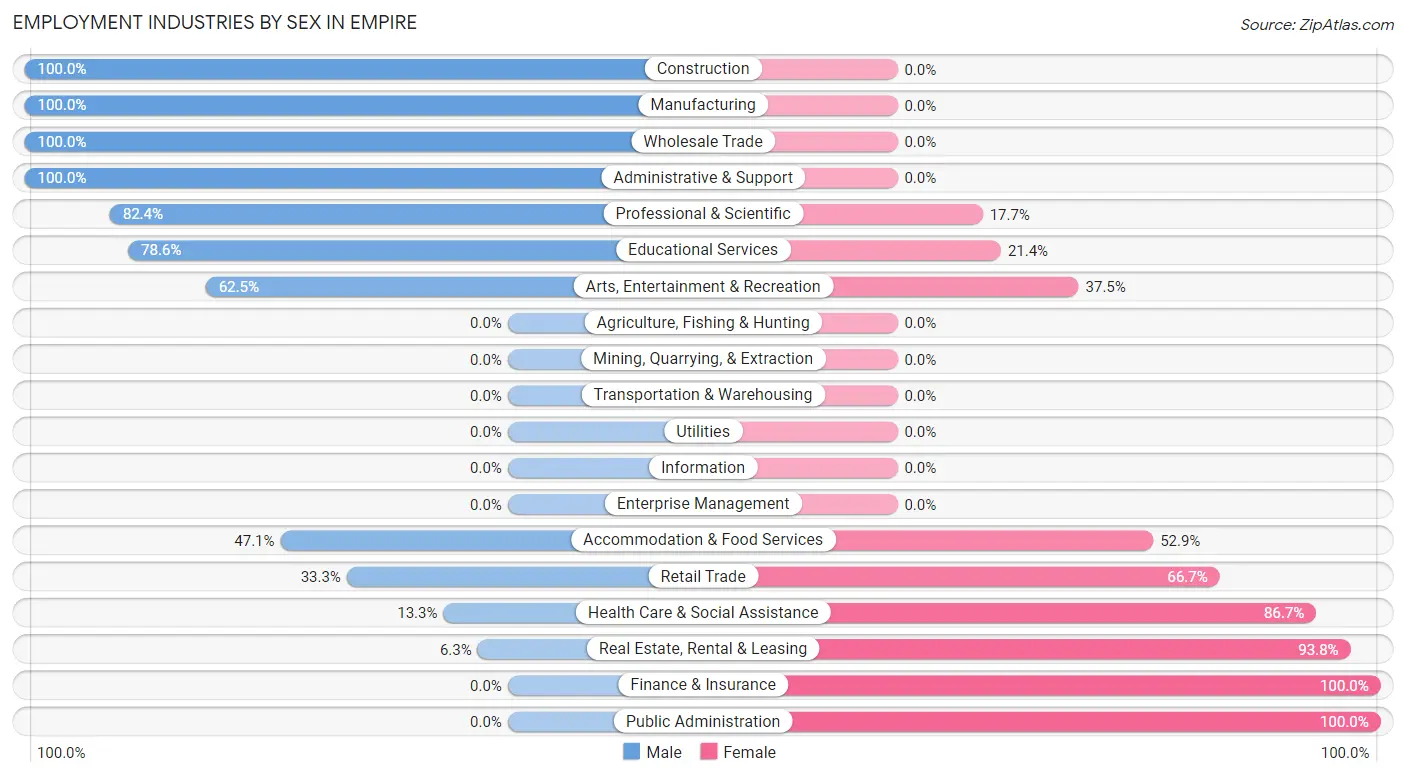
Employment Industries by Sex in Empire
The Empire industries that see more men than women are Construction (100.0%), Manufacturing (100.0%), and Wholesale Trade (100.0%), whereas the industries that tend to have a higher number of women are Finance & Insurance (100.0%), Public Administration (100.0%), and Real Estate, Rental & Leasing (93.8%).
| Industry | Male | Female |
| Agriculture, Fishing & Hunting | 0 (0.0%) | 0 (0.0%) |
| Mining, Quarrying, & Extraction | 0 (0.0%) | 0 (0.0%) |
| Construction | 3 (100.0%) | 0 (0.0%) |
| Manufacturing | 3 (100.0%) | 0 (0.0%) |
| Wholesale Trade | 4 (100.0%) | 0 (0.0%) |
| Retail Trade | 6 (33.3%) | 12 (66.7%) |
| Transportation & Warehousing | 0 (0.0%) | 0 (0.0%) |
| Utilities | 0 (0.0%) | 0 (0.0%) |
| Information | 0 (0.0%) | 0 (0.0%) |
| Finance & Insurance | 0 (0.0%) | 3 (100.0%) |
| Real Estate, Rental & Leasing | 1 (6.2%) | 15 (93.8%) |
| Professional & Scientific | 14 (82.4%) | 3 (17.6%) |
| Enterprise Management | 0 (0.0%) | 0 (0.0%) |
| Administrative & Support | 4 (100.0%) | 0 (0.0%) |
| Educational Services | 11 (78.6%) | 3 (21.4%) |
| Health Care & Social Assistance | 2 (13.3%) | 13 (86.7%) |
| Arts, Entertainment & Recreation | 5 (62.5%) | 3 (37.5%) |
| Accommodation & Food Services | 16 (47.1%) | 18 (52.9%) |
| Public Administration | 0 (0.0%) | 4 (100.0%) |
| Total | 72 (48.6%) | 76 (51.3%) |
Education in Empire
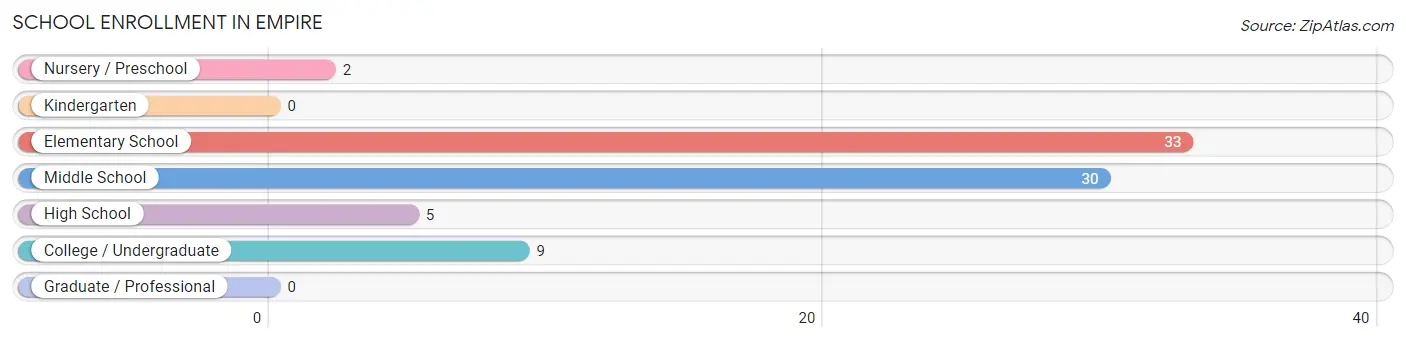
School Enrollment in Empire
The most common levels of schooling among the 79 students in Empire are elementary school (33 | 41.8%), middle school (30 | 38.0%), and college / undergraduate (9 | 11.4%).
| School Level | # Students | % Students |
| Nursery / Preschool | 2 | 2.5% |
| Kindergarten | 0 | 0.0% |
| Elementary School | 33 | 41.8% |
| Middle School | 30 | 38.0% |
| High School | 5 | 6.3% |
| College / Undergraduate | 9 | 11.4% |
| Graduate / Professional | 0 | 0.0% |
| Total | 79 | 100.0% |
School Enrollment by Age by Funding Source in Empire
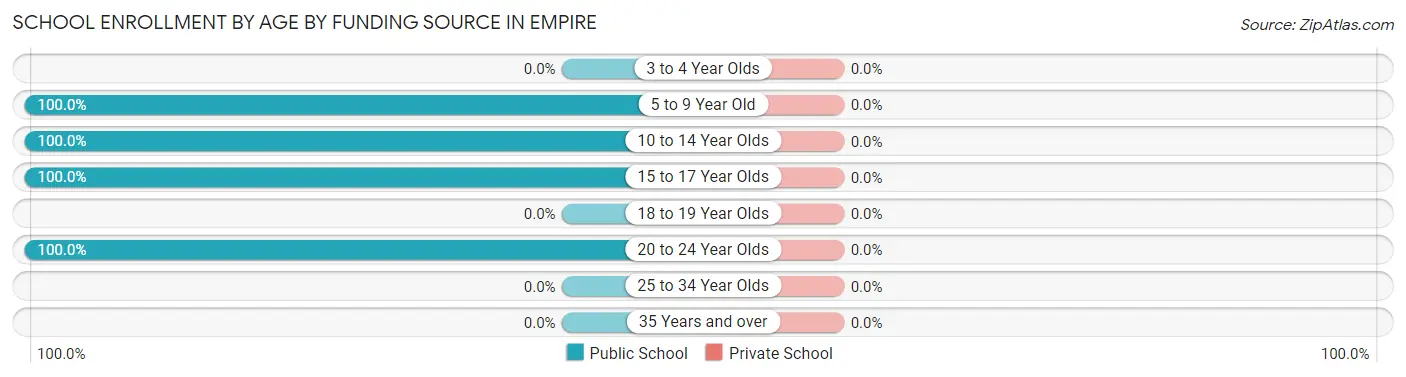
| Age Bracket | Public School | Private School |
| 3 to 4 Year Olds | 0 (0.0%) | 0 (0.0%) |
| 5 to 9 Year Old | 8 (100.0%) | 0 (0.0%) |
| 10 to 14 Year Olds | 59 (100.0%) | 0 (0.0%) |
| 15 to 17 Year Olds | 3 (100.0%) | 0 (0.0%) |
| 18 to 19 Year Olds | 0 (0.0%) | 0 (0.0%) |
| 20 to 24 Year Olds | 9 (100.0%) | 0 (0.0%) |
| 25 to 34 Year Olds | 0 (0.0%) | 0 (0.0%) |
| 35 Years and over | 0 (0.0%) | 0 (0.0%) |
| Total | 79 (100.0%) | 0 (0.0%) |
Educational Attainment by Field of Study in Empire
Education (34 | 20.7%), science & technology (27 | 16.5%), business (27 | 16.5%), social sciences (22 | 13.4%), and arts & humanities (20 | 12.2%) are the most common fields of study among 164 individuals in Empire who have obtained a bachelor's degree or higher.
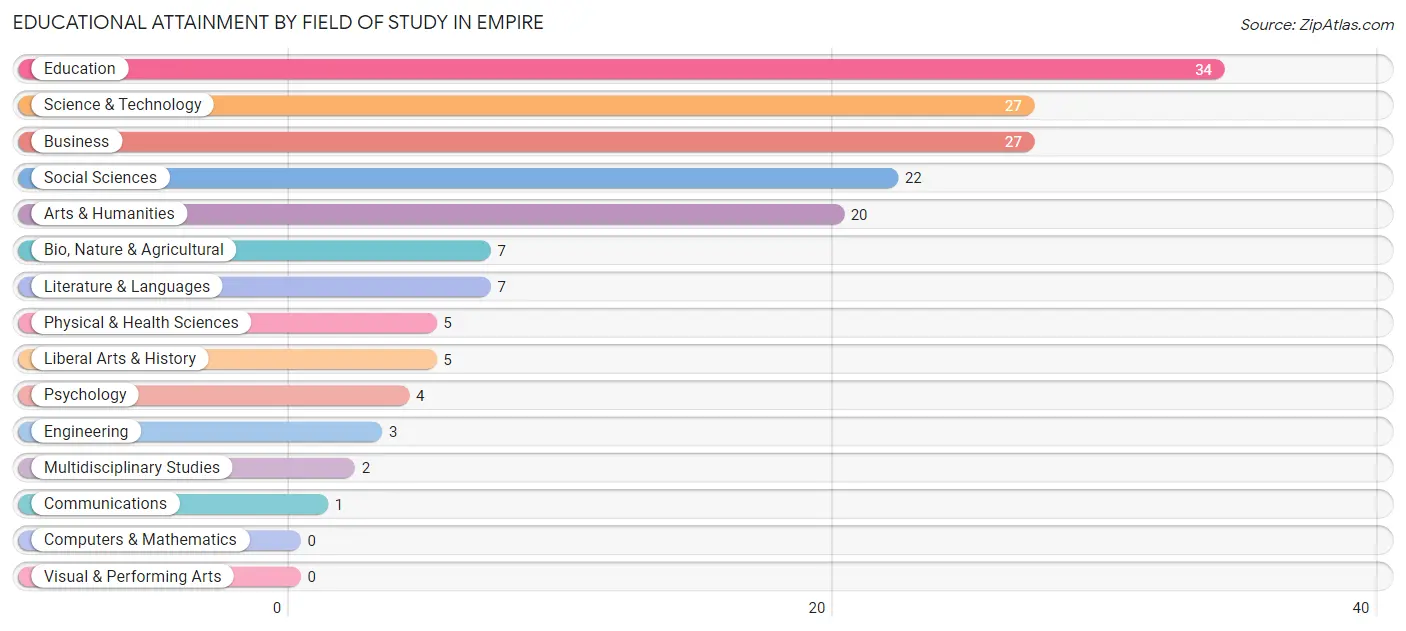
| Field of Study | # Graduates | % Graduates |
| Computers & Mathematics | 0 | 0.0% |
| Bio, Nature & Agricultural | 7 | 4.3% |
| Physical & Health Sciences | 5 | 3.0% |
| Psychology | 4 | 2.4% |
| Social Sciences | 22 | 13.4% |
| Engineering | 3 | 1.8% |
| Multidisciplinary Studies | 2 | 1.2% |
| Science & Technology | 27 | 16.5% |
| Business | 27 | 16.5% |
| Education | 34 | 20.7% |
| Literature & Languages | 7 | 4.3% |
| Liberal Arts & History | 5 | 3.0% |
| Visual & Performing Arts | 0 | 0.0% |
| Communications | 1 | 0.6% |
| Arts & Humanities | 20 | 12.2% |
| Total | 164 | 100.0% |
Transportation & Commute in Empire
Vehicle Availability by Sex in Empire
The most prevalent vehicle ownership categories in Empire are males with 3 vehicles (43, accounting for 61.4%) and females with 3 vehicles (27, making up 56.6%).
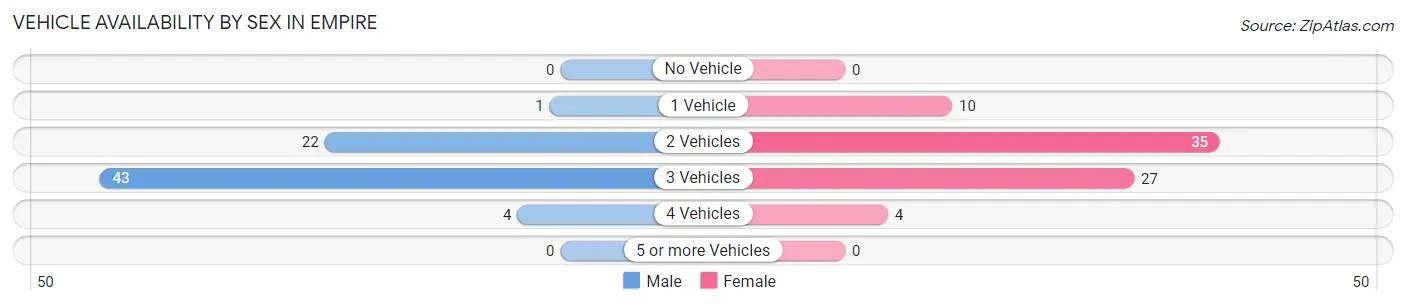
| Vehicles Available | Male | Female |
| No Vehicle | 0 (0.0%) | 0 (0.0%) |
| 1 Vehicle | 1 (1.4%) | 10 (13.2%) |
| 2 Vehicles | 22 (31.4%) | 35 (46.1%) |
| 3 Vehicles | 43 (61.4%) | 27 (35.5%) |
| 4 Vehicles | 4 (5.7%) | 4 (5.3%) |
| 5 or more Vehicles | 0 (0.0%) | 0 (0.0%) |
| Total | 70 (100.0%) | 76 (100.0%) |
Commute Time in Empire
The most frequently occuring commute durations in Empire are 5 to 9 minutes (22 commuters, 19.1%), 45 to 59 minutes (21 commuters, 18.3%), and 30 to 34 minutes (20 commuters, 17.4%).
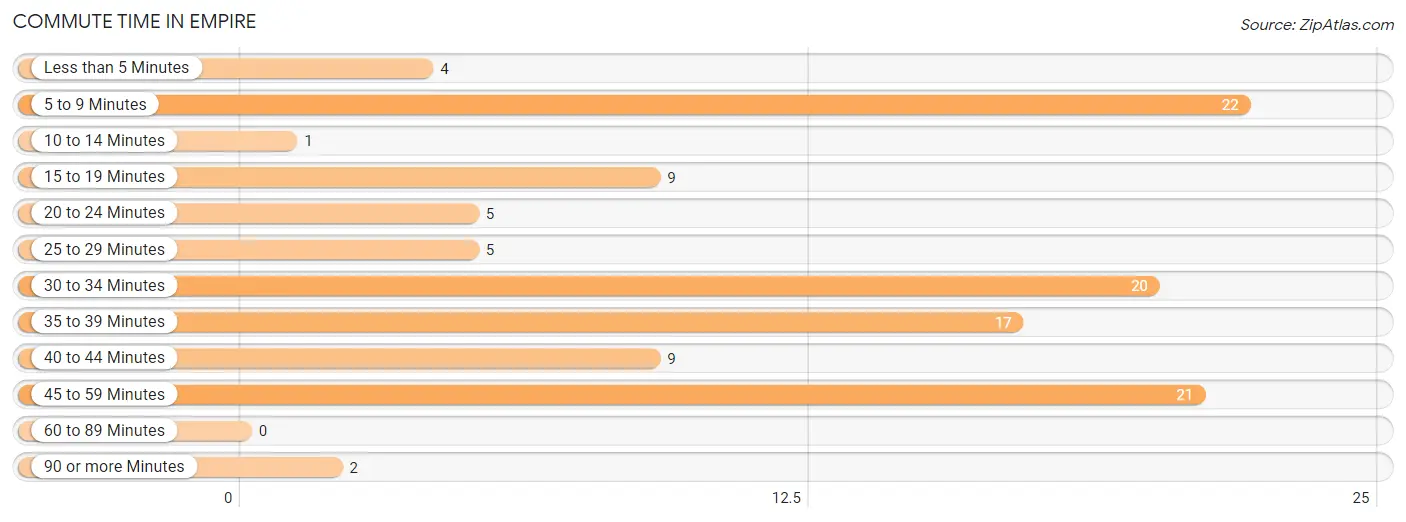
| Commute Time | # Commuters | % Commuters |
| Less than 5 Minutes | 4 | 3.5% |
| 5 to 9 Minutes | 22 | 19.1% |
| 10 to 14 Minutes | 1 | 0.9% |
| 15 to 19 Minutes | 9 | 7.8% |
| 20 to 24 Minutes | 5 | 4.3% |
| 25 to 29 Minutes | 5 | 4.3% |
| 30 to 34 Minutes | 20 | 17.4% |
| 35 to 39 Minutes | 17 | 14.8% |
| 40 to 44 Minutes | 9 | 7.8% |
| 45 to 59 Minutes | 21 | 18.3% |
| 60 to 89 Minutes | 0 | 0.0% |
| 90 or more Minutes | 2 | 1.7% |
Commute Time by Sex in Empire
The most common commute times in Empire are 30 to 34 minutes (11 commuters, 20.4%) for males and 45 to 59 minutes (21 commuters, 34.4%) for females.
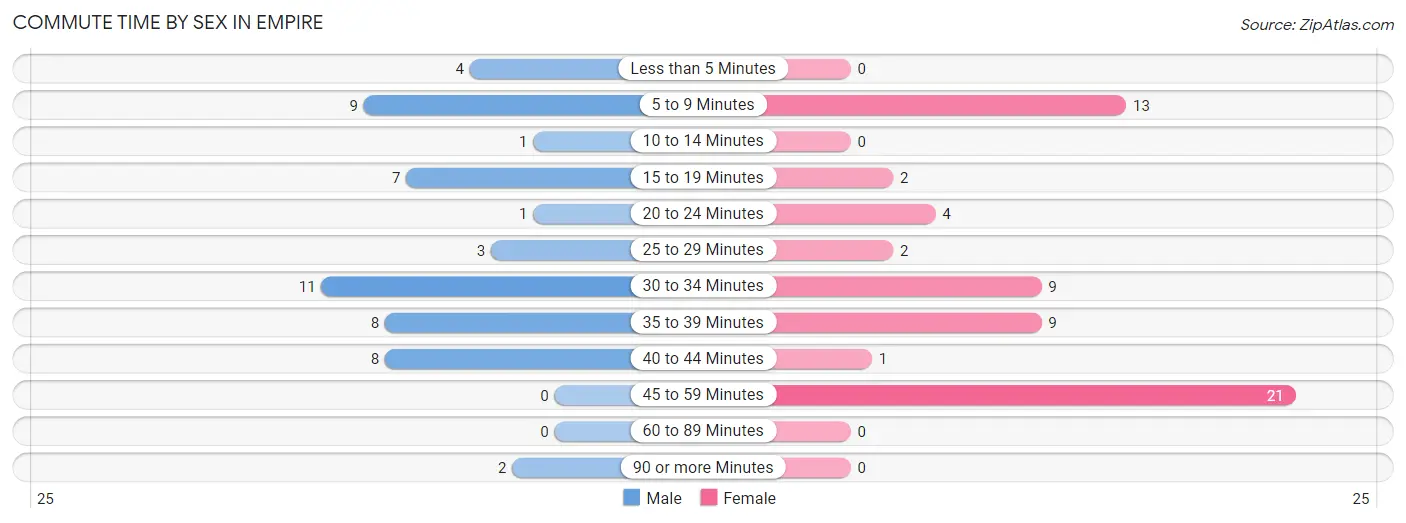
| Commute Time | Male | Female |
| Less than 5 Minutes | 4 (7.4%) | 0 (0.0%) |
| 5 to 9 Minutes | 9 (16.7%) | 13 (21.3%) |
| 10 to 14 Minutes | 1 (1.8%) | 0 (0.0%) |
| 15 to 19 Minutes | 7 (13.0%) | 2 (3.3%) |
| 20 to 24 Minutes | 1 (1.8%) | 4 (6.6%) |
| 25 to 29 Minutes | 3 (5.6%) | 2 (3.3%) |
| 30 to 34 Minutes | 11 (20.4%) | 9 (14.7%) |
| 35 to 39 Minutes | 8 (14.8%) | 9 (14.7%) |
| 40 to 44 Minutes | 8 (14.8%) | 1 (1.6%) |
| 45 to 59 Minutes | 0 (0.0%) | 21 (34.4%) |
| 60 to 89 Minutes | 0 (0.0%) | 0 (0.0%) |
| 90 or more Minutes | 2 (3.7%) | 0 (0.0%) |
Time of Departure to Work by Sex in Empire
The most frequent times of departure to work in Empire are 10:00 AM to 10:59 AM (19, 35.2%) for males and 12:00 PM to 3:59 PM (11, 18.0%) for females.
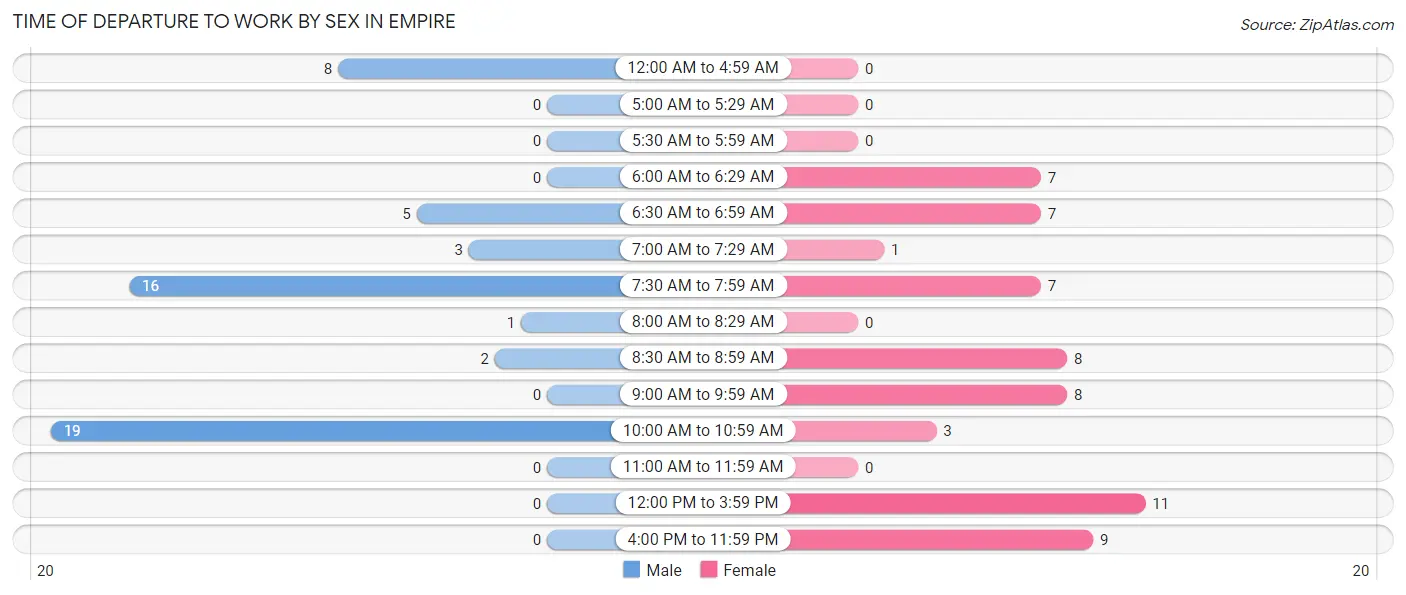
| Time of Departure | Male | Female |
| 12:00 AM to 4:59 AM | 8 (14.8%) | 0 (0.0%) |
| 5:00 AM to 5:29 AM | 0 (0.0%) | 0 (0.0%) |
| 5:30 AM to 5:59 AM | 0 (0.0%) | 0 (0.0%) |
| 6:00 AM to 6:29 AM | 0 (0.0%) | 7 (11.5%) |
| 6:30 AM to 6:59 AM | 5 (9.3%) | 7 (11.5%) |
| 7:00 AM to 7:29 AM | 3 (5.6%) | 1 (1.6%) |
| 7:30 AM to 7:59 AM | 16 (29.6%) | 7 (11.5%) |
| 8:00 AM to 8:29 AM | 1 (1.8%) | 0 (0.0%) |
| 8:30 AM to 8:59 AM | 2 (3.7%) | 8 (13.1%) |
| 9:00 AM to 9:59 AM | 0 (0.0%) | 8 (13.1%) |
| 10:00 AM to 10:59 AM | 19 (35.2%) | 3 (4.9%) |
| 11:00 AM to 11:59 AM | 0 (0.0%) | 0 (0.0%) |
| 12:00 PM to 3:59 PM | 0 (0.0%) | 11 (18.0%) |
| 4:00 PM to 11:59 PM | 0 (0.0%) | 9 (14.7%) |
| Total | 54 (100.0%) | 61 (100.0%) |
Housing Occupancy in Empire
Occupancy by Ownership in Empire
Of the total 197 dwellings in Empire, owner-occupied units account for 146 (74.1%), while renter-occupied units make up 51 (25.9%).
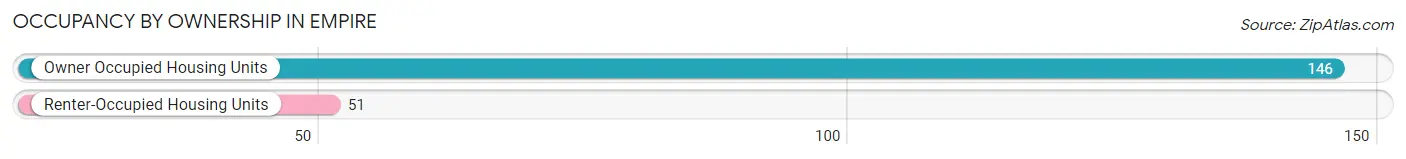
| Occupancy | # Housing Units | % Housing Units |
| Owner Occupied Housing Units | 146 | 74.1% |
| Renter-Occupied Housing Units | 51 | 25.9% |
| Total Occupied Housing Units | 197 | 100.0% |
Occupancy by Household Size in Empire
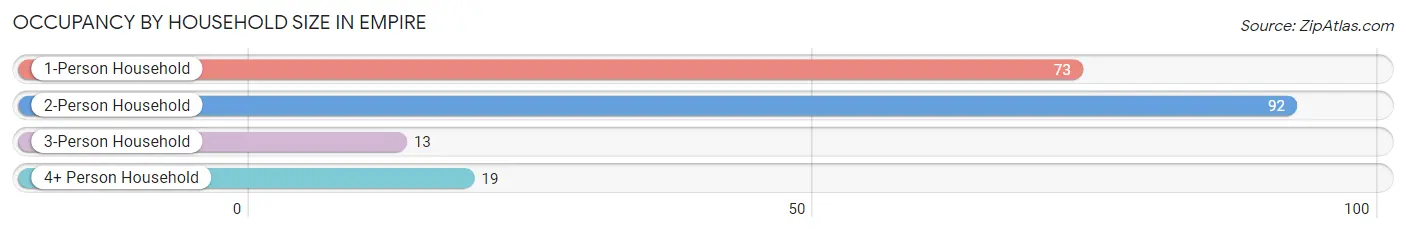
| Household Size | # Housing Units | % Housing Units |
| 1-Person Household | 73 | 37.1% |
| 2-Person Household | 92 | 46.7% |
| 3-Person Household | 13 | 6.6% |
| 4+ Person Household | 19 | 9.6% |
| Total Housing Units | 197 | 100.0% |
Occupancy by Ownership by Household Size in Empire
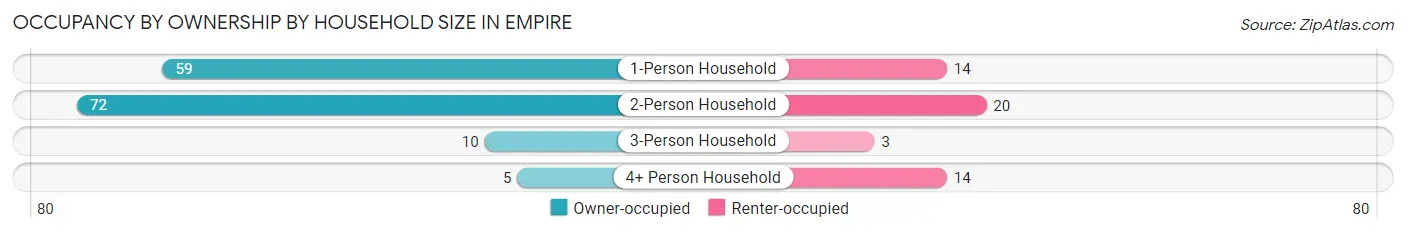
| Household Size | Owner-occupied | Renter-occupied |
| 1-Person Household | 59 (80.8%) | 14 (19.2%) |
| 2-Person Household | 72 (78.3%) | 20 (21.7%) |
| 3-Person Household | 10 (76.9%) | 3 (23.1%) |
| 4+ Person Household | 5 (26.3%) | 14 (73.7%) |
| Total Housing Units | 146 (74.1%) | 51 (25.9%) |
Occupancy by Educational Attainment in Empire
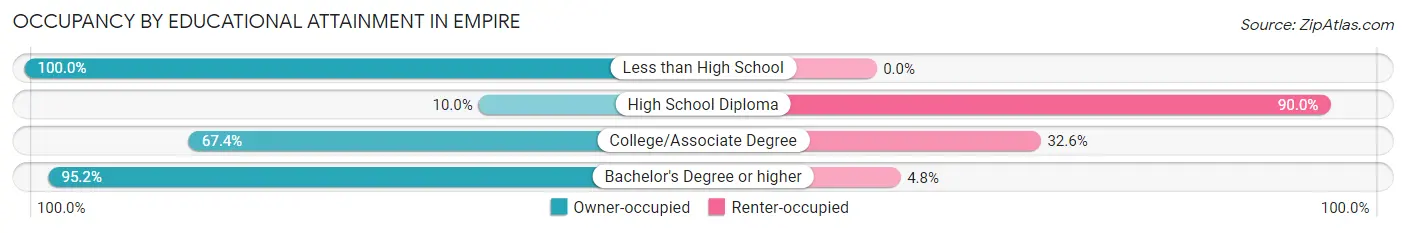
| Household Size | Owner-occupied | Renter-occupied |
| Less than High School | 4 (100.0%) | 0 (0.0%) |
| High School Diploma | 2 (10.0%) | 18 (90.0%) |
| College/Associate Degree | 60 (67.4%) | 29 (32.6%) |
| Bachelor's Degree or higher | 80 (95.2%) | 4 (4.8%) |
Occupancy by Age of Householder in Empire
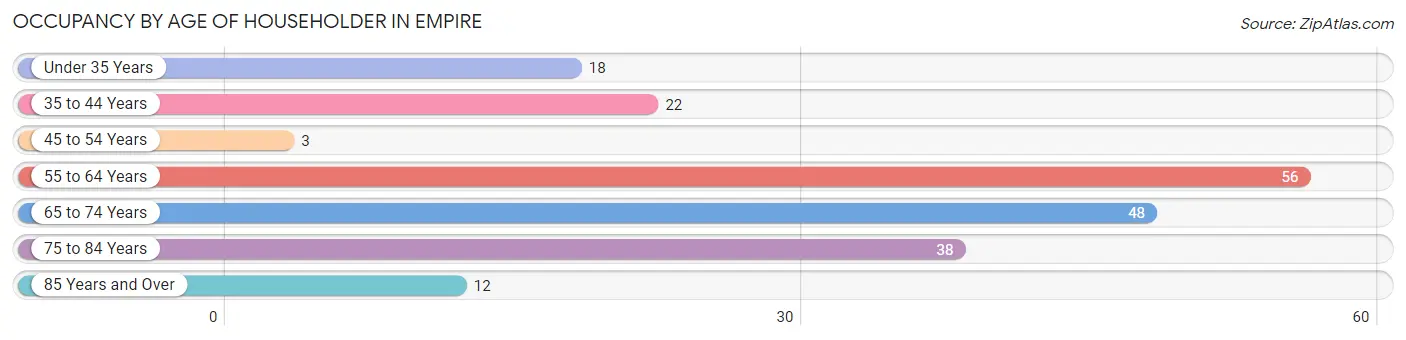
| Age Bracket | # Households | % Households |
| Under 35 Years | 18 | 9.1% |
| 35 to 44 Years | 22 | 11.2% |
| 45 to 54 Years | 3 | 1.5% |
| 55 to 64 Years | 56 | 28.4% |
| 65 to 74 Years | 48 | 24.4% |
| 75 to 84 Years | 38 | 19.3% |
| 85 Years and Over | 12 | 6.1% |
| Total | 197 | 100.0% |
Housing Finances in Empire
Median Income by Occupancy in Empire
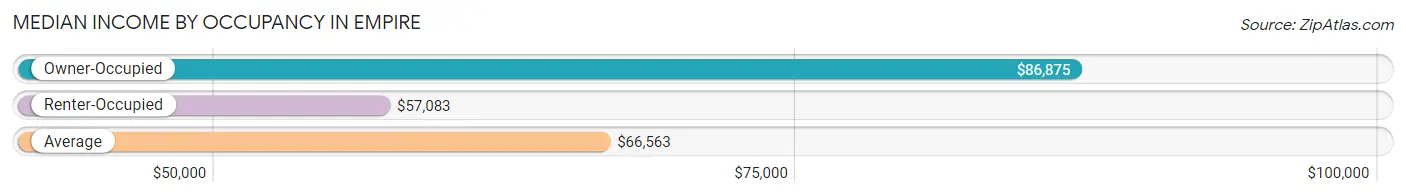
| Occupancy Type | # Households | Median Income |
| Owner-Occupied | 146 (74.1%) | $86,875 |
| Renter-Occupied | 51 (25.9%) | $57,083 |
| Average | 197 (100.0%) | $66,563 |
Occupancy by Householder Income Bracket in Empire
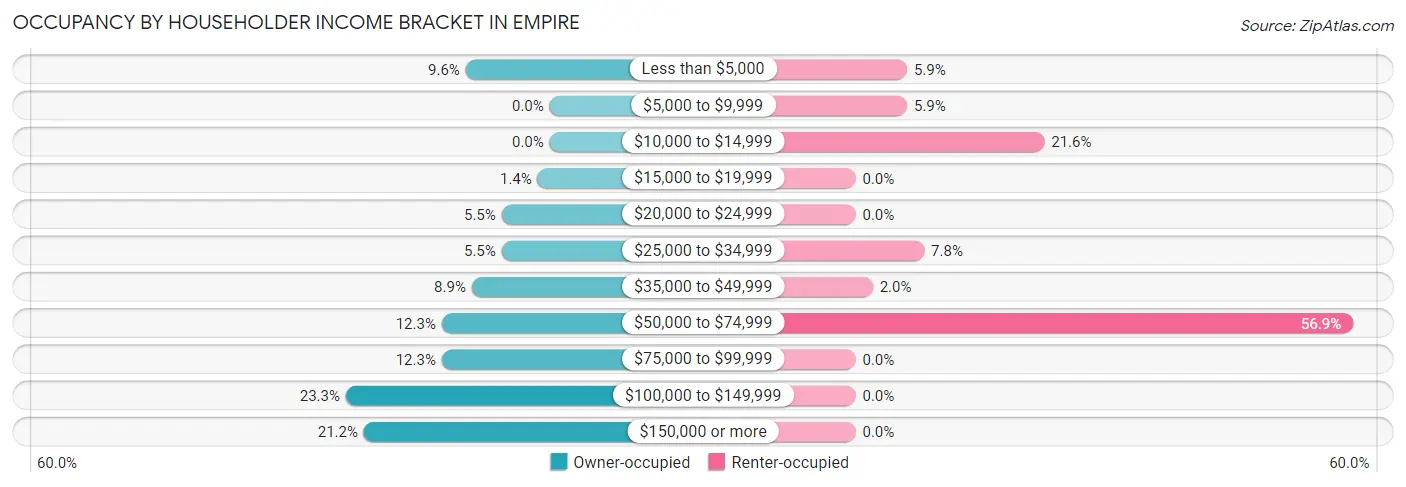
| Income Bracket | Owner-occupied | Renter-occupied |
| Less than $5,000 | 14 (9.6%) | 3 (5.9%) |
| $5,000 to $9,999 | 0 (0.0%) | 3 (5.9%) |
| $10,000 to $14,999 | 0 (0.0%) | 11 (21.6%) |
| $15,000 to $19,999 | 2 (1.4%) | 0 (0.0%) |
| $20,000 to $24,999 | 8 (5.5%) | 0 (0.0%) |
| $25,000 to $34,999 | 8 (5.5%) | 4 (7.8%) |
| $35,000 to $49,999 | 13 (8.9%) | 1 (2.0%) |
| $50,000 to $74,999 | 18 (12.3%) | 29 (56.9%) |
| $75,000 to $99,999 | 18 (12.3%) | 0 (0.0%) |
| $100,000 to $149,999 | 34 (23.3%) | 0 (0.0%) |
| $150,000 or more | 31 (21.2%) | 0 (0.0%) |
| Total | 146 (100.0%) | 51 (100.0%) |
Monthly Housing Cost Tiers in Empire
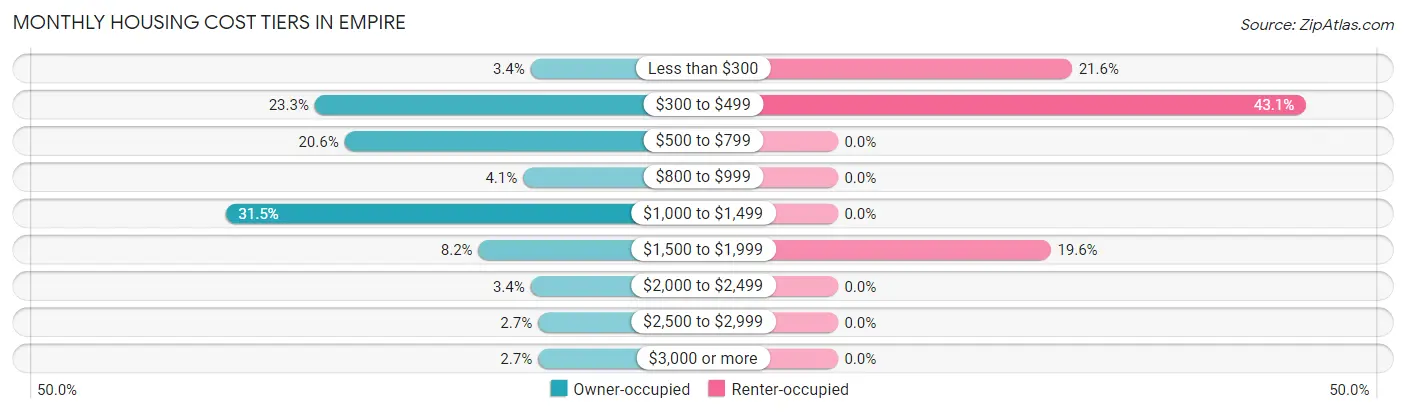
| Monthly Cost | Owner-occupied | Renter-occupied |
| Less than $300 | 5 (3.4%) | 11 (21.6%) |
| $300 to $499 | 34 (23.3%) | 22 (43.1%) |
| $500 to $799 | 30 (20.5%) | 0 (0.0%) |
| $800 to $999 | 6 (4.1%) | 0 (0.0%) |
| $1,000 to $1,499 | 46 (31.5%) | 0 (0.0%) |
| $1,500 to $1,999 | 12 (8.2%) | 10 (19.6%) |
| $2,000 to $2,499 | 5 (3.4%) | 0 (0.0%) |
| $2,500 to $2,999 | 4 (2.7%) | 0 (0.0%) |
| $3,000 or more | 4 (2.7%) | 0 (0.0%) |
| Total | 146 (100.0%) | 51 (100.0%) |
Physical Housing Characteristics in Empire
Housing Structures in Empire
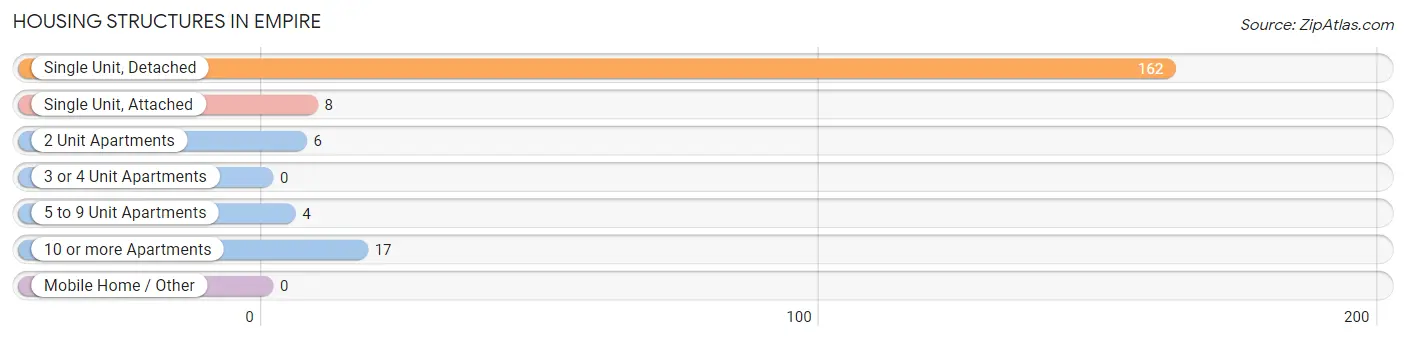
| Structure Type | # Housing Units | % Housing Units |
| Single Unit, Detached | 162 | 82.2% |
| Single Unit, Attached | 8 | 4.1% |
| 2 Unit Apartments | 6 | 3.0% |
| 3 or 4 Unit Apartments | 0 | 0.0% |
| 5 to 9 Unit Apartments | 4 | 2.0% |
| 10 or more Apartments | 17 | 8.6% |
| Mobile Home / Other | 0 | 0.0% |
| Total | 197 | 100.0% |
Housing Structures by Occupancy in Empire
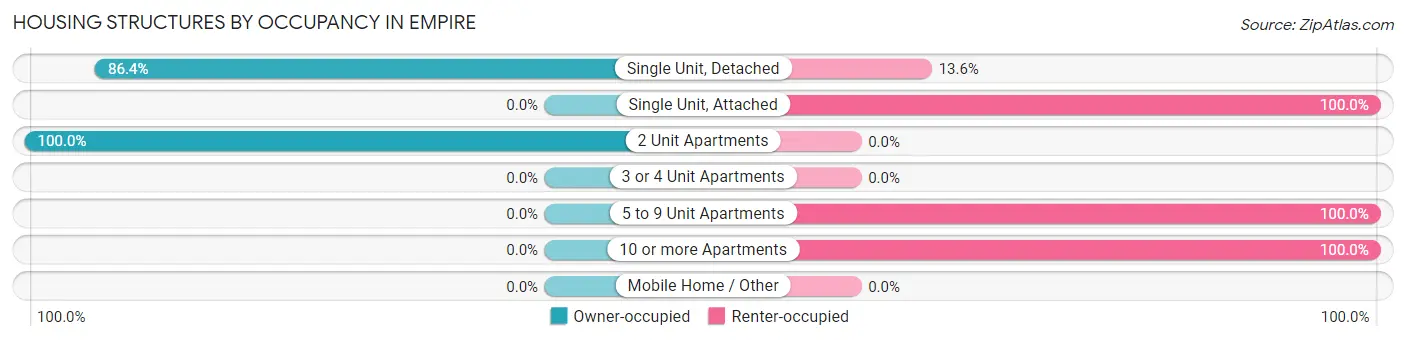
| Structure Type | Owner-occupied | Renter-occupied |
| Single Unit, Detached | 140 (86.4%) | 22 (13.6%) |
| Single Unit, Attached | 0 (0.0%) | 8 (100.0%) |
| 2 Unit Apartments | 6 (100.0%) | 0 (0.0%) |
| 3 or 4 Unit Apartments | 0 (0.0%) | 0 (0.0%) |
| 5 to 9 Unit Apartments | 0 (0.0%) | 4 (100.0%) |
| 10 or more Apartments | 0 (0.0%) | 17 (100.0%) |
| Mobile Home / Other | 0 (0.0%) | 0 (0.0%) |
| Total | 146 (74.1%) | 51 (25.9%) |
Housing Structures by Number of Rooms in Empire
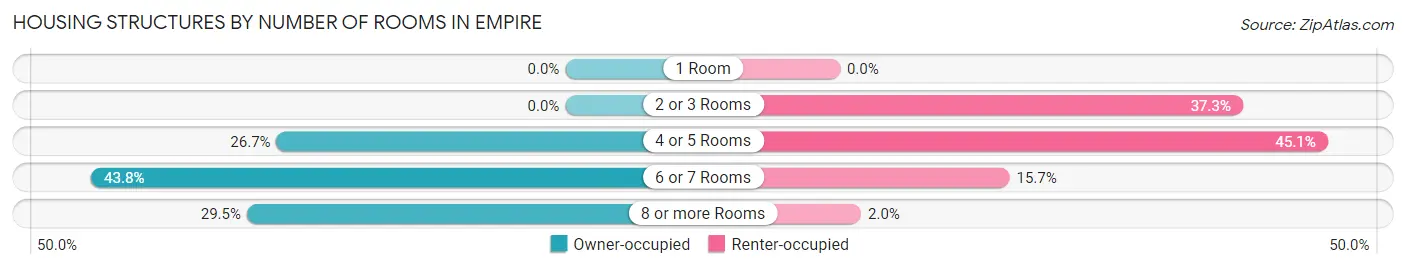
| Number of Rooms | Owner-occupied | Renter-occupied |
| 1 Room | 0 (0.0%) | 0 (0.0%) |
| 2 or 3 Rooms | 0 (0.0%) | 19 (37.2%) |
| 4 or 5 Rooms | 39 (26.7%) | 23 (45.1%) |
| 6 or 7 Rooms | 64 (43.8%) | 8 (15.7%) |
| 8 or more Rooms | 43 (29.4%) | 1 (2.0%) |
| Total | 146 (100.0%) | 51 (100.0%) |
Housing Structure by Heating Type in Empire
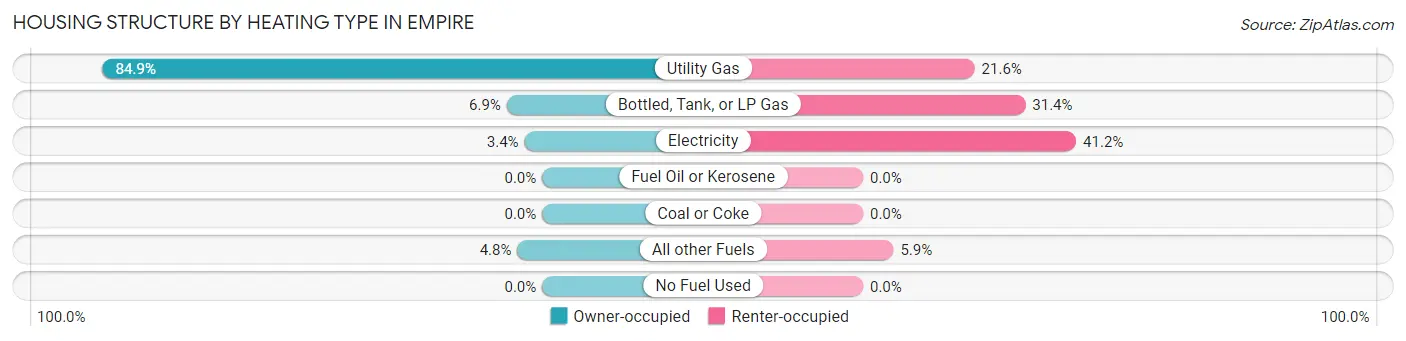
| Heating Type | Owner-occupied | Renter-occupied |
| Utility Gas | 124 (84.9%) | 11 (21.6%) |
| Bottled, Tank, or LP Gas | 10 (6.9%) | 16 (31.4%) |
| Electricity | 5 (3.4%) | 21 (41.2%) |
| Fuel Oil or Kerosene | 0 (0.0%) | 0 (0.0%) |
| Coal or Coke | 0 (0.0%) | 0 (0.0%) |
| All other Fuels | 7 (4.8%) | 3 (5.9%) |
| No Fuel Used | 0 (0.0%) | 0 (0.0%) |
| Total | 146 (100.0%) | 51 (100.0%) |
Household Vehicle Usage in Empire
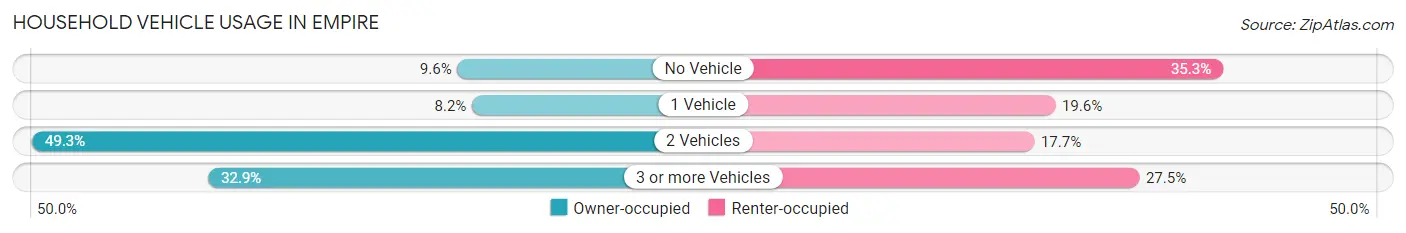
| Vehicles per Household | Owner-occupied | Renter-occupied |
| No Vehicle | 14 (9.6%) | 18 (35.3%) |
| 1 Vehicle | 12 (8.2%) | 10 (19.6%) |
| 2 Vehicles | 72 (49.3%) | 9 (17.6%) |
| 3 or more Vehicles | 48 (32.9%) | 14 (27.5%) |
| Total | 146 (100.0%) | 51 (100.0%) |
Real Estate & Mortgages in Empire
Real Estate and Mortgage Overview in Empire
| Characteristic | Without Mortgage | With Mortgage |
| Housing Units | 88 | 58 |
| Median Property Value | $416,700 | $300,000 |
| Median Household Income | $103,750 | $3 |
| Monthly Housing Costs | $538 | $4 |
| Real Estate Taxes | $2,905 | $2 |
Property Value by Mortgage Status in Empire
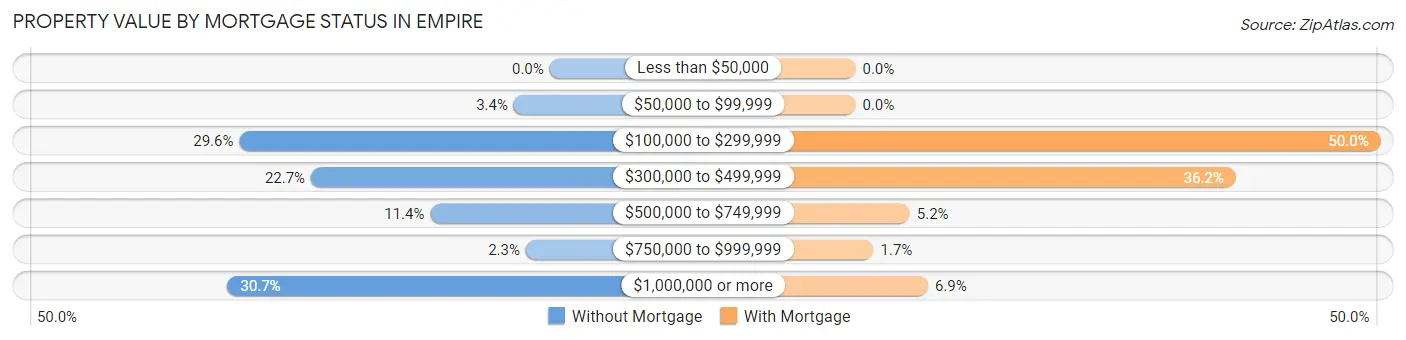
| Property Value | Without Mortgage | With Mortgage |
| Less than $50,000 | 0 (0.0%) | 0 (0.0%) |
| $50,000 to $99,999 | 3 (3.4%) | 0 (0.0%) |
| $100,000 to $299,999 | 26 (29.5%) | 29 (50.0%) |
| $300,000 to $499,999 | 20 (22.7%) | 21 (36.2%) |
| $500,000 to $749,999 | 10 (11.4%) | 3 (5.2%) |
| $750,000 to $999,999 | 2 (2.3%) | 1 (1.7%) |
| $1,000,000 or more | 27 (30.7%) | 4 (6.9%) |
| Total | 88 (100.0%) | 58 (100.0%) |
Household Income by Mortgage Status in Empire
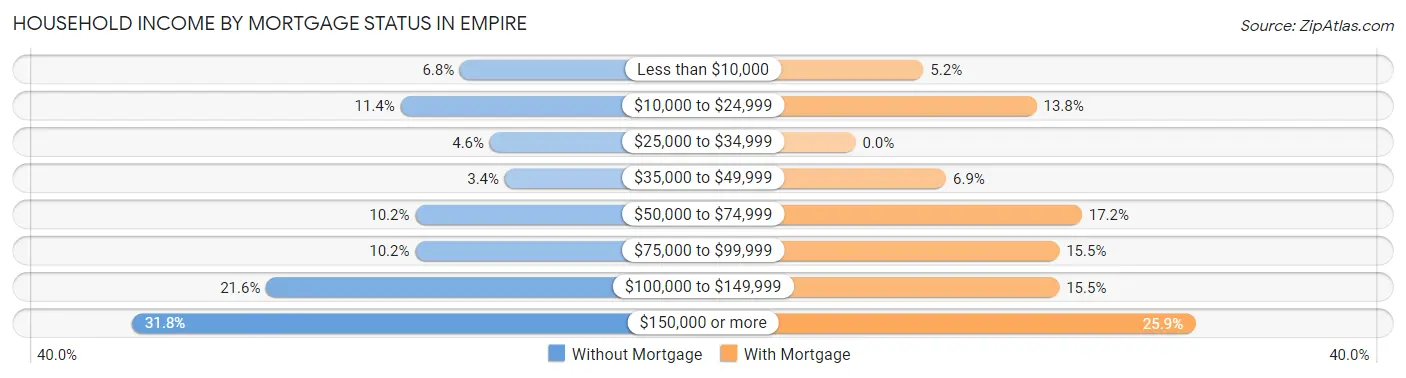
| Household Income | Without Mortgage | With Mortgage |
| Less than $10,000 | 6 (6.8%) | 3 (5.2%) |
| $10,000 to $24,999 | 10 (11.4%) | 8 (13.8%) |
| $25,000 to $34,999 | 4 (4.5%) | 0 (0.0%) |
| $35,000 to $49,999 | 3 (3.4%) | 4 (6.9%) |
| $50,000 to $74,999 | 9 (10.2%) | 10 (17.2%) |
| $75,000 to $99,999 | 9 (10.2%) | 9 (15.5%) |
| $100,000 to $149,999 | 19 (21.6%) | 9 (15.5%) |
| $150,000 or more | 28 (31.8%) | 15 (25.9%) |
| Total | 88 (100.0%) | 58 (100.0%) |
Property Value to Household Income Ratio in Empire
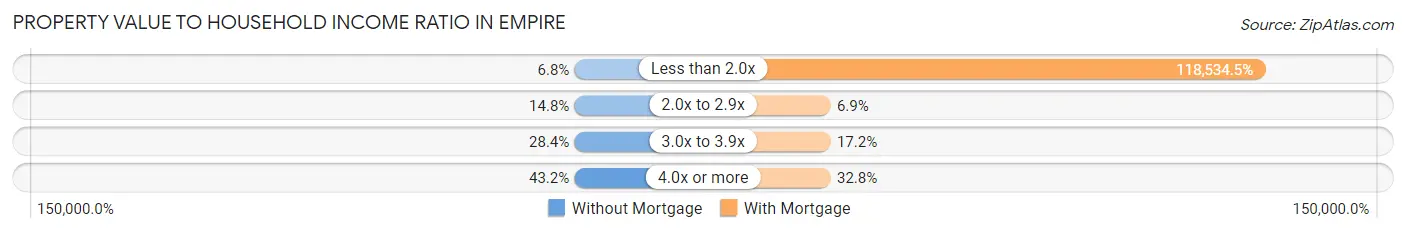
| Value-to-Income Ratio | Without Mortgage | With Mortgage |
| Less than 2.0x | 6 (6.8%) | 68,750 (118,534.5%) |
| 2.0x to 2.9x | 13 (14.8%) | 4 (6.9%) |
| 3.0x to 3.9x | 25 (28.4%) | 10 (17.2%) |
| 4.0x or more | 38 (43.2%) | 19 (32.8%) |
| Total | 88 (100.0%) | 58 (100.0%) |
Real Estate Taxes by Mortgage Status in Empire
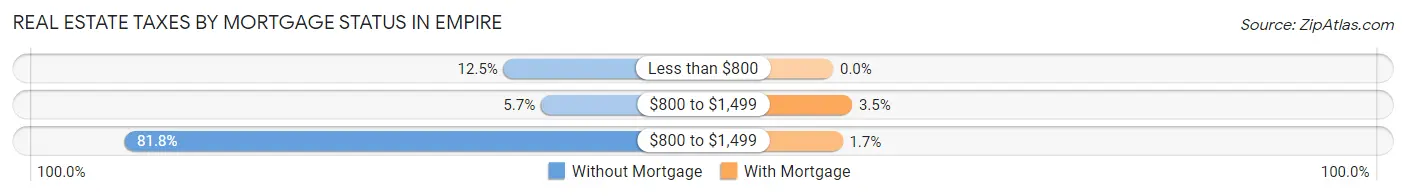
| Property Taxes | Without Mortgage | With Mortgage |
| Less than $800 | 11 (12.5%) | 0 (0.0%) |
| $800 to $1,499 | 5 (5.7%) | 2 (3.5%) |
| $800 to $1,499 | 72 (81.8%) | 1 (1.7%) |
| Total | 88 (100.0%) | 58 (100.0%) |
Health & Disability in Empire
Health Insurance Coverage by Age in Empire
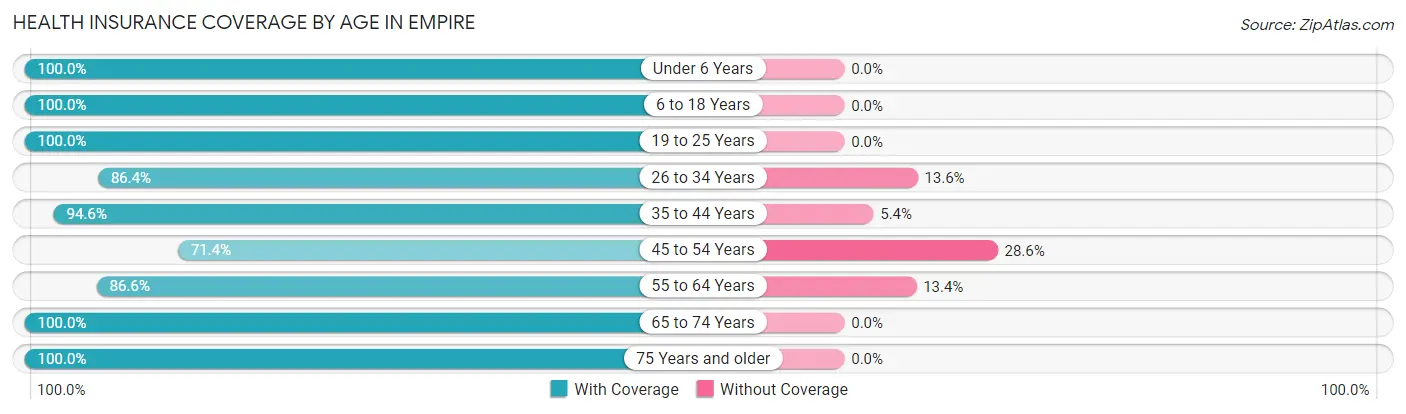
| Age Bracket | With Coverage | Without Coverage |
| Under 6 Years | 6 (100.0%) | 0 (0.0%) |
| 6 to 18 Years | 68 (100.0%) | 0 (0.0%) |
| 19 to 25 Years | 9 (100.0%) | 0 (0.0%) |
| 26 to 34 Years | 19 (86.4%) | 3 (13.6%) |
| 35 to 44 Years | 35 (94.6%) | 2 (5.4%) |
| 45 to 54 Years | 5 (71.4%) | 2 (28.6%) |
| 55 to 64 Years | 71 (86.6%) | 11 (13.4%) |
| 65 to 74 Years | 99 (100.0%) | 0 (0.0%) |
| 75 Years and older | 62 (100.0%) | 0 (0.0%) |
| Total | 374 (95.4%) | 18 (4.6%) |
Health Insurance Coverage by Citizenship Status in Empire
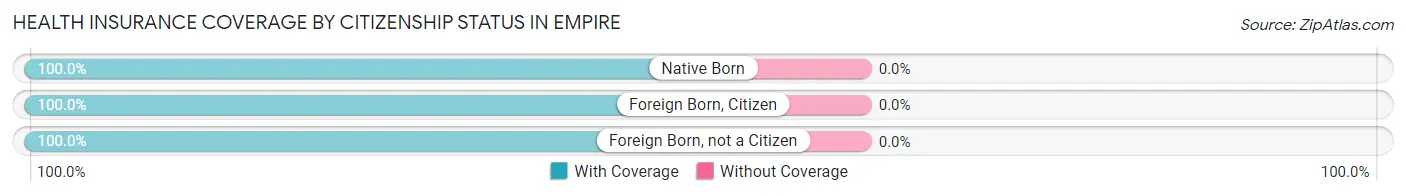
| Citizenship Status | With Coverage | Without Coverage |
| Native Born | 6 (100.0%) | 0 (0.0%) |
| Foreign Born, Citizen | 68 (100.0%) | 0 (0.0%) |
| Foreign Born, not a Citizen | 9 (100.0%) | 0 (0.0%) |
Health Insurance Coverage by Household Income in Empire
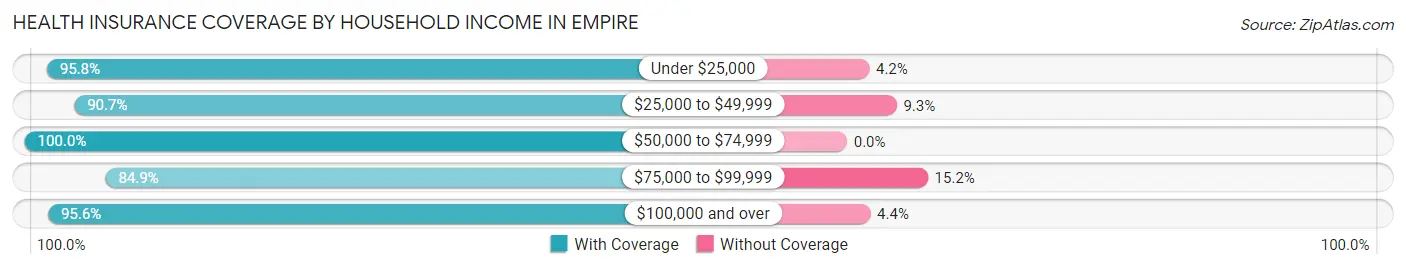
| Household Income | With Coverage | Without Coverage |
| Under $25,000 | 69 (95.8%) | 3 (4.2%) |
| $25,000 to $49,999 | 39 (90.7%) | 4 (9.3%) |
| $50,000 to $74,999 | 107 (100.0%) | 0 (0.0%) |
| $75,000 to $99,999 | 28 (84.9%) | 5 (15.1%) |
| $100,000 and over | 131 (95.6%) | 6 (4.4%) |
Public vs Private Health Insurance Coverage by Age in Empire
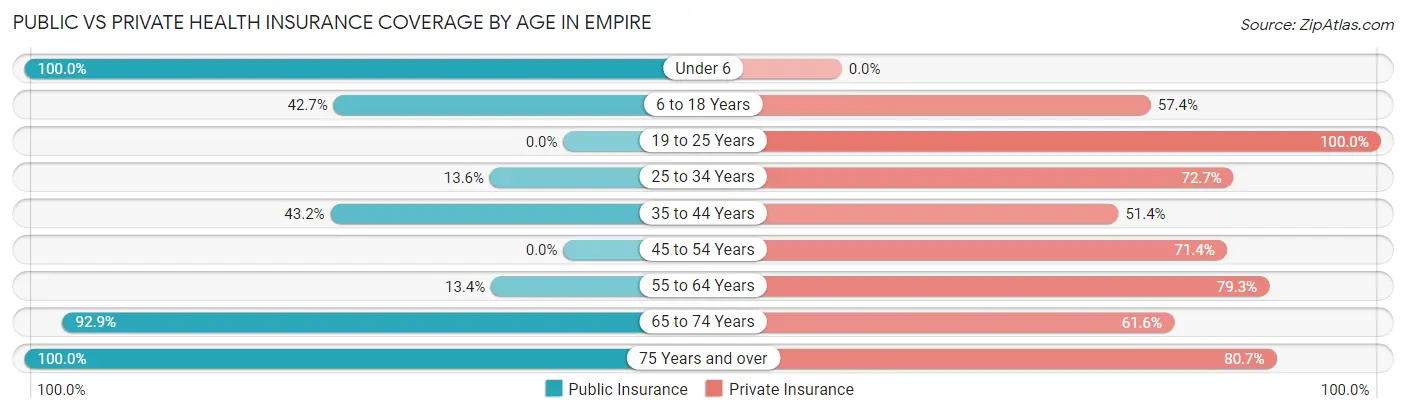
| Age Bracket | Public Insurance | Private Insurance |
| Under 6 | 6 (100.0%) | 0 (0.0%) |
| 6 to 18 Years | 29 (42.6%) | 39 (57.4%) |
| 19 to 25 Years | 0 (0.0%) | 9 (100.0%) |
| 25 to 34 Years | 3 (13.6%) | 16 (72.7%) |
| 35 to 44 Years | 16 (43.2%) | 19 (51.3%) |
| 45 to 54 Years | 0 (0.0%) | 5 (71.4%) |
| 55 to 64 Years | 11 (13.4%) | 65 (79.3%) |
| 65 to 74 Years | 92 (92.9%) | 61 (61.6%) |
| 75 Years and over | 62 (100.0%) | 50 (80.6%) |
| Total | 219 (55.9%) | 264 (67.3%) |
Disability Status by Sex by Age in Empire
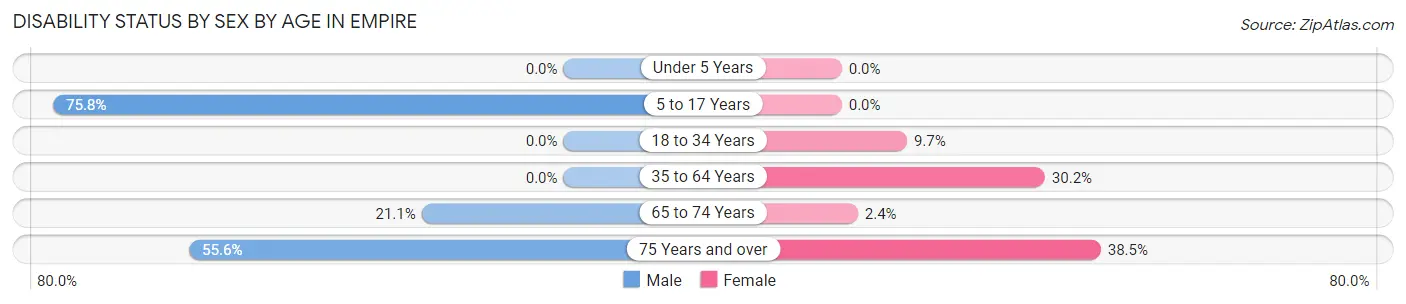
| Age Bracket | Male | Female |
| Under 5 Years | 0 (0.0%) | 0 (0.0%) |
| 5 to 17 Years | 25 (75.8%) | 0 (0.0%) |
| 18 to 34 Years | 0 (0.0%) | 3 (9.7%) |
| 35 to 64 Years | 0 (0.0%) | 19 (30.2%) |
| 65 to 74 Years | 12 (21.0%) | 1 (2.4%) |
| 75 Years and over | 20 (55.6%) | 10 (38.5%) |
Disability Class by Sex by Age in Empire
Disability Class: Hearing Difficulty
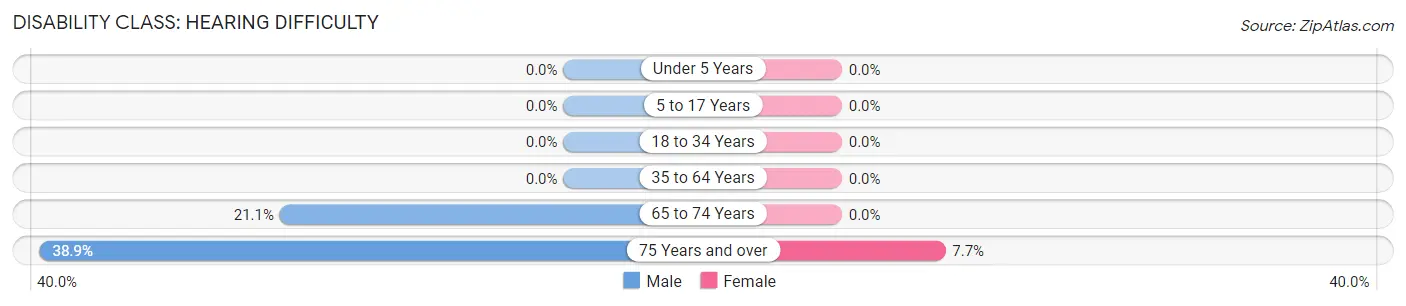
| Age Bracket | Male | Female |
| Under 5 Years | 0 (0.0%) | 0 (0.0%) |
| 5 to 17 Years | 0 (0.0%) | 0 (0.0%) |
| 18 to 34 Years | 0 (0.0%) | 0 (0.0%) |
| 35 to 64 Years | 0 (0.0%) | 0 (0.0%) |
| 65 to 74 Years | 12 (21.0%) | 0 (0.0%) |
| 75 Years and over | 14 (38.9%) | 2 (7.7%) |
Disability Class: Vision Difficulty
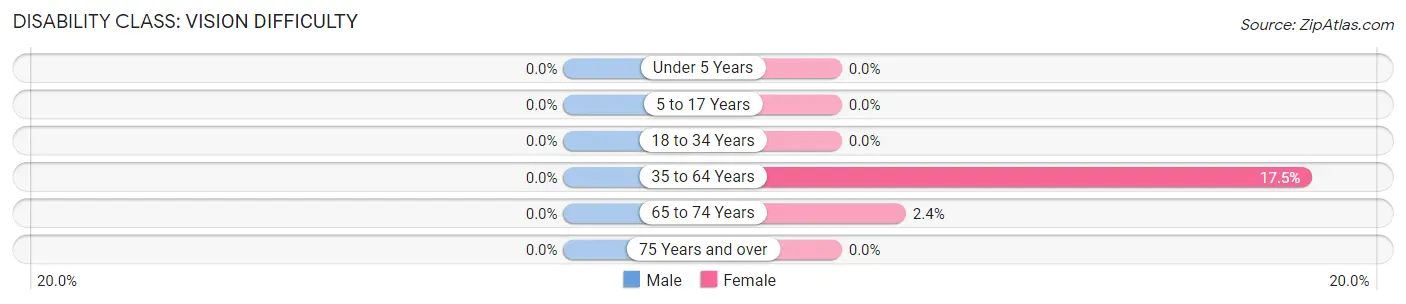
| Age Bracket | Male | Female |
| Under 5 Years | 0 (0.0%) | 0 (0.0%) |
| 5 to 17 Years | 0 (0.0%) | 0 (0.0%) |
| 18 to 34 Years | 0 (0.0%) | 0 (0.0%) |
| 35 to 64 Years | 0 (0.0%) | 11 (17.5%) |
| 65 to 74 Years | 0 (0.0%) | 1 (2.4%) |
| 75 Years and over | 0 (0.0%) | 0 (0.0%) |
Disability Class: Cognitive Difficulty
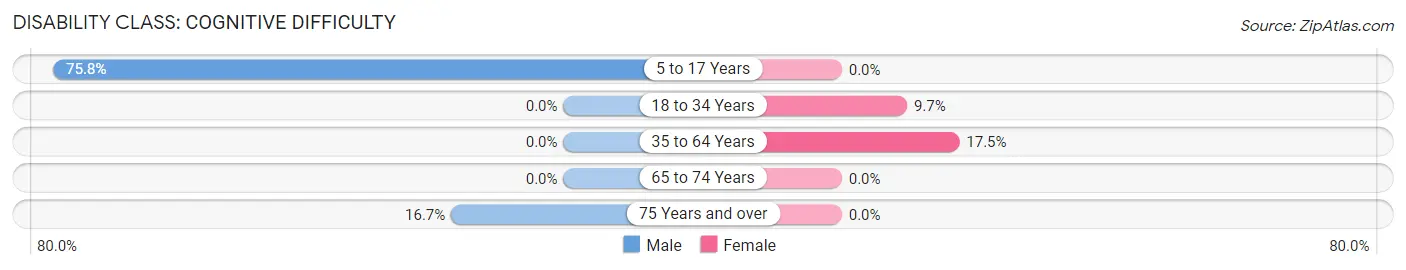
| Age Bracket | Male | Female |
| 5 to 17 Years | 25 (75.8%) | 0 (0.0%) |
| 18 to 34 Years | 0 (0.0%) | 3 (9.7%) |
| 35 to 64 Years | 0 (0.0%) | 11 (17.5%) |
| 65 to 74 Years | 0 (0.0%) | 0 (0.0%) |
| 75 Years and over | 6 (16.7%) | 0 (0.0%) |
Disability Class: Ambulatory Difficulty
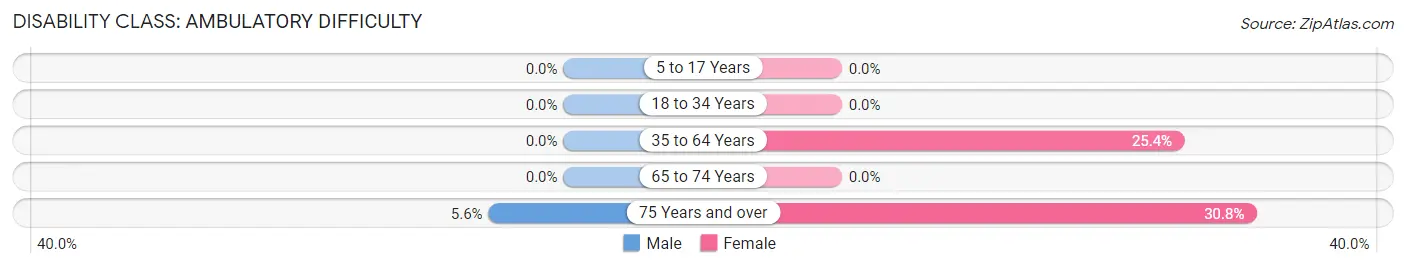
| Age Bracket | Male | Female |
| 5 to 17 Years | 0 (0.0%) | 0 (0.0%) |
| 18 to 34 Years | 0 (0.0%) | 0 (0.0%) |
| 35 to 64 Years | 0 (0.0%) | 16 (25.4%) |
| 65 to 74 Years | 0 (0.0%) | 0 (0.0%) |
| 75 Years and over | 2 (5.6%) | 8 (30.8%) |
Disability Class: Self-Care Difficulty
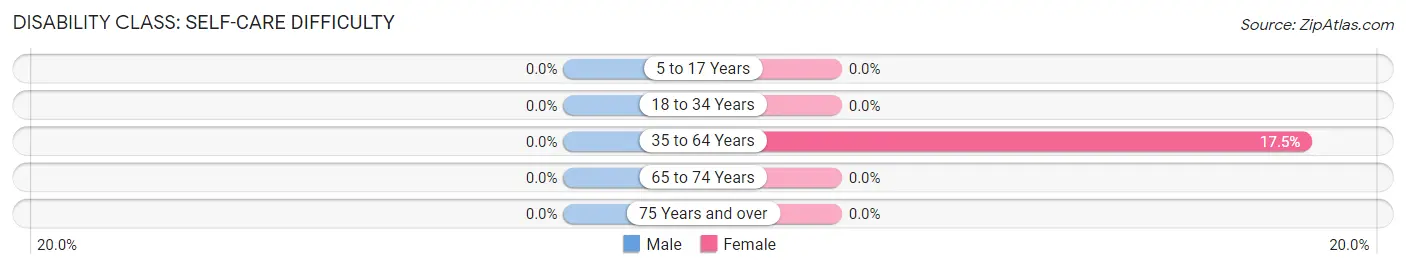
| Age Bracket | Male | Female |
| 5 to 17 Years | 0 (0.0%) | 0 (0.0%) |
| 18 to 34 Years | 0 (0.0%) | 0 (0.0%) |
| 35 to 64 Years | 0 (0.0%) | 11 (17.5%) |
| 65 to 74 Years | 0 (0.0%) | 0 (0.0%) |
| 75 Years and over | 0 (0.0%) | 0 (0.0%) |
Technology Access in Empire
Computing Device Access in Empire
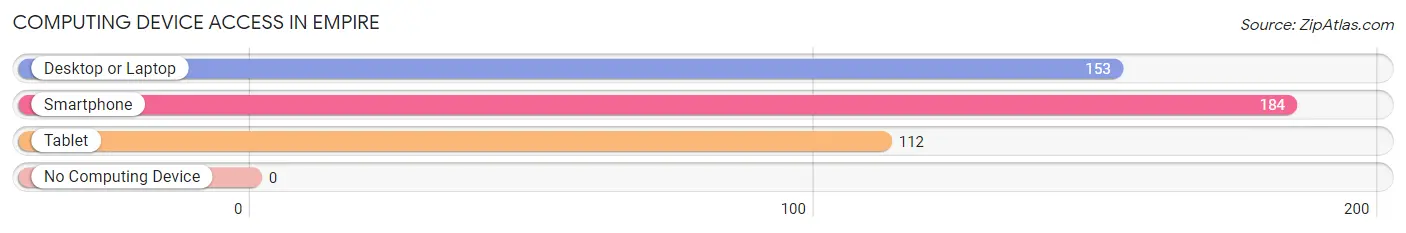
| Device Type | # Households | % Households |
| Desktop or Laptop | 153 | 77.7% |
| Smartphone | 184 | 93.4% |
| Tablet | 112 | 56.9% |
| No Computing Device | 0 | 0.0% |
| Total | 197 | 100.0% |
Internet Access in Empire
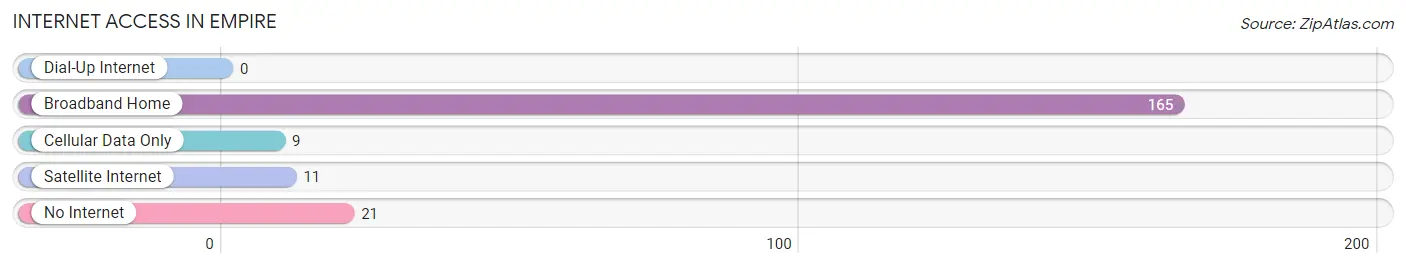
| Internet Type | # Households | % Households |
| Dial-Up Internet | 0 | 0.0% |
| Broadband Home | 165 | 83.8% |
| Cellular Data Only | 9 | 4.6% |
| Satellite Internet | 11 | 5.6% |
| No Internet | 21 | 10.7% |
| Total | 197 | 100.0% |
Empire Summary
Empire is a small village located in the northwest corner of Leelanau County, Michigan. It is situated on the shores of Lake Michigan, just south of Sleeping Bear Dunes National Lakeshore. The village is home to about 500 people and is a popular tourist destination due to its proximity to the lakeshore and its quaint downtown area.
History
The area that is now Empire was first settled in the early 1800s by French-Canadian fur traders. The village was officially founded in 1854 and was named after the Empire State of New York. The village was incorporated in 1891 and has remained a small, rural community ever since.
The village was a popular tourist destination in the late 19th and early 20th centuries, with many visitors coming to enjoy the beaches and the nearby Sleeping Bear Dunes. The village was also home to a number of resorts, including the Empire Beach Hotel, which was built in 1891 and was a popular destination for visitors until it closed in the 1950s.
Geography
Empire is located in the northwest corner of Leelanau County, Michigan. It is situated on the shores of Lake Michigan, just south of Sleeping Bear Dunes National Lakeshore. The village is surrounded by rolling hills and forests, and is home to a number of small lakes and streams.
The village is located about 30 miles north of Traverse City, Michigan, and is accessible by car via US-31. The nearest airport is Cherry Capital Airport, located about 40 miles south of the village.
Economy
The economy of Empire is largely based on tourism. The village is a popular destination for visitors due to its proximity to the lakeshore and its quaint downtown area. The village is home to a number of small businesses, including restaurants, shops, and galleries.
The village is also home to a number of resorts, including the Empire Beach Hotel, which was built in 1891 and was a popular destination for visitors until it closed in the 1950s. The village is also home to a number of bed and breakfasts, as well as a number of campgrounds.
Demographics
As of the 2010 census, the population of Empire was 498. The racial makeup of the village was 97.2% White, 0.2% African American, 0.4% Native American, 0.2% Asian, 0.2% from other races, and 1.8% from two or more races. Hispanic or Latino of any race were 1.2% of the population.
The median household income in Empire was $41,250, and the median family income was $50,000. The per capita income for the village was $20,945. About 8.3% of families and 11.2% of the population were below the poverty line, including 16.7% of those under age 18 and none of those age 65 or over.
Common Questions
What is Per Capita Income in Empire?
Per Capita income in Empire is $55,687.
What is the Median Family Income in Empire?
Median Family Income in Empire is $83,750.
What is the Median Household income in Empire?
Median Household Income in Empire is $66,563.
What is Income or Wage Gap in Empire?
Income or Wage Gap in Empire is 19.3%.
Women in Empire earn 80.7 cents for every dollar earned by a man.
What is Inequality or Gini Index in Empire?
Inequality or Gini Index in Empire is 0.54.
What is the Total Population of Empire?
Total Population of Empire is 392.
What is the Total Male Population of Empire?
Total Male Population of Empire is 189.
What is the Total Female Population of Empire?
Total Female Population of Empire is 203.
What is the Ratio of Males per 100 Females in Empire?
There are 93.10 Males per 100 Females in Empire.
What is the Ratio of Females per 100 Males in Empire?
There are 107.41 Females per 100 Males in Empire.
What is the Median Population Age in Empire?
Median Population Age in Empire is 63.1 Years.
What is the Average Family Size in Empire
Average Family Size in Empire is 2.6 People.
What is the Average Household Size in Empire
Average Household Size in Empire is 2.0 People.
How Large is the Labor Force in Empire?
There are 150 People in the Labor Forcein in Empire.
What is the Percentage of People in the Labor Force in Empire?
46.7% of People are in the Labor Force in Empire.
What is the Unemployment Rate in Empire?
Unemployment Rate in Empire is 1.3%.