Cities with the Most Immigrants from South Central Asia in Michigan
RELATED REPORTS & OPTIONS
South Central Asia
Michigan
Compare Cities
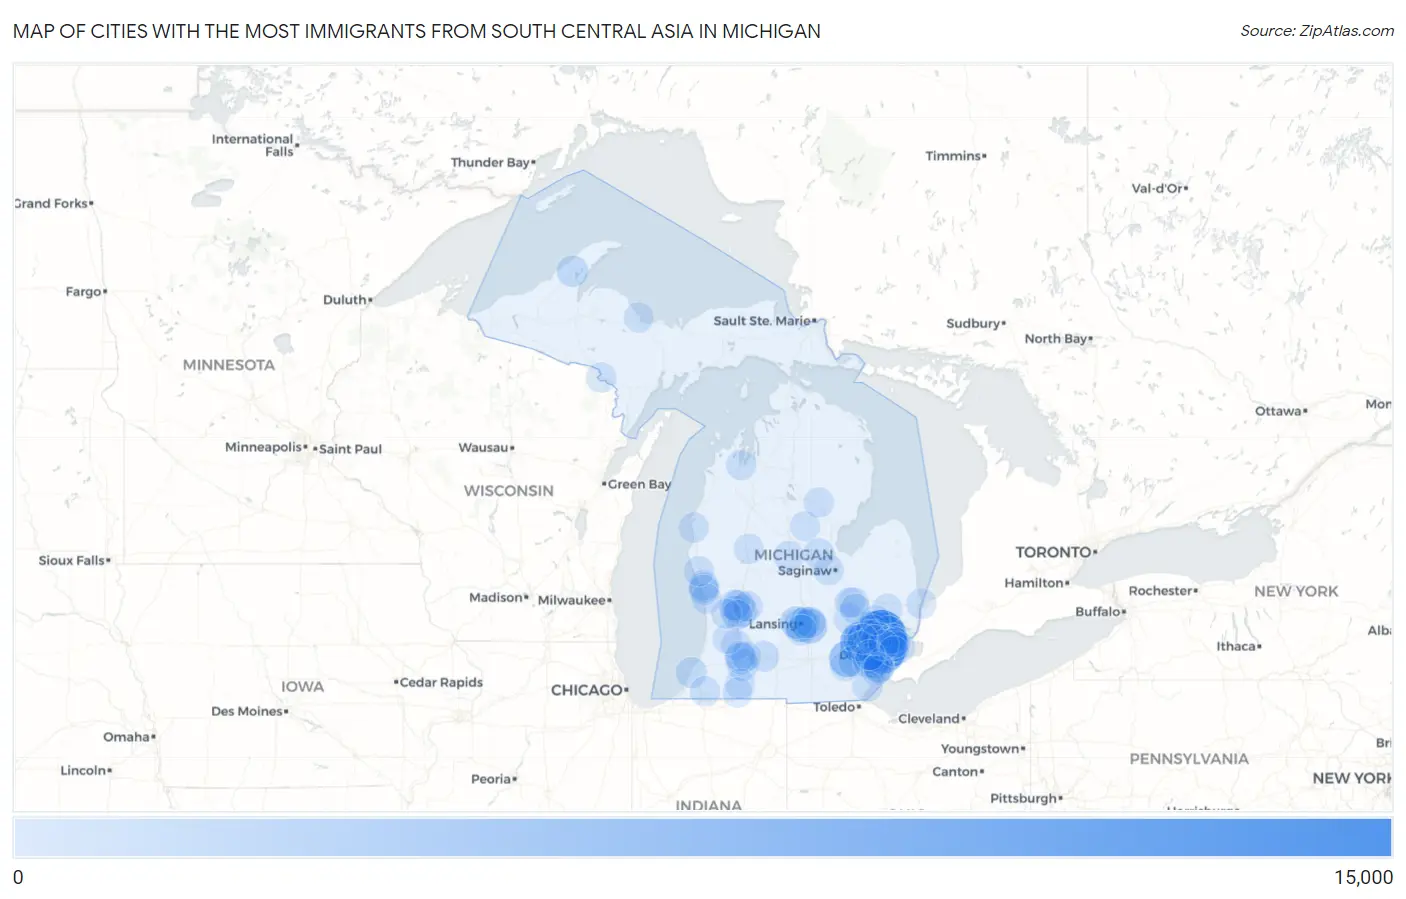
Map of Cities with the Most Immigrants from South Central Asia in Michigan
0
15,000
Cities with the Most Immigrants from South Central Asia in Michigan
| City | South Central Asia | vs State | vs National | |
| 1. | Troy | 10,051 | 117,592(8.55%)#1 | 4,330,976(0.23%)#39 |
| 2. | Farmington Hills | 6,989 | 117,592(5.94%)#2 | 4,330,976(0.16%)#62 |
| 3. | Novi | 6,039 | 117,592(5.14%)#3 | 4,330,976(0.14%)#77 |
| 4. | Detroit | 5,841 | 117,592(4.97%)#4 | 4,330,976(0.13%)#78 |
| 5. | Warren | 5,581 | 117,592(4.75%)#5 | 4,330,976(0.13%)#87 |
| 6. | Hamtramck | 4,978 | 117,592(4.23%)#6 | 4,330,976(0.11%)#101 |
| 7. | Sterling Heights | 4,461 | 117,592(3.79%)#7 | 4,330,976(0.10%)#124 |
| 8. | Rochester Hills | 4,038 | 117,592(3.43%)#8 | 4,330,976(0.09%)#141 |
| 9. | Ann Arbor | 3,269 | 117,592(2.78%)#9 | 4,330,976(0.08%)#190 |
| 10. | Auburn Hills | 2,671 | 117,592(2.27%)#10 | 4,330,976(0.06%)#237 |
| 11. | Okemos | 2,159 | 117,592(1.84%)#11 | 4,330,976(0.05%)#295 |
| 12. | Lansing | 1,891 | 117,592(1.61%)#12 | 4,330,976(0.04%)#347 |
| 13. | Farmington | 1,517 | 117,592(1.29%)#13 | 4,330,976(0.04%)#434 |
| 14. | Westland | 1,498 | 117,592(1.27%)#14 | 4,330,976(0.03%)#439 |
| 15. | Dearborn | 1,417 | 117,592(1.21%)#15 | 4,330,976(0.03%)#461 |
| 16. | Kentwood | 1,154 | 117,592(0.98%)#16 | 4,330,976(0.03%)#562 |
| 17. | Waverly | 1,152 | 117,592(0.98%)#17 | 4,330,976(0.03%)#564 |
| 18. | Grand Rapids | 1,028 | 117,592(0.87%)#18 | 4,330,976(0.02%)#657 |
| 19. | Southfield | 1,014 | 117,592(0.86%)#19 | 4,330,976(0.02%)#663 |
| 20. | Livonia | 932 | 117,592(0.79%)#20 | 4,330,976(0.02%)#714 |
| 21. | Portage | 729 | 117,592(0.62%)#21 | 4,330,976(0.02%)#881 |
| 22. | Dearborn Heights | 675 | 117,592(0.57%)#22 | 4,330,976(0.02%)#922 |
| 23. | East Lansing | 655 | 117,592(0.56%)#23 | 4,330,976(0.02%)#946 |
| 24. | Houghton | 655 | 117,592(0.56%)#24 | 4,330,976(0.02%)#948 |
| 25. | Wixom | 653 | 117,592(0.56%)#25 | 4,330,976(0.02%)#953 |
| 26. | Haslett | 635 | 117,592(0.54%)#26 | 4,330,976(0.01%)#976 |
| 27. | Kalamazoo | 619 | 117,592(0.53%)#27 | 4,330,976(0.01%)#991 |
| 28. | Royal Oak | 556 | 117,592(0.47%)#28 | 4,330,976(0.01%)#1,070 |
| 29. | Ypsilanti | 462 | 117,592(0.39%)#29 | 4,330,976(0.01%)#1,199 |
| 30. | St Joseph | 439 | 117,592(0.37%)#30 | 4,330,976(0.01%)#1,225 |
| 31. | Taylor | 428 | 117,592(0.36%)#31 | 4,330,976(0.01%)#1,247 |
| 32. | Midland | 415 | 117,592(0.35%)#32 | 4,330,976(0.01%)#1,267 |
| 33. | Wyoming | 340 | 117,592(0.29%)#33 | 4,330,976(0.01%)#1,461 |
| 34. | Battle Creek | 315 | 117,592(0.27%)#34 | 4,330,976(0.01%)#1,523 |
| 35. | Walker | 292 | 117,592(0.25%)#35 | 4,330,976(0.01%)#1,593 |
| 36. | Holt | 285 | 117,592(0.24%)#36 | 4,330,976(0.01%)#1,617 |
| 37. | Ferndale | 270 | 117,592(0.23%)#37 | 4,330,976(0.01%)#1,674 |
| 38. | Rochester | 266 | 117,592(0.23%)#38 | 4,330,976(0.01%)#1,685 |
| 39. | Otsego | 243 | 117,592(0.21%)#39 | 4,330,976(0.01%)#1,790 |
| 40. | Oak Park | 230 | 117,592(0.20%)#40 | 4,330,976(0.01%)#1,840 |
| 41. | Westwood | 228 | 117,592(0.19%)#41 | 4,330,976(0.01%)#1,848 |
| 42. | Pontiac | 227 | 117,592(0.19%)#42 | 4,330,976(0.01%)#1,851 |
| 43. | Center Line | 225 | 117,592(0.19%)#43 | 4,330,976(0.01%)#1,863 |
| 44. | Utica | 219 | 117,592(0.19%)#44 | 4,330,976(0.01%)#1,894 |
| 45. | Southgate | 213 | 117,592(0.18%)#45 | 4,330,976(0.00%)#1,930 |
| 46. | Bloomfield Hills | 206 | 117,592(0.18%)#46 | 4,330,976(0.00%)#1,970 |
| 47. | Mount Pleasant | 197 | 117,592(0.17%)#47 | 4,330,976(0.00%)#2,010 |
| 48. | Fenton | 194 | 117,592(0.16%)#48 | 4,330,976(0.00%)#2,034 |
| 49. | Forest Hills | 186 | 117,592(0.16%)#49 | 4,330,976(0.00%)#2,072 |
| 50. | Birmingham | 175 | 117,592(0.15%)#50 | 4,330,976(0.00%)#2,146 |
| 51. | Wayne | 165 | 117,592(0.14%)#51 | 4,330,976(0.00%)#2,218 |
| 52. | Burton | 151 | 117,592(0.13%)#52 | 4,330,976(0.00%)#2,321 |
| 53. | Cutlerville | 147 | 117,592(0.13%)#53 | 4,330,976(0.00%)#2,357 |
| 54. | Allen Park | 146 | 117,592(0.12%)#54 | 4,330,976(0.00%)#2,363 |
| 55. | Orchard Lake Village | 137 | 117,592(0.12%)#55 | 4,330,976(0.00%)#2,433 |
| 56. | Muskegon | 133 | 117,592(0.11%)#56 | 4,330,976(0.00%)#2,457 |
| 57. | Shields | 131 | 117,592(0.11%)#57 | 4,330,976(0.00%)#2,485 |
| 58. | Romulus | 129 | 117,592(0.11%)#58 | 4,330,976(0.00%)#2,496 |
| 59. | Northville | 122 | 117,592(0.10%)#59 | 4,330,976(0.00%)#2,560 |
| 60. | Inkster | 120 | 117,592(0.10%)#60 | 4,330,976(0.00%)#2,579 |
| 61. | Trenton | 119 | 117,592(0.10%)#61 | 4,330,976(0.00%)#2,593 |
| 62. | Madison Heights | 118 | 117,592(0.10%)#62 | 4,330,976(0.00%)#2,602 |
| 63. | Woodhaven | 114 | 117,592(0.10%)#63 | 4,330,976(0.00%)#2,654 |
| 64. | Monroe | 111 | 117,592(0.09%)#64 | 4,330,976(0.00%)#2,689 |
| 65. | Traverse City | 107 | 117,592(0.09%)#65 | 4,330,976(0.00%)#2,730 |
| 66. | Flint | 106 | 117,592(0.09%)#66 | 4,330,976(0.00%)#2,738 |
| 67. | Roosevelt Park | 105 | 117,592(0.09%)#67 | 4,330,976(0.00%)#2,752 |
| 68. | Roseville | 103 | 117,592(0.09%)#68 | 4,330,976(0.00%)#2,770 |
| 69. | Beverly Hills | 95 | 117,592(0.08%)#69 | 4,330,976(0.00%)#2,901 |
| 70. | Village Of Grosse Pointe Shores | 94 | 117,592(0.08%)#70 | 4,330,976(0.00%)#2,916 |
| 71. | Franklin | 75 | 117,592(0.06%)#71 | 4,330,976(0.00%)#3,207 |
| 72. | Grand Blanc | 72 | 117,592(0.06%)#72 | 4,330,976(0.00%)#3,257 |
| 73. | Gladwin | 69 | 117,592(0.06%)#73 | 4,330,976(0.00%)#3,327 |
| 74. | Eastpointe | 66 | 117,592(0.06%)#74 | 4,330,976(0.00%)#3,365 |
| 75. | Norton Shores | 66 | 117,592(0.06%)#75 | 4,330,976(0.00%)#3,367 |
| 76. | Port Huron | 65 | 117,592(0.06%)#76 | 4,330,976(0.00%)#3,392 |
| 77. | Comstock Northwest | 64 | 117,592(0.05%)#77 | 4,330,976(0.00%)#3,427 |
| 78. | West Branch | 63 | 117,592(0.05%)#78 | 4,330,976(0.00%)#3,450 |
| 79. | Grosse Pointe Woods | 61 | 117,592(0.05%)#79 | 4,330,976(0.00%)#3,481 |
| 80. | Three Rivers | 59 | 117,592(0.05%)#80 | 4,330,976(0.00%)#3,528 |
| 81. | Fraser | 57 | 117,592(0.05%)#81 | 4,330,976(0.00%)#3,575 |
| 82. | St Clair Shores | 56 | 117,592(0.05%)#82 | 4,330,976(0.00%)#3,586 |
| 83. | Hazel Park | 55 | 117,592(0.05%)#83 | 4,330,976(0.00%)#3,613 |
| 84. | Saline | 55 | 117,592(0.05%)#84 | 4,330,976(0.00%)#3,617 |
| 85. | Lake Orion | 55 | 117,592(0.05%)#85 | 4,330,976(0.00%)#3,628 |
| 86. | Marquette | 53 | 117,592(0.05%)#86 | 4,330,976(0.00%)#3,662 |
| 87. | Allegan | 53 | 117,592(0.05%)#87 | 4,330,976(0.00%)#3,670 |
| 88. | Almont | 47 | 117,592(0.04%)#88 | 4,330,976(0.00%)#3,860 |
| 89. | Grosse Pointe Park | 43 | 117,592(0.04%)#89 | 4,330,976(0.00%)#3,951 |
| 90. | Grand Haven | 43 | 117,592(0.04%)#90 | 4,330,976(0.00%)#3,952 |
| 91. | Walled Lake | 43 | 117,592(0.04%)#91 | 4,330,976(0.00%)#3,959 |
| 92. | Hudsonville | 42 | 117,592(0.04%)#92 | 4,330,976(0.00%)#3,995 |
| 93. | Riverview | 41 | 117,592(0.03%)#93 | 4,330,976(0.00%)#4,019 |
| 94. | Garden City | 38 | 117,592(0.03%)#94 | 4,330,976(0.00%)#4,104 |
| 95. | Niles | 36 | 117,592(0.03%)#95 | 4,330,976(0.00%)#4,178 |
| 96. | Constantine | 36 | 117,592(0.03%)#96 | 4,330,976(0.00%)#4,202 |
| 97. | Ludington | 34 | 117,592(0.03%)#97 | 4,330,976(0.00%)#4,264 |
| 98. | Big Rapids | 33 | 117,592(0.03%)#98 | 4,330,976(0.00%)#4,302 |
| 99. | Iron Mountain | 33 | 117,592(0.03%)#99 | 4,330,976(0.00%)#4,304 |
| 100. | Whitehall | 33 | 117,592(0.03%)#100 | 4,330,976(0.00%)#4,322 |
Common Questions
What are the Top 10 Cities with the Most Immigrants from South Central Asia in Michigan?
Top 10 Cities with the Most Immigrants from South Central Asia in Michigan are:
#1
10,051
#2
6,989
#3
6,039
#4
5,841
#5
5,581
#6
4,978
#7
4,461
#8
4,038
#9
3,269
#10
2,671
What city has the Most Immigrants from South Central Asia in Michigan?
Troy has the Most Immigrants from South Central Asia in Michigan with 10,051.
What is the Total Immigrants from South Central Asia in the State of Michigan?
Total Immigrants from South Central Asia in Michigan is 117,592.
What is the Total Immigrants from South Central Asia in the United States?
Total Immigrants from South Central Asia in the United States is 4,330,976.