Bancroft, MI Map & Demographics
Bancroft Map
Bancroft Overview
$35,613
PER CAPITA INCOME
$90,625
AVG FAMILY INCOME
$81,563
AVG HOUSEHOLD INCOME
59.7%
WAGE / INCOME GAP [ % ]
40.3¢/ $1
WAGE / INCOME GAP [ $ ]
0.42
INEQUALITY / GINI INDEX
500
TOTAL POPULATION
210
MALE POPULATION
290
FEMALE POPULATION
72.41
MALES / 100 FEMALES
138.10
FEMALES / 100 MALES
35.3
MEDIAN AGE
3.3
AVG FAMILY SIZE
2.8
AVG HOUSEHOLD SIZE
257
LABOR FORCE [ PEOPLE ]
64.3%
PERCENT IN LABOR FORCE
2.7%
UNEMPLOYMENT RATE
Bancroft Zip Codes
Bancroft Area Codes
Income in Bancroft
Income Overview in Bancroft
Per Capita Income in Bancroft is $35,613, while median incomes of families and households are $90,625 and $81,563 respectively.
| Characteristic | Number | Measure |
| Per Capita Income | 500 | $35,613 |
| Median Family Income | 131 | $90,625 |
| Mean Family Income | 131 | $112,569 |
| Median Household Income | 181 | $81,563 |
| Mean Household Income | 181 | $96,666 |
| Income Deficit | 131 | $0 |
| Wage / Income Gap (%) | 500 | 59.69% |
| Wage / Income Gap ($) | 500 | 40.31¢ per $1 |
| Gini / Inequality Index | 500 | 0.42 |
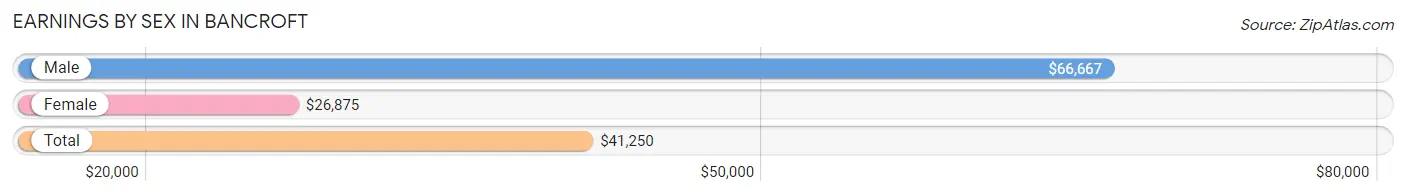
Earnings by Sex in Bancroft
Average Earnings in Bancroft are $41,250, $66,667 for men and $26,875 for women, a difference of 59.7%.
| Sex | Number | Average Earnings |
| Male | 120 (46.0%) | $66,667 |
| Female | 141 (54.0%) | $26,875 |
| Total | 261 (100.0%) | $41,250 |
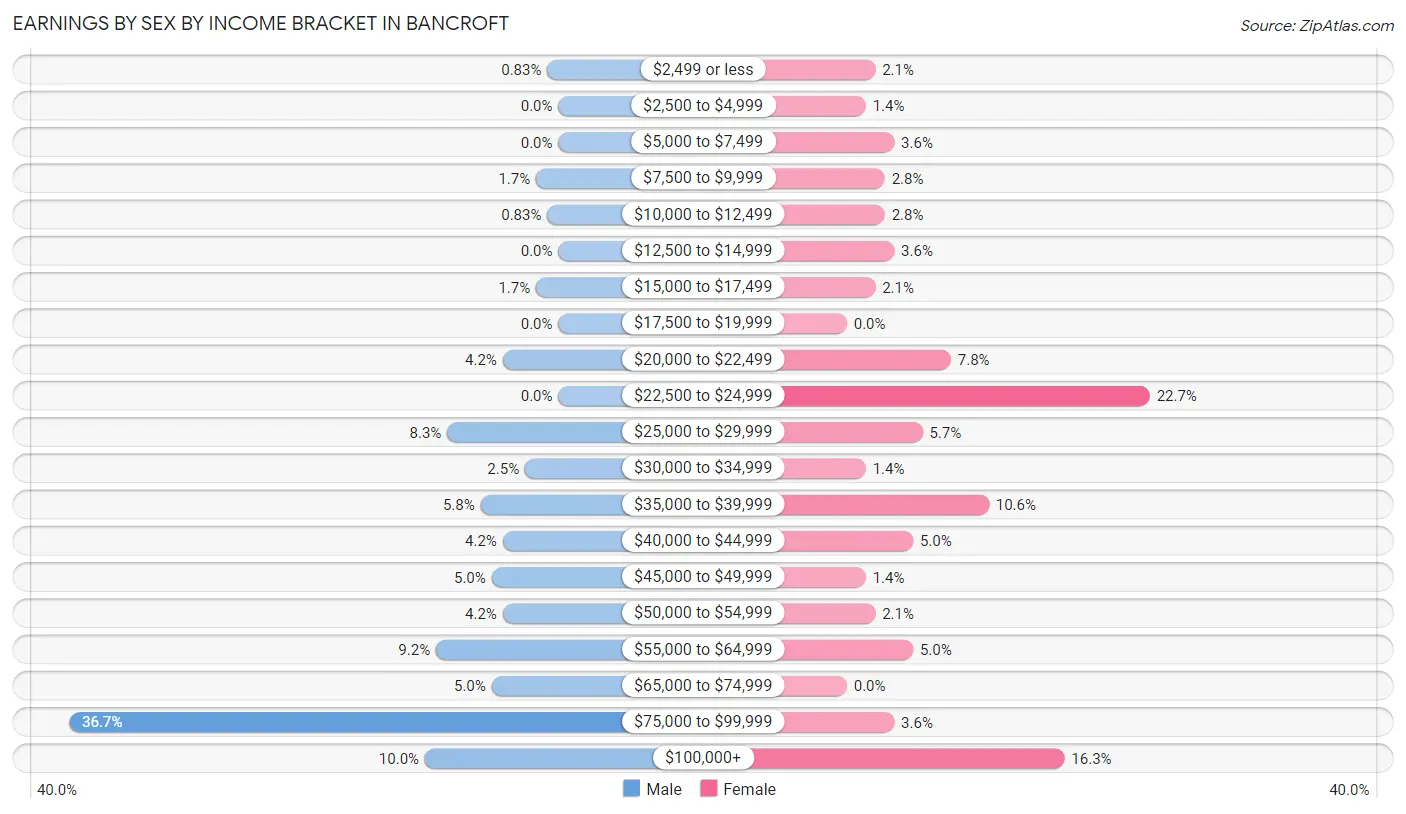
Earnings by Sex by Income Bracket in Bancroft
The most common earnings brackets in Bancroft are $75,000 to $99,999 for men (44 | 36.7%) and $22,500 to $24,999 for women (32 | 22.7%).
| Income | Male | Female |
| $2,499 or less | 1 (0.8%) | 3 (2.1%) |
| $2,500 to $4,999 | 0 (0.0%) | 2 (1.4%) |
| $5,000 to $7,499 | 0 (0.0%) | 5 (3.5%) |
| $7,500 to $9,999 | 2 (1.7%) | 4 (2.8%) |
| $10,000 to $12,499 | 1 (0.8%) | 4 (2.8%) |
| $12,500 to $14,999 | 0 (0.0%) | 5 (3.5%) |
| $15,000 to $17,499 | 2 (1.7%) | 3 (2.1%) |
| $17,500 to $19,999 | 0 (0.0%) | 0 (0.0%) |
| $20,000 to $22,499 | 5 (4.2%) | 11 (7.8%) |
| $22,500 to $24,999 | 0 (0.0%) | 32 (22.7%) |
| $25,000 to $29,999 | 10 (8.3%) | 8 (5.7%) |
| $30,000 to $34,999 | 3 (2.5%) | 2 (1.4%) |
| $35,000 to $39,999 | 7 (5.8%) | 15 (10.6%) |
| $40,000 to $44,999 | 5 (4.2%) | 7 (5.0%) |
| $45,000 to $49,999 | 6 (5.0%) | 2 (1.4%) |
| $50,000 to $54,999 | 5 (4.2%) | 3 (2.1%) |
| $55,000 to $64,999 | 11 (9.2%) | 7 (5.0%) |
| $65,000 to $74,999 | 6 (5.0%) | 0 (0.0%) |
| $75,000 to $99,999 | 44 (36.7%) | 5 (3.5%) |
| $100,000+ | 12 (10.0%) | 23 (16.3%) |
| Total | 120 (100.0%) | 141 (100.0%) |
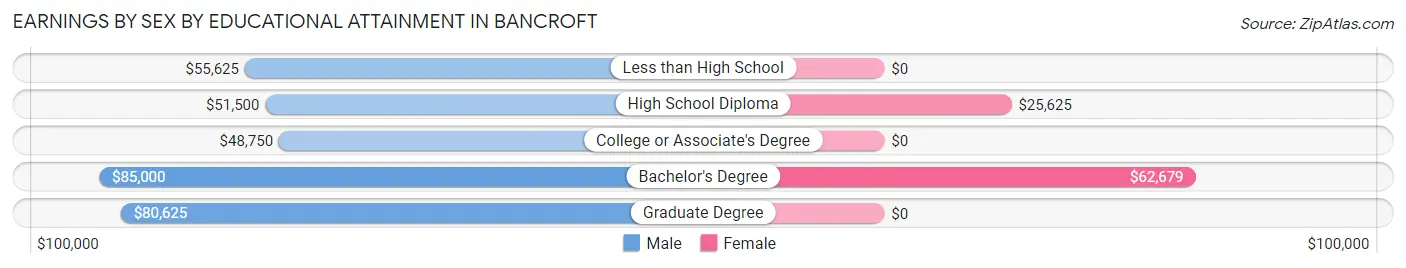
Earnings by Sex by Educational Attainment in Bancroft
Average earnings in Bancroft are $56,042 for men and $39,659 for women, a difference of 29.2%. Men with an educational attainment of bachelor's degree enjoy the highest average annual earnings of $85,000, while those with college or associate's degree education earn the least with $48,750. Women with an educational attainment of bachelor's degree earn the most with the average annual earnings of $62,679, while those with high school diploma education have the smallest earnings of $25,625.
| Educational Attainment | Male Income | Female Income |
| Less than High School | $55,625 | $0 |
| High School Diploma | $51,500 | $25,625 |
| College or Associate's Degree | $48,750 | $0 |
| Bachelor's Degree | $85,000 | $62,679 |
| Graduate Degree | $80,625 | $0 |
| Total | $56,042 | $39,659 |
Family Income in Bancroft
Family Income Brackets in Bancroft
According to the Bancroft family income data, there are 25 families falling into the $200,000+ income range, which is the most common income bracket and makes up 19.1% of all families. Conversely, the $10,000 to $14,999 income bracket is the least frequent group with only 2 families (1.5%) belonging to this category.
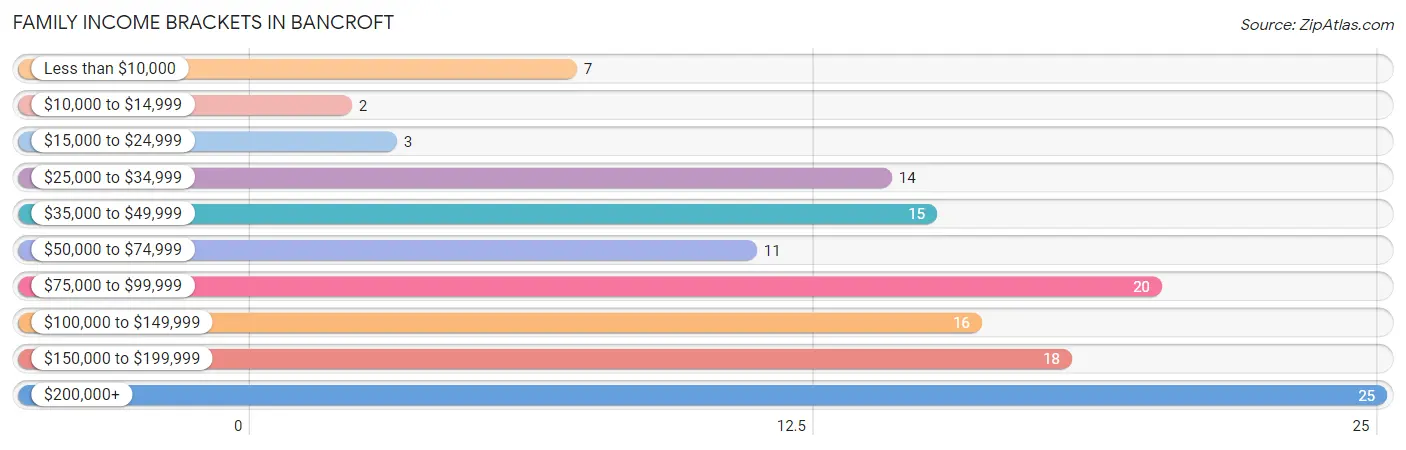
| Income Bracket | # Families | % Families |
| Less than $10,000 | 7 | 5.3% |
| $10,000 to $14,999 | 2 | 1.5% |
| $15,000 to $24,999 | 3 | 2.3% |
| $25,000 to $34,999 | 14 | 10.7% |
| $35,000 to $49,999 | 15 | 11.5% |
| $50,000 to $74,999 | 11 | 8.4% |
| $75,000 to $99,999 | 20 | 15.3% |
| $100,000 to $149,999 | 16 | 12.2% |
| $150,000 to $199,999 | 18 | 13.7% |
| $200,000+ | 25 | 19.1% |
Family Income by Famaliy Size in Bancroft
4-person families (43 | 32.8%) account for the highest median family income in Bancroft with $215,417 per family, while 4-person families (43 | 32.8%) have the highest median income of $53,854 per family member.
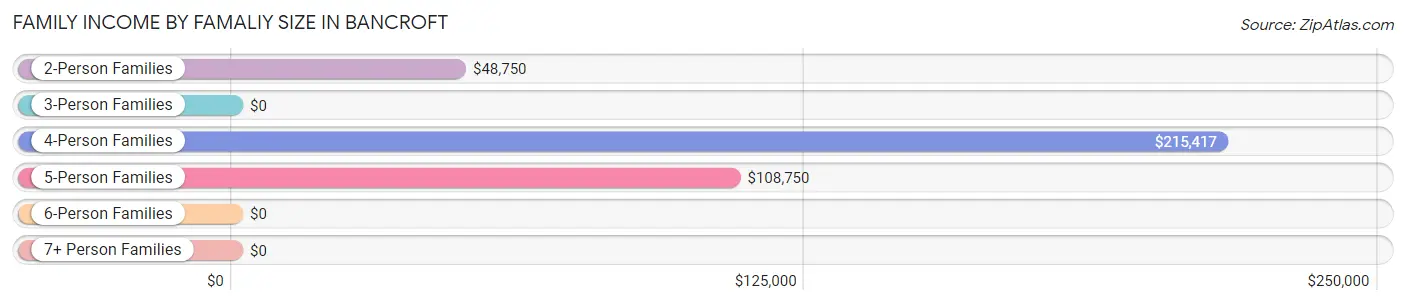
| Income Bracket | # Families | Median Income |
| 2-Person Families | 52 (39.7%) | $48,750 |
| 3-Person Families | 18 (13.7%) | $0 |
| 4-Person Families | 43 (32.8%) | $215,417 |
| 5-Person Families | 16 (12.2%) | $108,750 |
| 6-Person Families | 2 (1.5%) | $0 |
| 7+ Person Families | 0 (0.0%) | $0 |
| Total | 131 (100.0%) | $90,625 |
Family Income by Number of Earners in Bancroft
The median family income in Bancroft is $90,625, with families comprising 3+ earners (26) having the highest median family income of $215,952, while families with no earners (29) have the lowest median family income of $33,125, accounting for 19.9% and 22.1% of families, respectively.
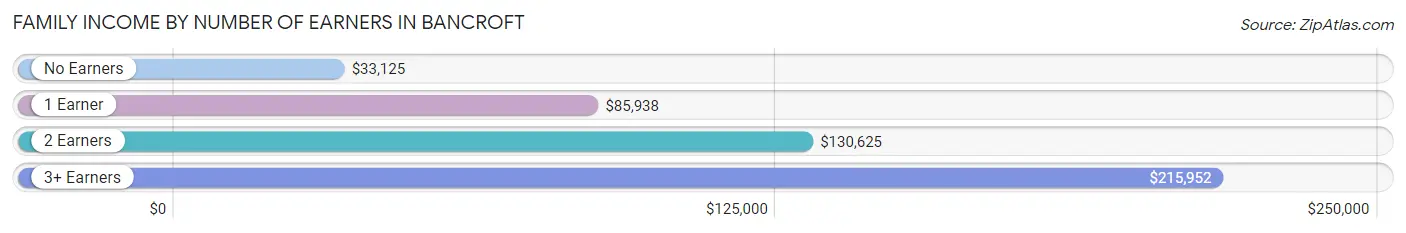
| Number of Earners | # Families | Median Income |
| No Earners | 29 (22.1%) | $33,125 |
| 1 Earner | 33 (25.2%) | $85,938 |
| 2 Earners | 43 (32.8%) | $130,625 |
| 3+ Earners | 26 (19.9%) | $215,952 |
| Total | 131 (100.0%) | $90,625 |
Household Income in Bancroft
Household Income Brackets in Bancroft
With 36 households falling in the category, the $75,000 to $99,999 income range is the most frequent in Bancroft, accounting for 19.9% of all households. In contrast, only 3 households (1.7%) fall into the $10,000 to $14,999 income bracket, making it the least populous group.
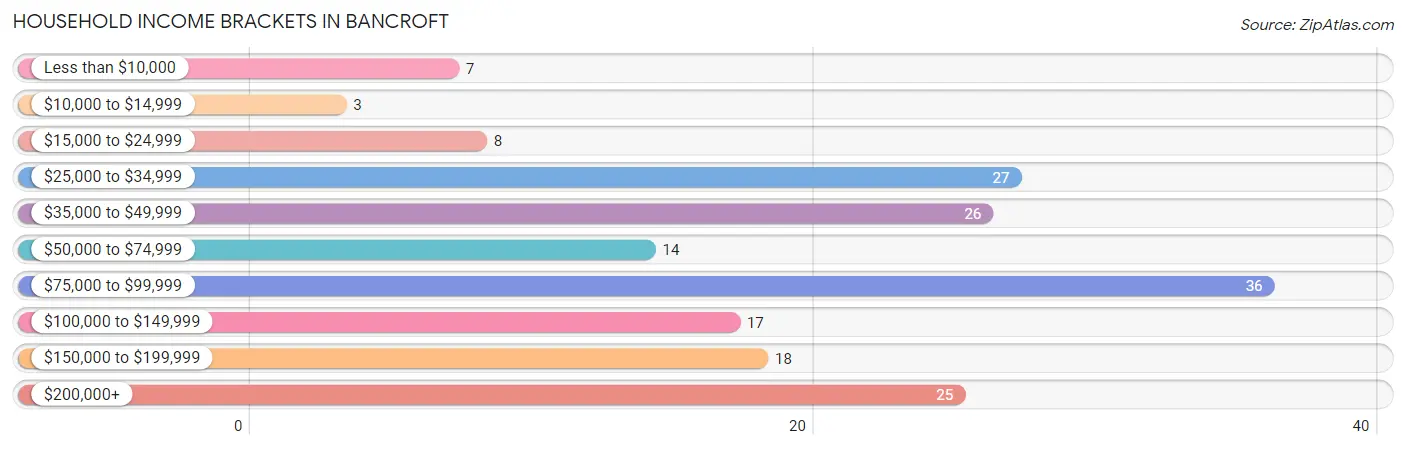
| Income Bracket | # Households | % Households |
| Less than $10,000 | 7 | 3.9% |
| $10,000 to $14,999 | 3 | 1.7% |
| $15,000 to $24,999 | 8 | 4.4% |
| $25,000 to $34,999 | 27 | 14.9% |
| $35,000 to $49,999 | 26 | 14.4% |
| $50,000 to $74,999 | 14 | 7.7% |
| $75,000 to $99,999 | 36 | 19.9% |
| $100,000 to $149,999 | 17 | 9.4% |
| $150,000 to $199,999 | 18 | 9.9% |
| $200,000+ | 25 | 13.8% |
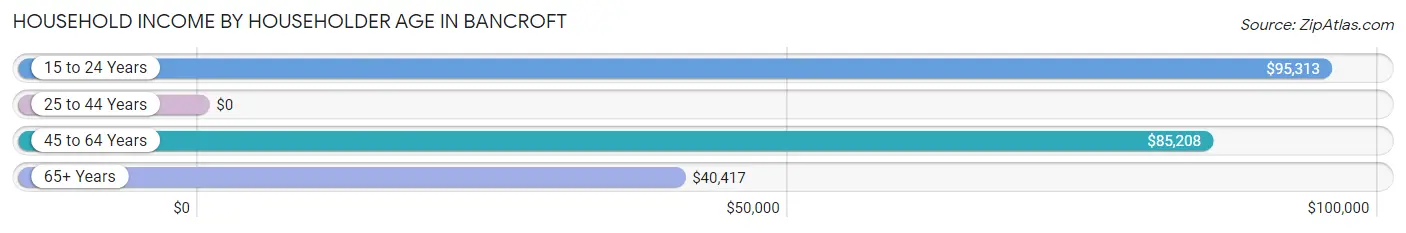
Household Income by Householder Age in Bancroft
The median household income in Bancroft is $81,563, with the highest median household income of $95,313 found in the 15 to 24 years age bracket for the primary householder. A total of 23 households (12.7%) fall into this category. Meanwhile, the 25 to 44 years age bracket for the primary householder has the lowest median household income of $0, with 56 households (30.9%) in this group.
| Income Bracket | # Households | Median Income |
| 15 to 24 Years | 23 (12.7%) | $95,313 |
| 25 to 44 Years | 56 (30.9%) | $0 |
| 45 to 64 Years | 55 (30.4%) | $85,208 |
| 65+ Years | 47 (26.0%) | $40,417 |
| Total | 181 (100.0%) | $81,563 |
Poverty in Bancroft
Income Below Poverty by Sex and Age in Bancroft
With 5.2% poverty level for males and 9.0% for females among the residents of Bancroft, 45 to 54 year old males and 16 and 17 year old females are the most vulnerable to poverty, with 5 males (18.5%) and 2 females (28.6%) in their respective age groups living below the poverty level.
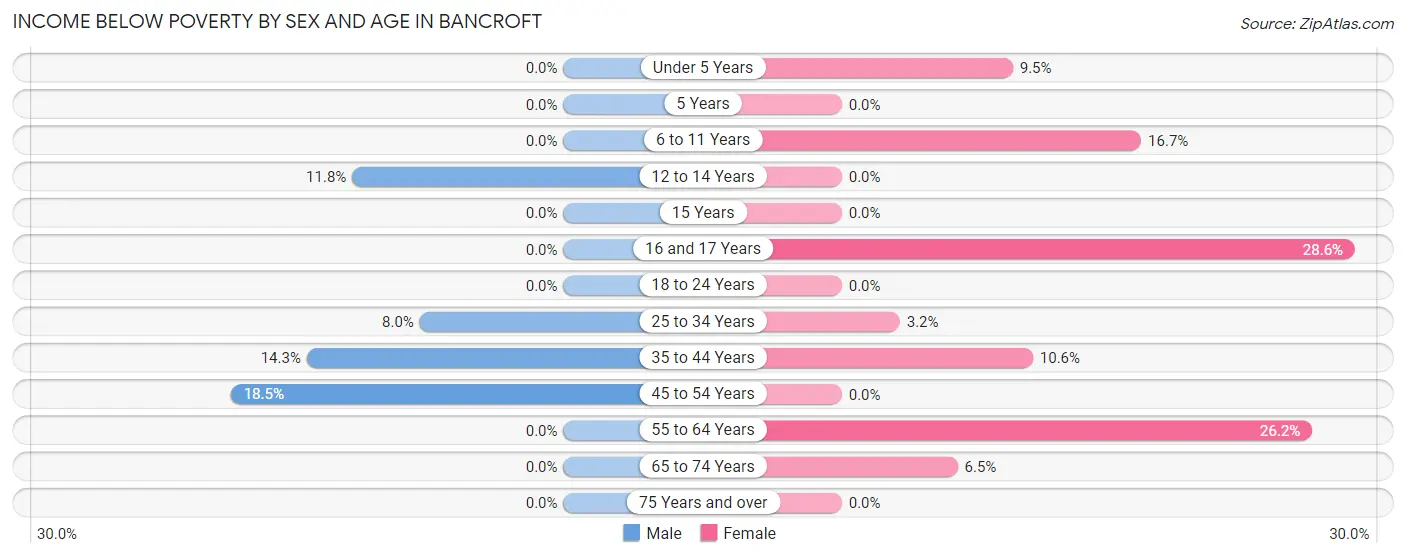
| Age Bracket | Male | Female |
| Under 5 Years | 0 (0.0%) | 2 (9.5%) |
| 5 Years | 0 (0.0%) | 0 (0.0%) |
| 6 to 11 Years | 0 (0.0%) | 3 (16.7%) |
| 12 to 14 Years | 2 (11.8%) | 0 (0.0%) |
| 15 Years | 0 (0.0%) | 0 (0.0%) |
| 16 and 17 Years | 0 (0.0%) | 2 (28.6%) |
| 18 to 24 Years | 0 (0.0%) | 0 (0.0%) |
| 25 to 34 Years | 2 (8.0%) | 1 (3.2%) |
| 35 to 44 Years | 2 (14.3%) | 5 (10.6%) |
| 45 to 54 Years | 5 (18.5%) | 0 (0.0%) |
| 55 to 64 Years | 0 (0.0%) | 11 (26.2%) |
| 65 to 74 Years | 0 (0.0%) | 2 (6.5%) |
| 75 Years and over | 0 (0.0%) | 0 (0.0%) |
| Total | 11 (5.2%) | 26 (9.0%) |
Income Above Poverty by Sex and Age in Bancroft
According to the poverty statistics in Bancroft, males aged under 5 years and females aged 12 to 14 years are the age groups that are most secure financially, with 100.0% of males and 100.0% of females in these age groups living above the poverty line.
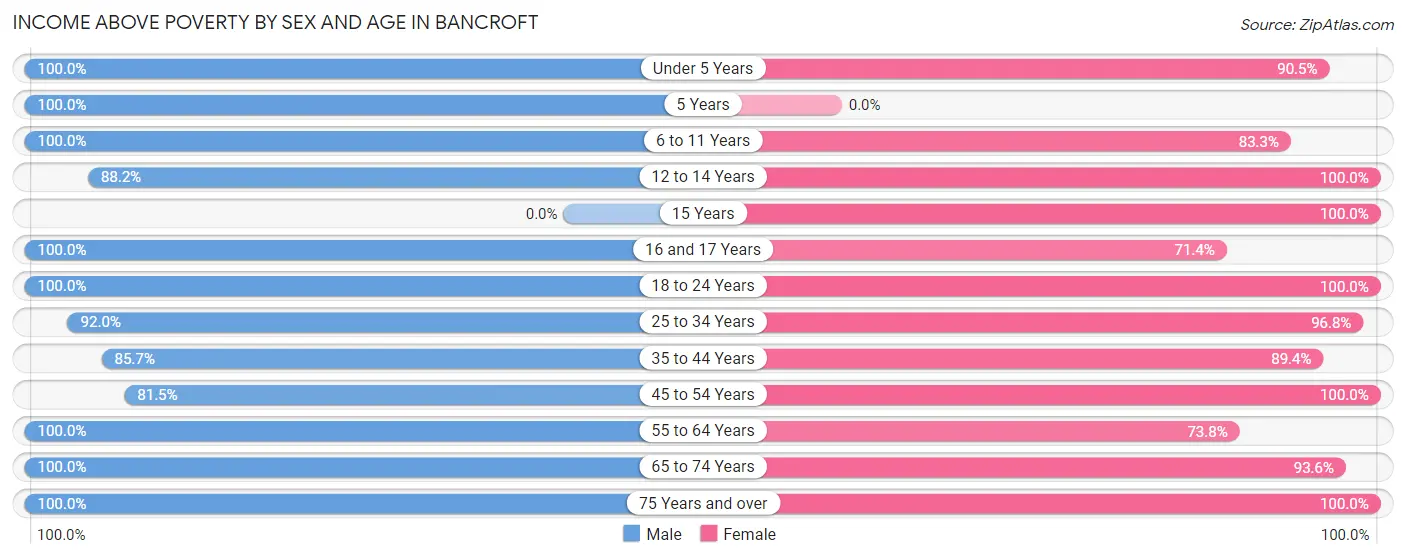
| Age Bracket | Male | Female |
| Under 5 Years | 8 (100.0%) | 19 (90.5%) |
| 5 Years | 6 (100.0%) | 0 (0.0%) |
| 6 to 11 Years | 19 (100.0%) | 15 (83.3%) |
| 12 to 14 Years | 15 (88.2%) | 10 (100.0%) |
| 15 Years | 0 (0.0%) | 1 (100.0%) |
| 16 and 17 Years | 2 (100.0%) | 5 (71.4%) |
| 18 to 24 Years | 35 (100.0%) | 47 (100.0%) |
| 25 to 34 Years | 23 (92.0%) | 30 (96.8%) |
| 35 to 44 Years | 12 (85.7%) | 42 (89.4%) |
| 45 to 54 Years | 22 (81.5%) | 23 (100.0%) |
| 55 to 64 Years | 30 (100.0%) | 31 (73.8%) |
| 65 to 74 Years | 14 (100.0%) | 29 (93.5%) |
| 75 Years and over | 13 (100.0%) | 12 (100.0%) |
| Total | 199 (94.8%) | 264 (91.0%) |
Income Below Poverty Among Married-Couple Families in Bancroft
The poverty statistics for married-couple families in Bancroft show that 7.1% or 6 of the total 84 families live below the poverty line. Families with 3 or 4 children have the highest poverty rate of 9.1%, comprising of 1 families. On the other hand, families with 1 or 2 children have the lowest poverty rate of 0.0%, which includes 0 families.
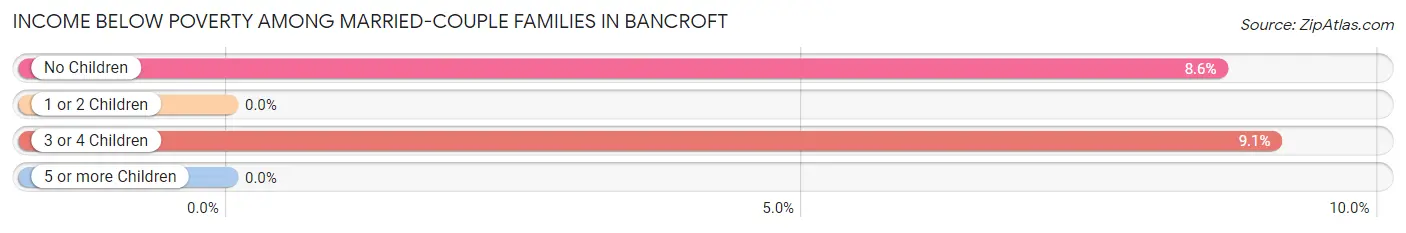
| Children | Above Poverty | Below Poverty |
| No Children | 53 (91.4%) | 5 (8.6%) |
| 1 or 2 Children | 15 (100.0%) | 0 (0.0%) |
| 3 or 4 Children | 10 (90.9%) | 1 (9.1%) |
| 5 or more Children | 0 (0.0%) | 0 (0.0%) |
| Total | 78 (92.9%) | 6 (7.1%) |
Income Below Poverty Among Single-Parent Households in Bancroft
According to the poverty data in Bancroft, 11.1% or 1 single-father households and 7.9% or 3 single-mother households are living below the poverty line. Among single-father households, those with 1 or 2 children have the highest poverty rate, with 1 households (16.7%) experiencing poverty. Likewise, among single-mother households, those with no children have the highest poverty rate, with 2 households (28.6%) falling below the poverty line.
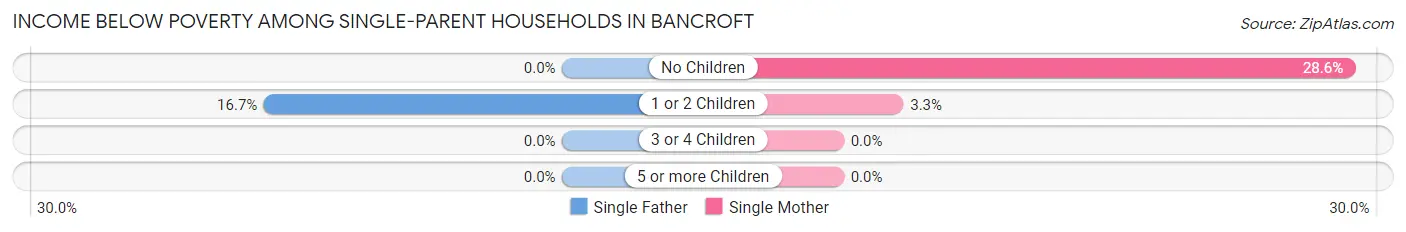
| Children | Single Father | Single Mother |
| No Children | 0 (0.0%) | 2 (28.6%) |
| 1 or 2 Children | 1 (16.7%) | 1 (3.3%) |
| 3 or 4 Children | 0 (0.0%) | 0 (0.0%) |
| 5 or more Children | 0 (0.0%) | 0 (0.0%) |
| Total | 1 (11.1%) | 3 (7.9%) |
Income Below Poverty Among Married-Couple vs Single-Parent Households in Bancroft
The poverty data for Bancroft shows that 6 of the married-couple family households (7.1%) and 4 of the single-parent households (8.5%) are living below the poverty level. Within the married-couple family households, those with 3 or 4 children have the highest poverty rate, with 1 households (9.1%) falling below the poverty line. Among the single-parent households, those with no children have the highest poverty rate, with 2 household (20.0%) living below poverty.
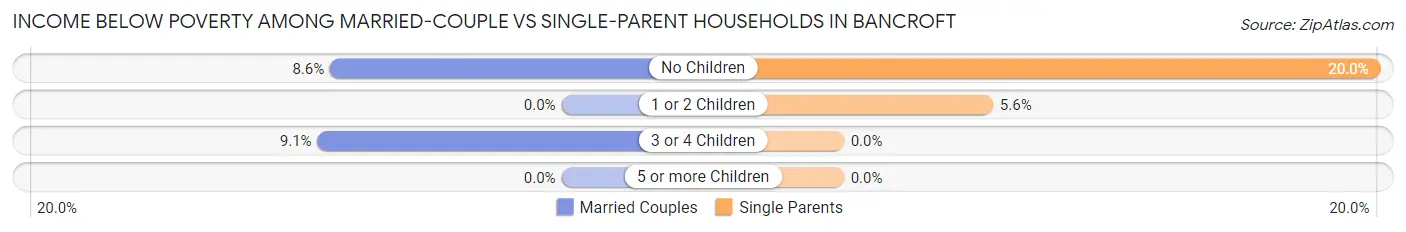
| Children | Married-Couple Families | Single-Parent Households |
| No Children | 5 (8.6%) | 2 (20.0%) |
| 1 or 2 Children | 0 (0.0%) | 2 (5.6%) |
| 3 or 4 Children | 1 (9.1%) | 0 (0.0%) |
| 5 or more Children | 0 (0.0%) | 0 (0.0%) |
| Total | 6 (7.1%) | 4 (8.5%) |
Race in Bancroft
The most populous races in Bancroft are White / Caucasian (466 | 93.2%), Hispanic or Latino (27 | 5.4%), and Two or more Races (20 | 4.0%).
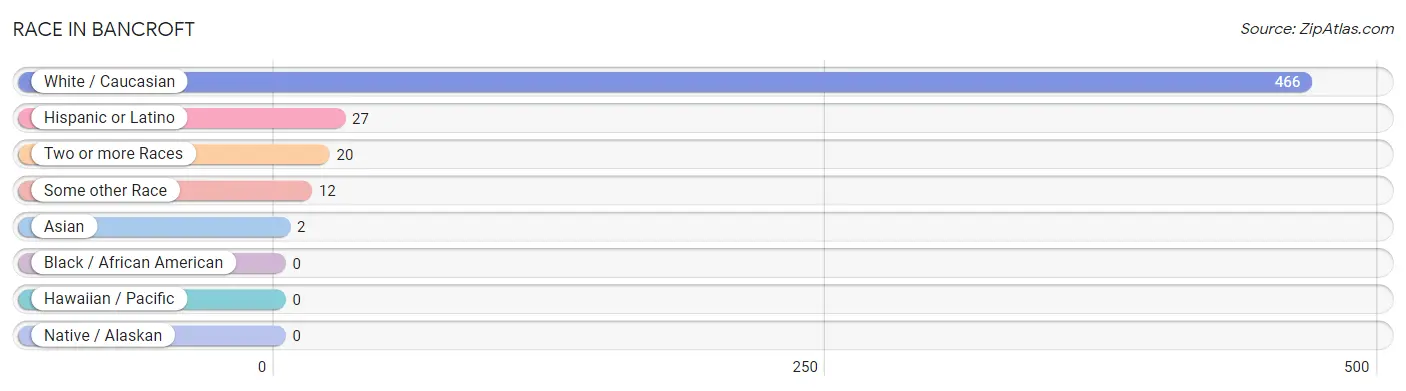
| Race | # Population | % Population |
| Asian | 2 | 0.4% |
| Black / African American | 0 | 0.0% |
| Hawaiian / Pacific | 0 | 0.0% |
| Hispanic or Latino | 27 | 5.4% |
| Native / Alaskan | 0 | 0.0% |
| White / Caucasian | 466 | 93.2% |
| Two or more Races | 20 | 4.0% |
| Some other Race | 12 | 2.4% |
| Total | 500 | 100.0% |
Ancestry in Bancroft
The most populous ancestries reported in Bancroft are German (197 | 39.4%), English (68 | 13.6%), Irish (63 | 12.6%), American (26 | 5.2%), and Polish (21 | 4.2%), together accounting for 75.0% of all Bancroft residents.
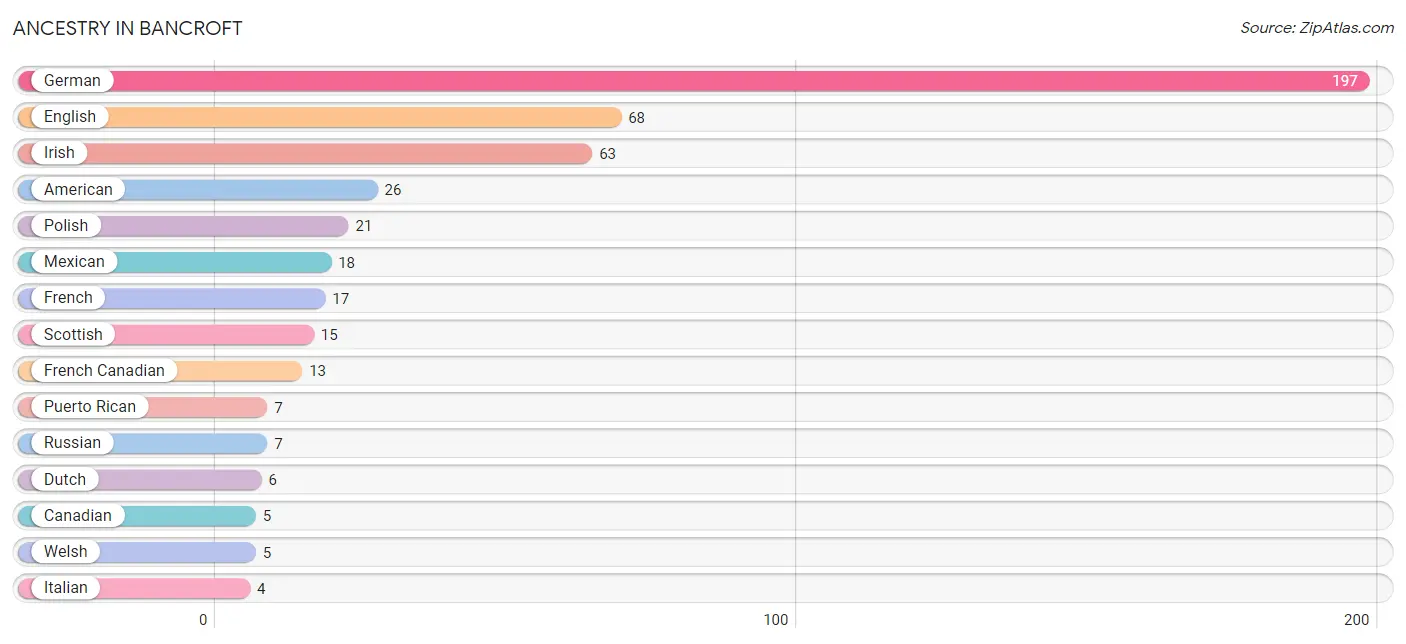
| Ancestry | # Population | % Population |
| American | 26 | 5.2% |
| British | 1 | 0.2% |
| Canadian | 5 | 1.0% |
| Czech | 3 | 0.6% |
| Dutch | 6 | 1.2% |
| English | 68 | 13.6% |
| European | 3 | 0.6% |
| Finnish | 1 | 0.2% |
| French | 17 | 3.4% |
| French American Indian | 2 | 0.4% |
| French Canadian | 13 | 2.6% |
| German | 197 | 39.4% |
| Irish | 63 | 12.6% |
| Italian | 4 | 0.8% |
| Korean | 2 | 0.4% |
| Maltese | 4 | 0.8% |
| Mexican | 18 | 3.6% |
| Ottawa | 2 | 0.4% |
| Polish | 21 | 4.2% |
| Puerto Rican | 7 | 1.4% |
| Russian | 7 | 1.4% |
| Scandinavian | 1 | 0.2% |
| Scotch-Irish | 1 | 0.2% |
| Scottish | 15 | 3.0% |
| Slovak | 1 | 0.2% |
| Spanish | 2 | 0.4% |
| Swiss | 1 | 0.2% |
| Welsh | 5 | 1.0% | View All 28 Rows |
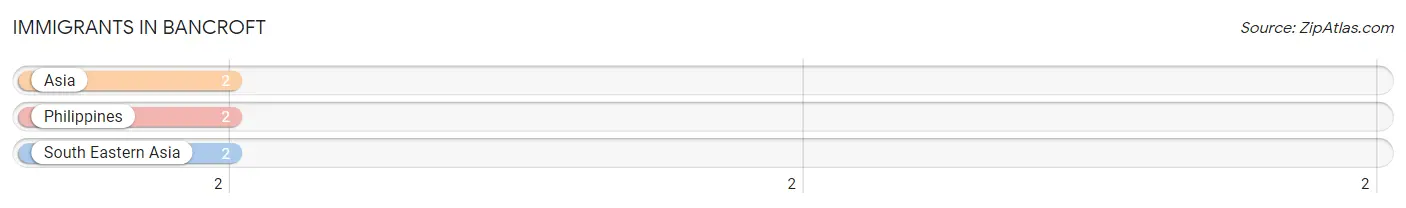
Immigrants in Bancroft
The most numerous immigrant groups reported in Bancroft came from Asia (2 | 0.4%), Philippines (2 | 0.4%), and South Eastern Asia (2 | 0.4%), together accounting for 1.2% of all Bancroft residents.
| Immigration Origin | # Population | % Population |
| Asia | 2 | 0.4% |
| Philippines | 2 | 0.4% |
| South Eastern Asia | 2 | 0.4% | View All 3 Rows |
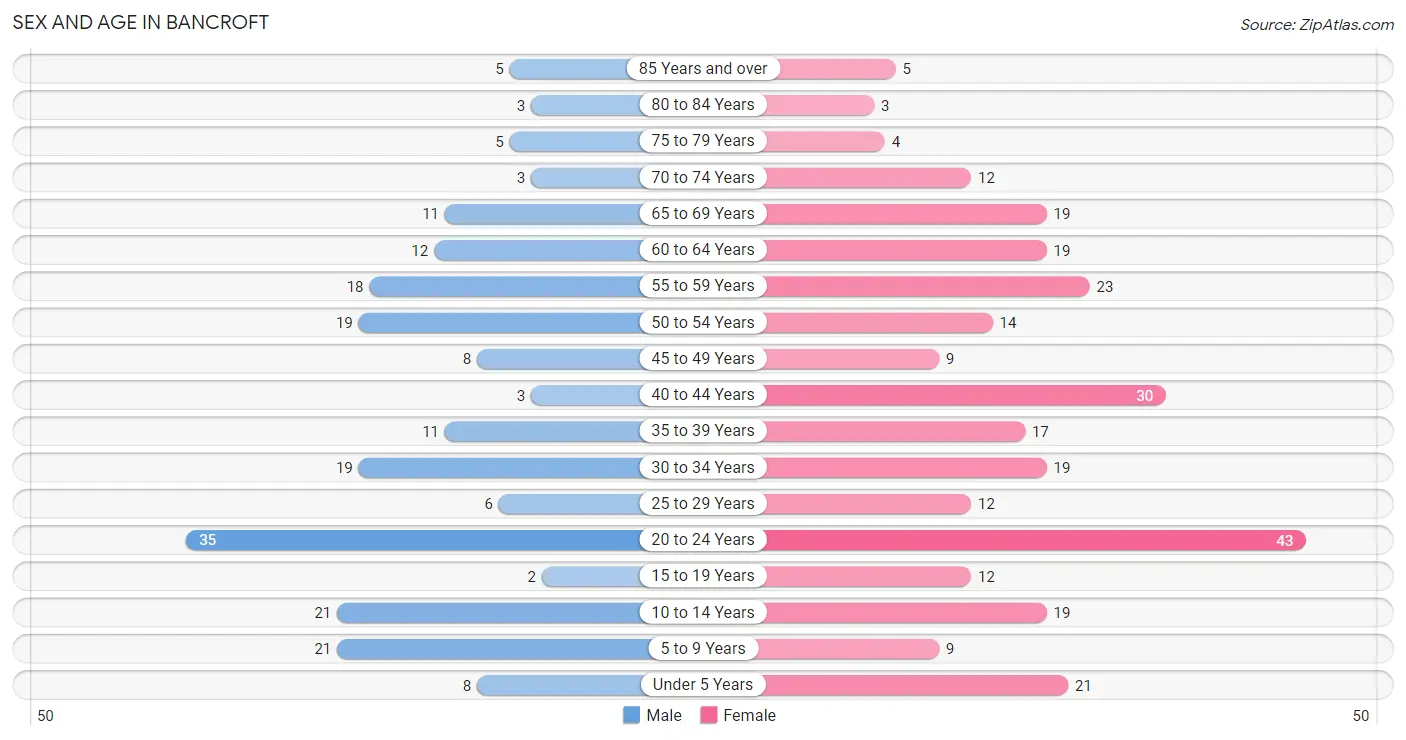
Sex and Age in Bancroft
Sex and Age in Bancroft
The most populous age groups in Bancroft are 20 to 24 Years (35 | 16.7%) for men and 20 to 24 Years (43 | 14.8%) for women.
| Age Bracket | Male | Female |
| Under 5 Years | 8 (3.8%) | 21 (7.2%) |
| 5 to 9 Years | 21 (10.0%) | 9 (3.1%) |
| 10 to 14 Years | 21 (10.0%) | 19 (6.6%) |
| 15 to 19 Years | 2 (0.9%) | 12 (4.1%) |
| 20 to 24 Years | 35 (16.7%) | 43 (14.8%) |
| 25 to 29 Years | 6 (2.9%) | 12 (4.1%) |
| 30 to 34 Years | 19 (9.0%) | 19 (6.6%) |
| 35 to 39 Years | 11 (5.2%) | 17 (5.9%) |
| 40 to 44 Years | 3 (1.4%) | 30 (10.3%) |
| 45 to 49 Years | 8 (3.8%) | 9 (3.1%) |
| 50 to 54 Years | 19 (9.0%) | 14 (4.8%) |
| 55 to 59 Years | 18 (8.6%) | 23 (7.9%) |
| 60 to 64 Years | 12 (5.7%) | 19 (6.6%) |
| 65 to 69 Years | 11 (5.2%) | 19 (6.6%) |
| 70 to 74 Years | 3 (1.4%) | 12 (4.1%) |
| 75 to 79 Years | 5 (2.4%) | 4 (1.4%) |
| 80 to 84 Years | 3 (1.4%) | 3 (1.0%) |
| 85 Years and over | 5 (2.4%) | 5 (1.7%) |
| Total | 210 (100.0%) | 290 (100.0%) |
Families and Households in Bancroft
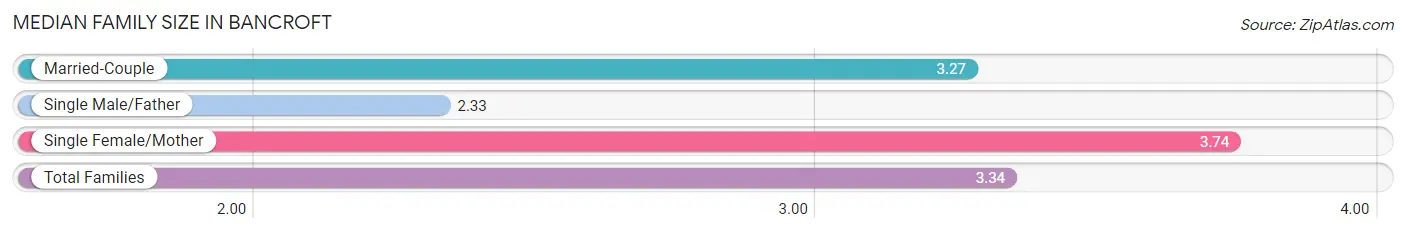
Median Family Size in Bancroft
The median family size in Bancroft is 3.34 persons per family, with single female/mother families (38 | 29.0%) accounting for the largest median family size of 3.74 persons per family. On the other hand, single male/father families (9 | 6.9%) represent the smallest median family size with 2.33 persons per family.
| Family Type | # Families | Family Size |
| Married-Couple | 84 (64.1%) | 3.27 |
| Single Male/Father | 9 (6.9%) | 2.33 |
| Single Female/Mother | 38 (29.0%) | 3.74 |
| Total Families | 131 (100.0%) | 3.34 |
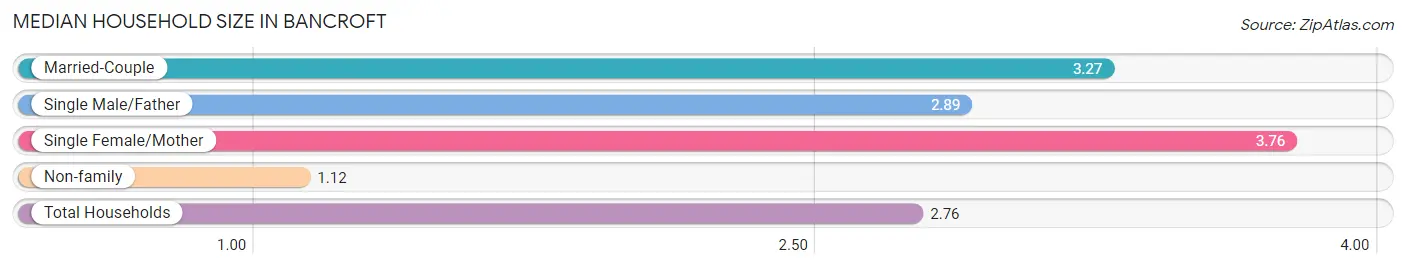
Median Household Size in Bancroft
The median household size in Bancroft is 2.76 persons per household, with single female/mother households (38 | 21.0%) accounting for the largest median household size of 3.76 persons per household. non-family households (50 | 27.6%) represent the smallest median household size with 1.12 persons per household.
| Household Type | # Households | Household Size |
| Married-Couple | 84 (46.4%) | 3.27 |
| Single Male/Father | 9 (5.0%) | 2.89 |
| Single Female/Mother | 38 (21.0%) | 3.76 |
| Non-family | 50 (27.6%) | 1.12 |
| Total Households | 181 (100.0%) | 2.76 |
Household Size by Marriage Status in Bancroft
Out of a total of 181 households in Bancroft, 131 (72.4%) are family households, while 50 (27.6%) are nonfamily households. The most numerous type of family households are 2-person households, comprising 49, and the most common type of nonfamily households are 1-person households, comprising 45.
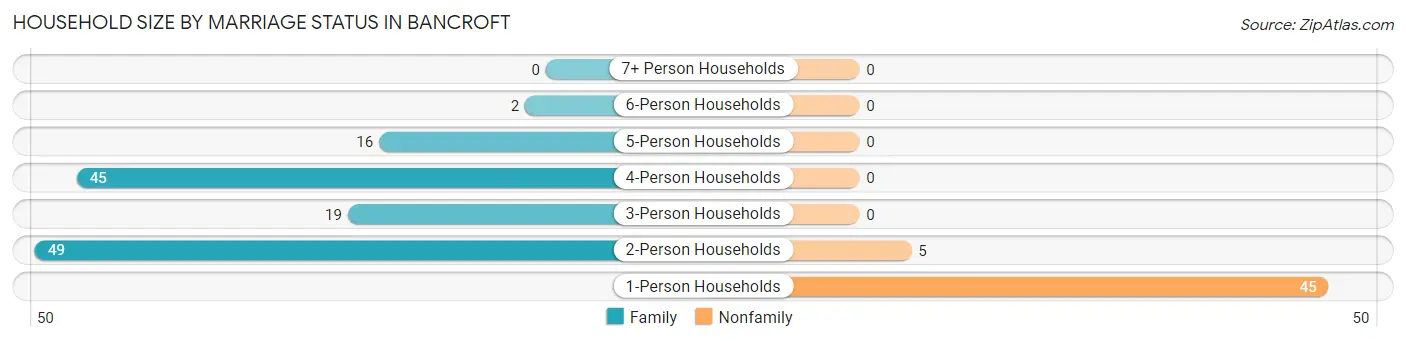
| Household Size | Family Households | Nonfamily Households |
| 1-Person Households | - | 45 (24.9%) |
| 2-Person Households | 49 (27.1%) | 5 (2.8%) |
| 3-Person Households | 19 (10.5%) | 0 (0.0%) |
| 4-Person Households | 45 (24.9%) | 0 (0.0%) |
| 5-Person Households | 16 (8.8%) | 0 (0.0%) |
| 6-Person Households | 2 (1.1%) | 0 (0.0%) |
| 7+ Person Households | 0 (0.0%) | 0 (0.0%) |
| Total | 131 (72.4%) | 50 (27.6%) |
Female Fertility in Bancroft
Fertility by Age in Bancroft
Average fertility rate in Bancroft is 28.0 births per 1,000 women. Women in the age bracket of 20 to 34 years have the highest fertility rate with 54.0 births per 1,000 women. Women in the age bracket of 20 to 34 years acount for 100.0% of all women with births.
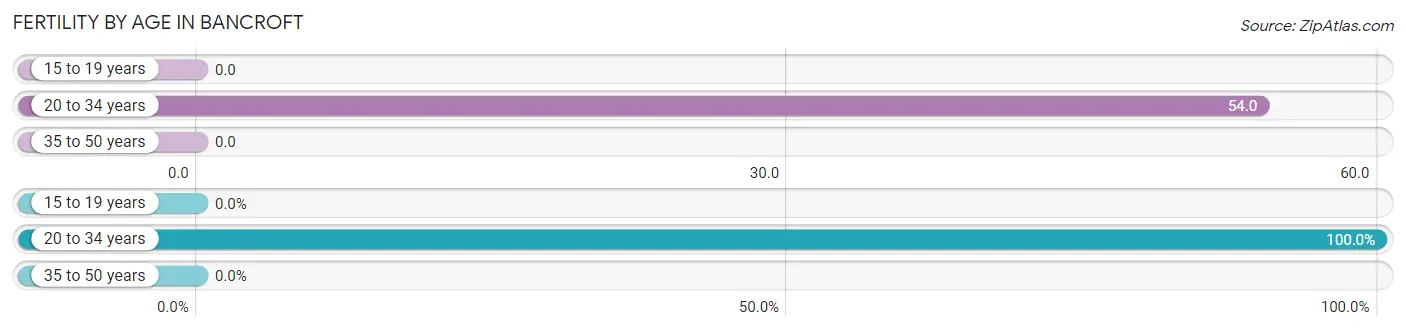
| Age Bracket | Women with Births | Births / 1,000 Women |
| 15 to 19 years | 0 (0.0%) | 0.0 |
| 20 to 34 years | 4 (100.0%) | 54.0 |
| 35 to 50 years | 0 (0.0%) | 0.0 |
| Total | 4 (100.0%) | 28.0 |
Fertility by Age by Marriage Status in Bancroft
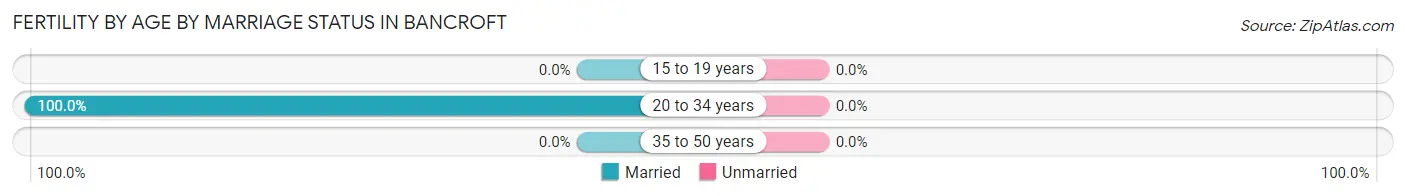
| Age Bracket | Married | Unmarried |
| 15 to 19 years | 0 (0.0%) | 0 (0.0%) |
| 20 to 34 years | 4 (100.0%) | 0 (0.0%) |
| 35 to 50 years | 0 (0.0%) | 0 (0.0%) |
| Total | 4 (100.0%) | 0 (0.0%) |
Fertility by Education in Bancroft
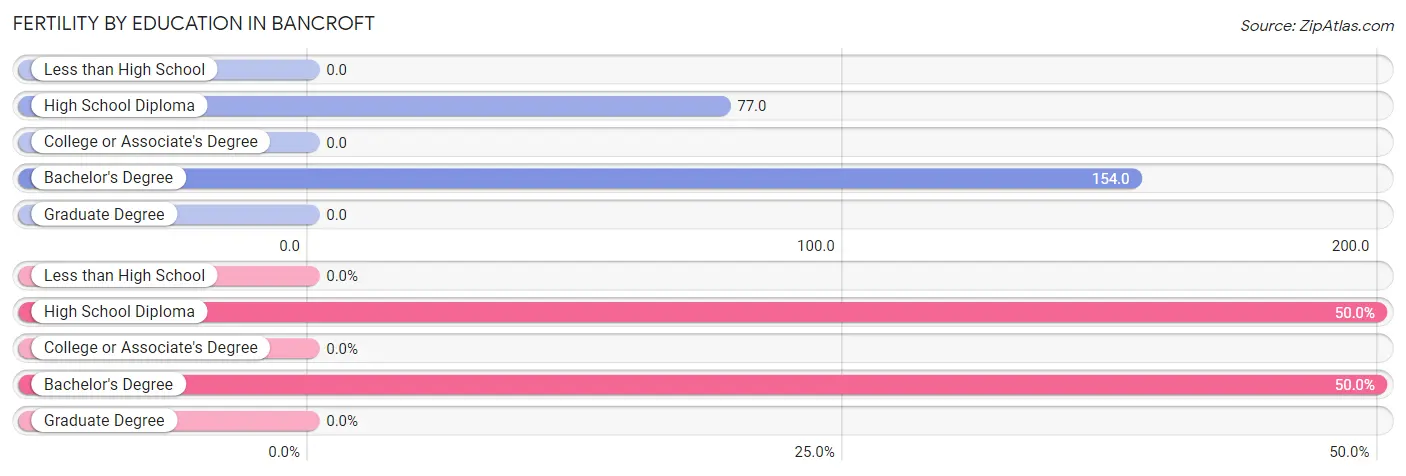
| Educational Attainment | Women with Births | Births / 1,000 Women |
| Less than High School | 0 (0.0%) | 0.0 |
| High School Diploma | 2 (50.0%) | 77.0 |
| College or Associate's Degree | 0 (0.0%) | 0.0 |
| Bachelor's Degree | 2 (50.0%) | 154.0 |
| Graduate Degree | 0 (0.0%) | 0.0 |
| Total | 4 (100.0%) | 28.0 |
Fertility by Education by Marriage Status in Bancroft
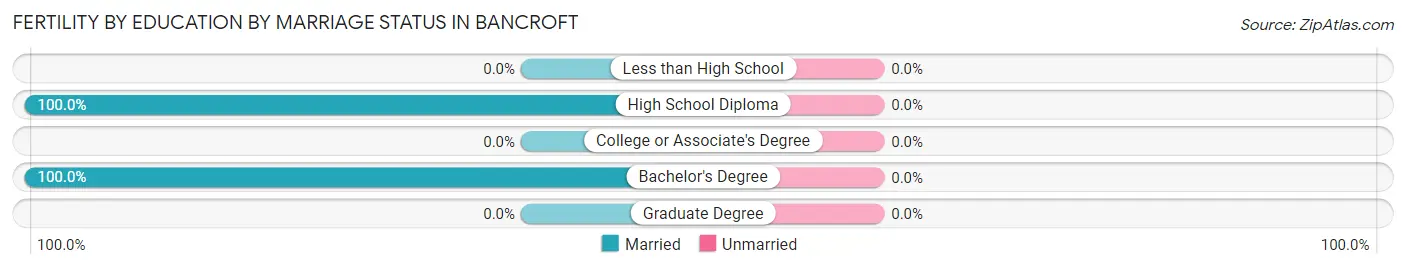
| Educational Attainment | Married | Unmarried |
| Less than High School | 0 (0.0%) | 0 (0.0%) |
| High School Diploma | 2 (100.0%) | 0 (0.0%) |
| College or Associate's Degree | 0 (0.0%) | 0 (0.0%) |
| Bachelor's Degree | 2 (100.0%) | 0 (0.0%) |
| Graduate Degree | 0 (0.0%) | 0 (0.0%) |
| Total | 4 (100.0%) | 0 (0.0%) |
Employment Characteristics in Bancroft
Employment by Class of Employer in Bancroft
Among the 246 employed individuals in Bancroft, private company employees (191 | 77.6%), federal government employees (16 | 6.5%), and not-for-profit organizations (15 | 6.1%) make up the most common classes of employment.
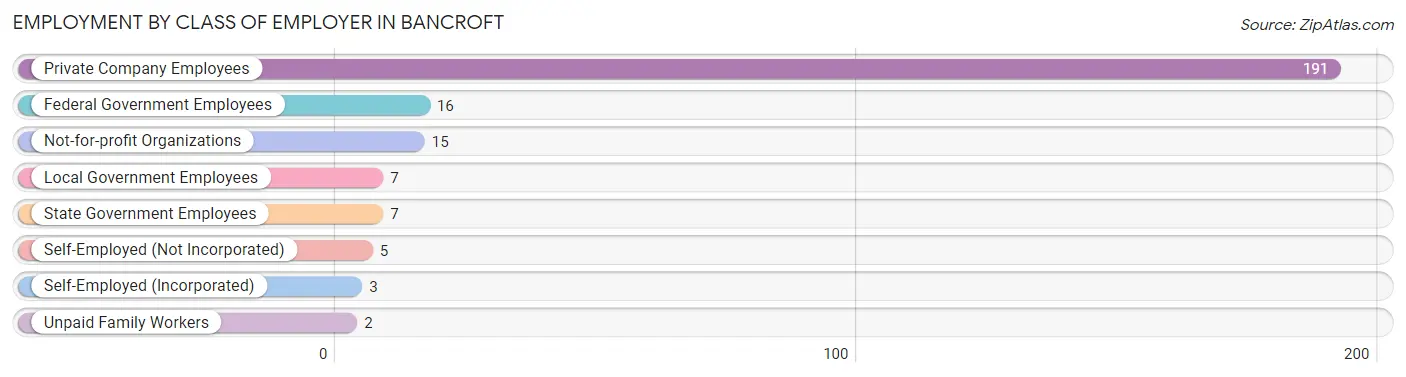
| Employer Class | # Employees | % Employees |
| Private Company Employees | 191 | 77.6% |
| Self-Employed (Incorporated) | 3 | 1.2% |
| Self-Employed (Not Incorporated) | 5 | 2.0% |
| Not-for-profit Organizations | 15 | 6.1% |
| Local Government Employees | 7 | 2.9% |
| State Government Employees | 7 | 2.9% |
| Federal Government Employees | 16 | 6.5% |
| Unpaid Family Workers | 2 | 0.8% |
| Total | 246 | 100.0% |
Employment Status by Age in Bancroft
According to the labor force statistics for Bancroft, out of the total population over 16 years of age (400), 64.3% or 257 individuals are in the labor force, with 2.7% or 7 of them unemployed. The age group with the highest labor force participation rate is 20 to 24 years, with 97.4% or 76 individuals in the labor force. Within the labor force, the 16 to 19 years age range has the highest percentage of unemployed individuals, with 80.0% or 4 of them being unemployed.
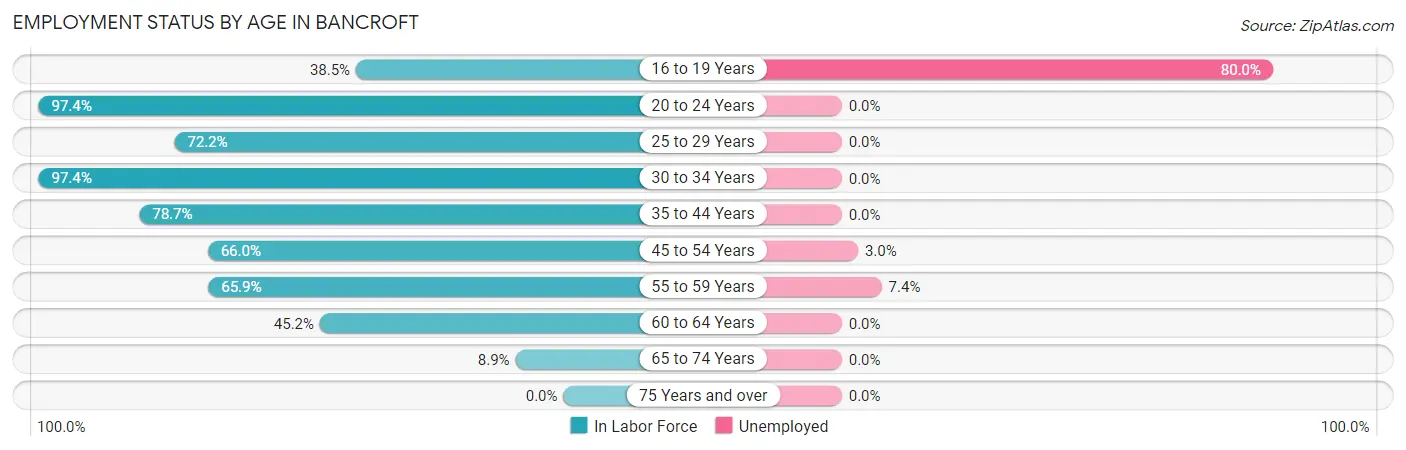
| Age Bracket | In Labor Force | Unemployed |
| 16 to 19 Years | 5 (38.5%) | 4 (80.0%) |
| 20 to 24 Years | 76 (97.4%) | 0 (0.0%) |
| 25 to 29 Years | 13 (72.2%) | 0 (0.0%) |
| 30 to 34 Years | 37 (97.4%) | 0 (0.0%) |
| 35 to 44 Years | 48 (78.7%) | 0 (0.0%) |
| 45 to 54 Years | 33 (66.0%) | 1 (3.0%) |
| 55 to 59 Years | 27 (65.9%) | 2 (7.4%) |
| 60 to 64 Years | 14 (45.2%) | 0 (0.0%) |
| 65 to 74 Years | 4 (8.9%) | 0 (0.0%) |
| 75 Years and over | 0 (0.0%) | 0 (0.0%) |
| Total | 257 (64.3%) | 7 (2.7%) |
Employment Status by Educational Attainment in Bancroft
According to labor force statistics for Bancroft, 72.0% of individuals (172) out of the total population between 25 and 64 years of age (239) are in the labor force, with 1.7% or 3 of them being unemployed. The group with the highest labor force participation rate are those with the educational attainment of bachelor's degree or higher, with 88.9% or 24 individuals in the labor force. Within the labor force, individuals with college / associate degree education have the highest percentage of unemployment, with 3.5% or 3 of them being unemployed.
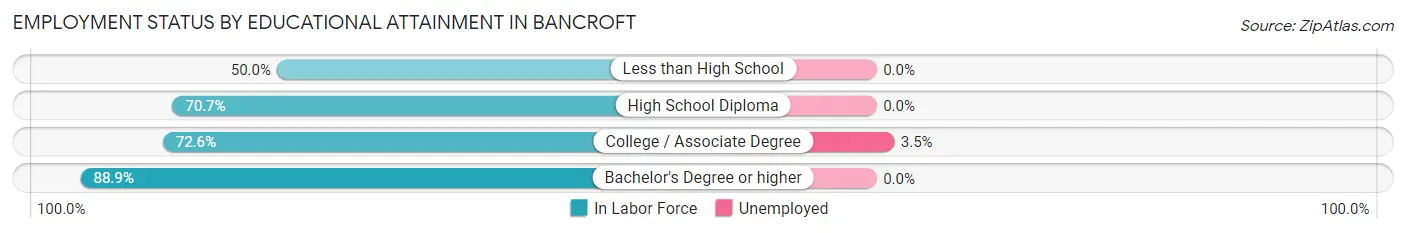
| Educational Attainment | In Labor Force | Unemployed |
| Less than High School | 10 (50.0%) | 0 (0.0%) |
| High School Diploma | 53 (70.7%) | 0 (0.0%) |
| College / Associate Degree | 85 (72.6%) | 4 (3.5%) |
| Bachelor's Degree or higher | 24 (88.9%) | 0 (0.0%) |
| Total | 172 (72.0%) | 4 (1.7%) |
Employment Occupations by Sex in Bancroft
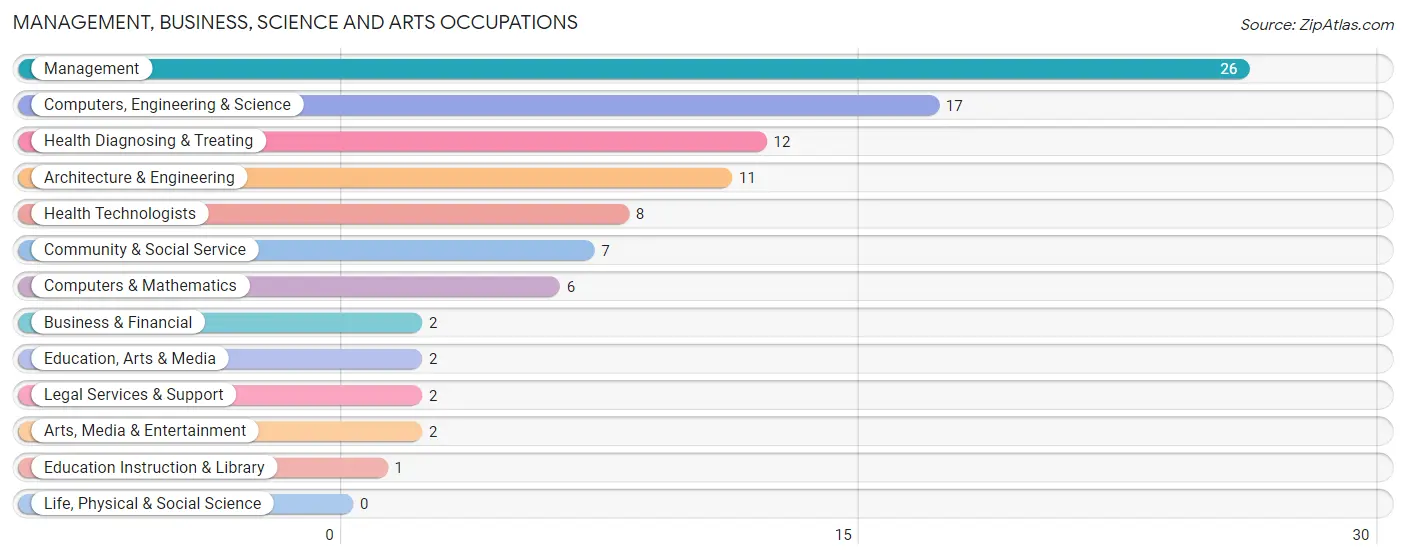
Management, Business, Science and Arts Occupations
The most common Management, Business, Science and Arts occupations in Bancroft are Management (26 | 10.4%), Computers, Engineering & Science (17 | 6.8%), Health Diagnosing & Treating (12 | 4.8%), Architecture & Engineering (11 | 4.4%), and Health Technologists (8 | 3.2%).
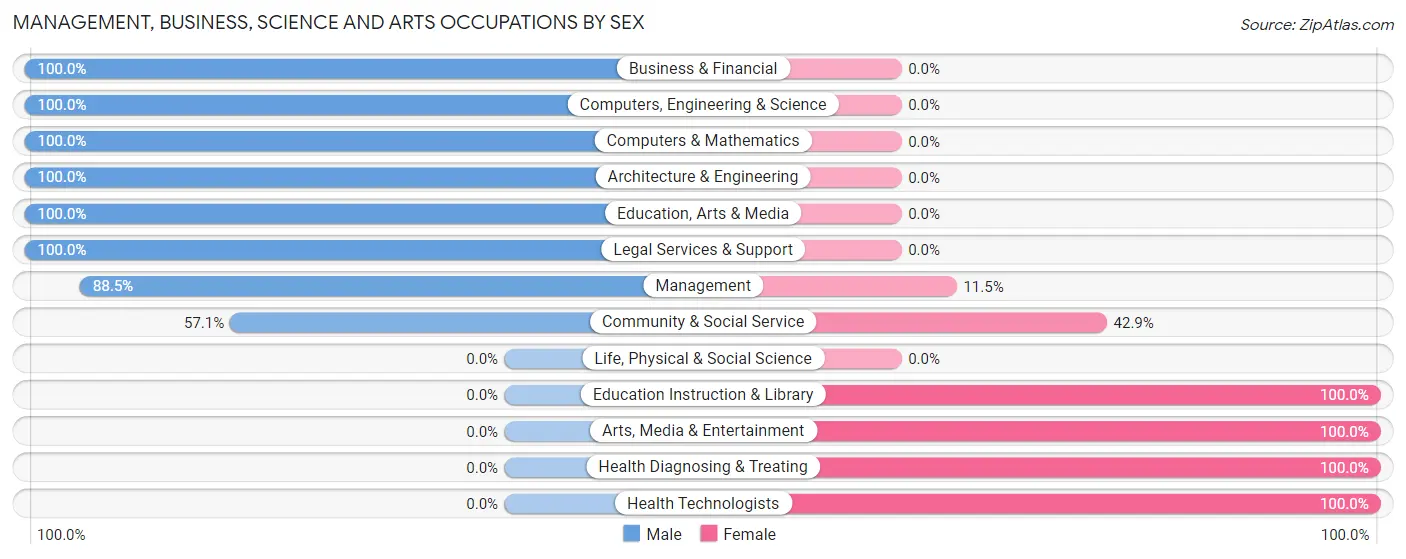
Management, Business, Science and Arts Occupations by Sex
Within the Management, Business, Science and Arts occupations in Bancroft, the most male-oriented occupations are Business & Financial (100.0%), Computers, Engineering & Science (100.0%), and Computers & Mathematics (100.0%), while the most female-oriented occupations are Education Instruction & Library (100.0%), Arts, Media & Entertainment (100.0%), and Health Diagnosing & Treating (100.0%).
| Occupation | Male | Female |
| Management | 23 (88.5%) | 3 (11.5%) |
| Business & Financial | 2 (100.0%) | 0 (0.0%) |
| Computers, Engineering & Science | 17 (100.0%) | 0 (0.0%) |
| Computers & Mathematics | 6 (100.0%) | 0 (0.0%) |
| Architecture & Engineering | 11 (100.0%) | 0 (0.0%) |
| Life, Physical & Social Science | 0 (0.0%) | 0 (0.0%) |
| Community & Social Service | 4 (57.1%) | 3 (42.9%) |
| Education, Arts & Media | 2 (100.0%) | 0 (0.0%) |
| Legal Services & Support | 2 (100.0%) | 0 (0.0%) |
| Education Instruction & Library | 0 (0.0%) | 1 (100.0%) |
| Arts, Media & Entertainment | 0 (0.0%) | 2 (100.0%) |
| Health Diagnosing & Treating | 0 (0.0%) | 12 (100.0%) |
| Health Technologists | 0 (0.0%) | 8 (100.0%) |
| Total (Category) | 46 (71.9%) | 18 (28.1%) |
| Total (Overall) | 117 (46.8%) | 133 (53.2%) |
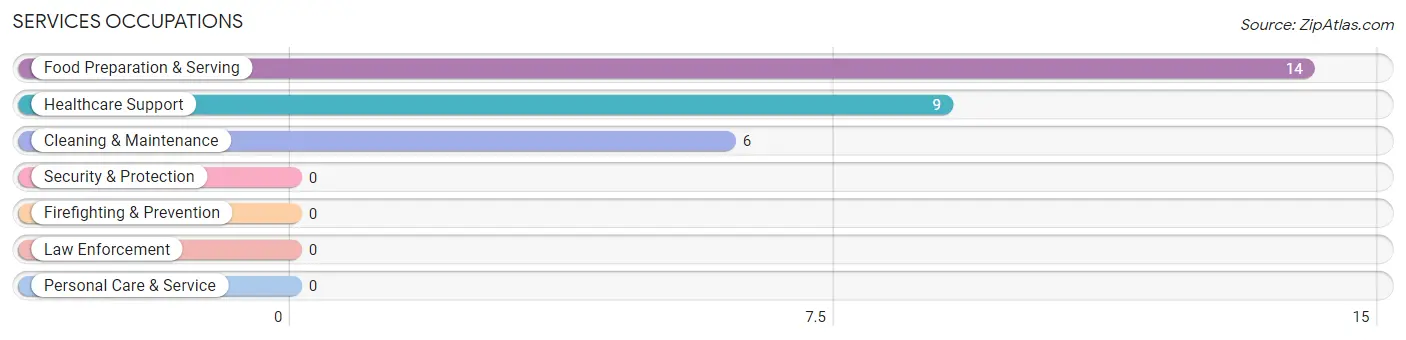
Services Occupations
The most common Services occupations in Bancroft are Food Preparation & Serving (14 | 5.6%), Healthcare Support (9 | 3.6%), and Cleaning & Maintenance (6 | 2.4%).
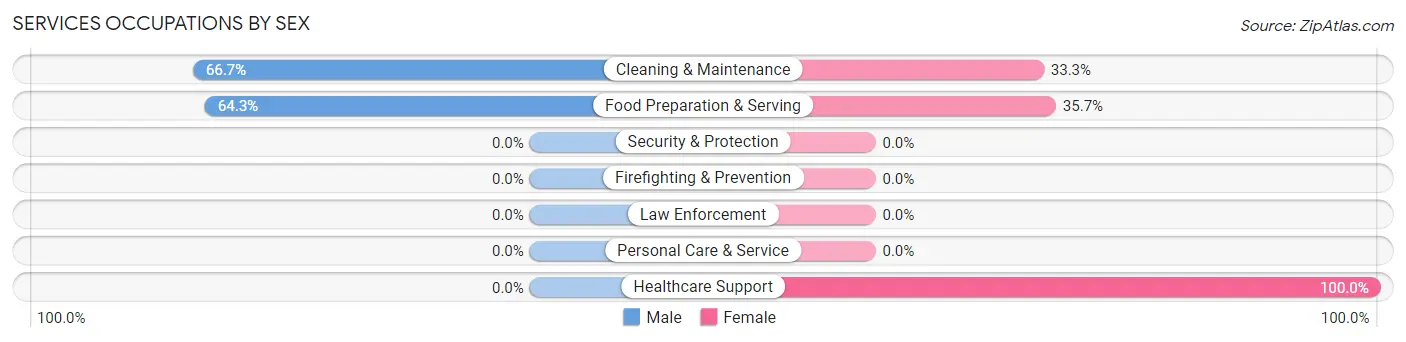
Services Occupations by Sex
Within the Services occupations in Bancroft, the most male-oriented occupations are Cleaning & Maintenance (66.7%), and Food Preparation & Serving (64.3%), while the most female-oriented occupations are Healthcare Support (100.0%), Food Preparation & Serving (35.7%), and Cleaning & Maintenance (33.3%).
| Occupation | Male | Female |
| Healthcare Support | 0 (0.0%) | 9 (100.0%) |
| Security & Protection | 0 (0.0%) | 0 (0.0%) |
| Firefighting & Prevention | 0 (0.0%) | 0 (0.0%) |
| Law Enforcement | 0 (0.0%) | 0 (0.0%) |
| Food Preparation & Serving | 9 (64.3%) | 5 (35.7%) |
| Cleaning & Maintenance | 4 (66.7%) | 2 (33.3%) |
| Personal Care & Service | 0 (0.0%) | 0 (0.0%) |
| Total (Category) | 13 (44.8%) | 16 (55.2%) |
| Total (Overall) | 117 (46.8%) | 133 (53.2%) |
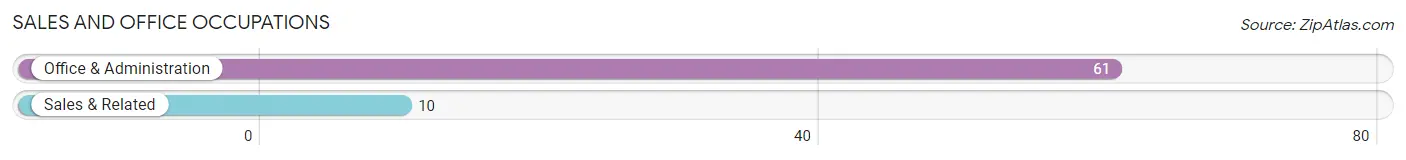
Sales and Office Occupations
The most common Sales and Office occupations in Bancroft are Office & Administration (61 | 24.4%), and Sales & Related (10 | 4.0%).
Sales and Office Occupations by Sex
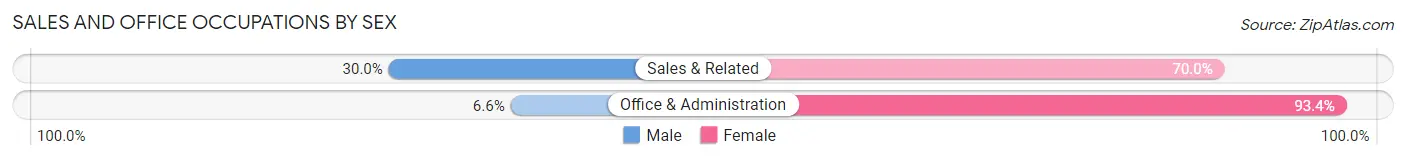
| Occupation | Male | Female |
| Sales & Related | 3 (30.0%) | 7 (70.0%) |
| Office & Administration | 4 (6.6%) | 57 (93.4%) |
| Total (Category) | 7 (9.9%) | 64 (90.1%) |
| Total (Overall) | 117 (46.8%) | 133 (53.2%) |
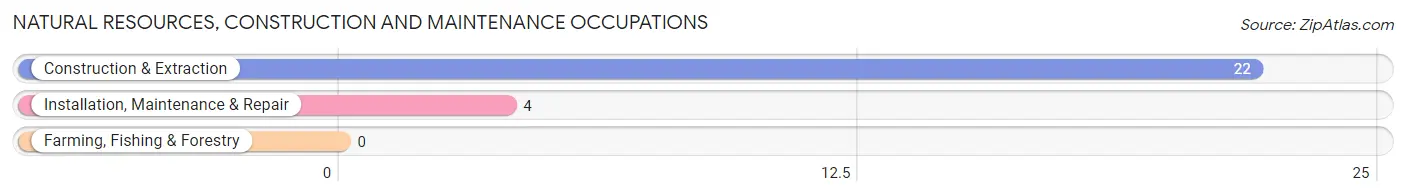
Natural Resources, Construction and Maintenance Occupations
The most common Natural Resources, Construction and Maintenance occupations in Bancroft are Construction & Extraction (22 | 8.8%), and Installation, Maintenance & Repair (4 | 1.6%).
Natural Resources, Construction and Maintenance Occupations by Sex
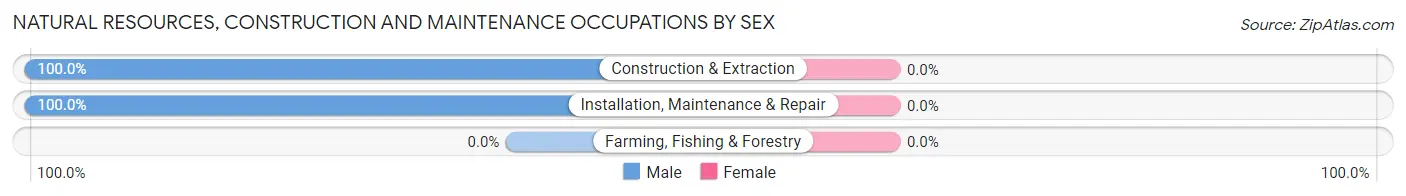
| Occupation | Male | Female |
| Farming, Fishing & Forestry | 0 (0.0%) | 0 (0.0%) |
| Construction & Extraction | 22 (100.0%) | 0 (0.0%) |
| Installation, Maintenance & Repair | 4 (100.0%) | 0 (0.0%) |
| Total (Category) | 26 (100.0%) | 0 (0.0%) |
| Total (Overall) | 117 (46.8%) | 133 (53.2%) |
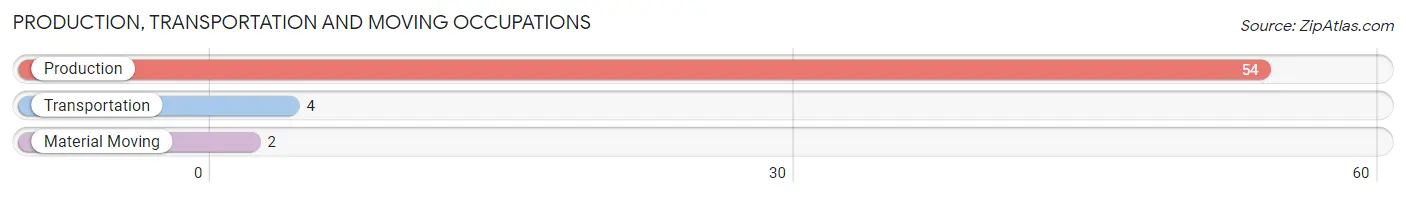
Production, Transportation and Moving Occupations
The most common Production, Transportation and Moving occupations in Bancroft are Production (54 | 21.6%), Transportation (4 | 1.6%), and Material Moving (2 | 0.8%).
Production, Transportation and Moving Occupations by Sex
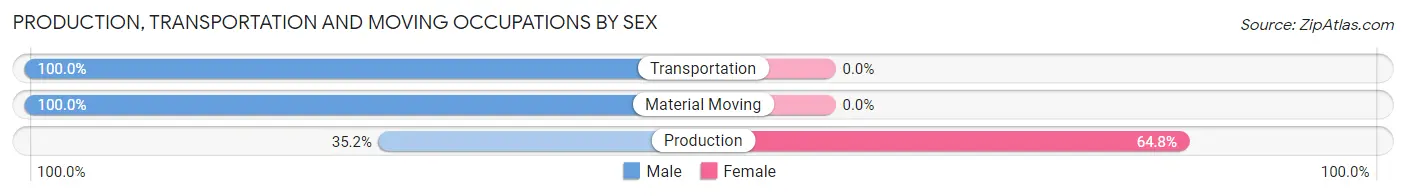
| Occupation | Male | Female |
| Production | 19 (35.2%) | 35 (64.8%) |
| Transportation | 4 (100.0%) | 0 (0.0%) |
| Material Moving | 2 (100.0%) | 0 (0.0%) |
| Total (Category) | 25 (41.7%) | 35 (58.3%) |
| Total (Overall) | 117 (46.8%) | 133 (53.2%) |
Employment Industries by Sex in Bancroft
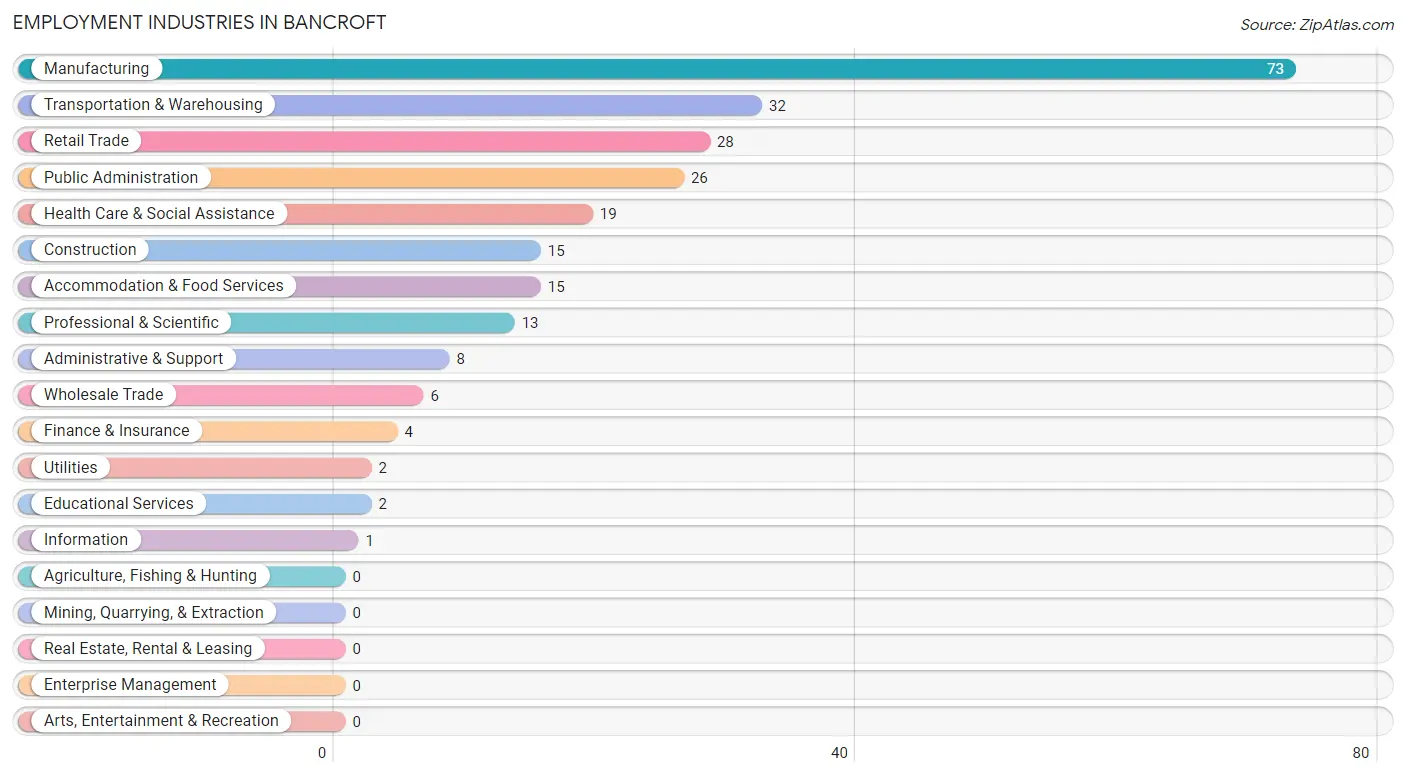
Employment Industries in Bancroft
The major employment industries in Bancroft include Manufacturing (73 | 29.2%), Transportation & Warehousing (32 | 12.8%), Retail Trade (28 | 11.2%), Public Administration (26 | 10.4%), and Health Care & Social Assistance (19 | 7.6%).
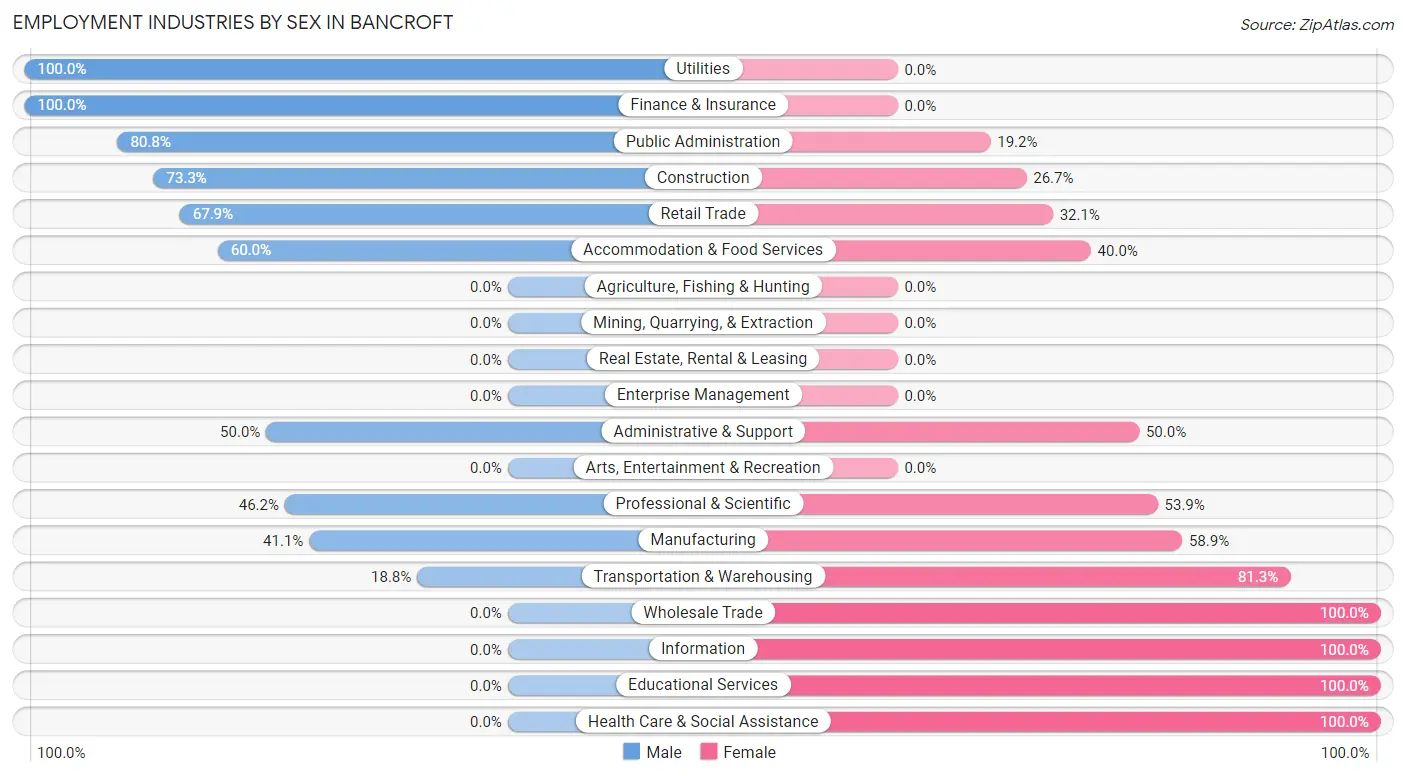
Employment Industries by Sex in Bancroft
The Bancroft industries that see more men than women are Utilities (100.0%), Finance & Insurance (100.0%), and Public Administration (80.8%), whereas the industries that tend to have a higher number of women are Wholesale Trade (100.0%), Information (100.0%), and Educational Services (100.0%).
| Industry | Male | Female |
| Agriculture, Fishing & Hunting | 0 (0.0%) | 0 (0.0%) |
| Mining, Quarrying, & Extraction | 0 (0.0%) | 0 (0.0%) |
| Construction | 11 (73.3%) | 4 (26.7%) |
| Manufacturing | 30 (41.1%) | 43 (58.9%) |
| Wholesale Trade | 0 (0.0%) | 6 (100.0%) |
| Retail Trade | 19 (67.9%) | 9 (32.1%) |
| Transportation & Warehousing | 6 (18.8%) | 26 (81.2%) |
| Utilities | 2 (100.0%) | 0 (0.0%) |
| Information | 0 (0.0%) | 1 (100.0%) |
| Finance & Insurance | 4 (100.0%) | 0 (0.0%) |
| Real Estate, Rental & Leasing | 0 (0.0%) | 0 (0.0%) |
| Professional & Scientific | 6 (46.2%) | 7 (53.8%) |
| Enterprise Management | 0 (0.0%) | 0 (0.0%) |
| Administrative & Support | 4 (50.0%) | 4 (50.0%) |
| Educational Services | 0 (0.0%) | 2 (100.0%) |
| Health Care & Social Assistance | 0 (0.0%) | 19 (100.0%) |
| Arts, Entertainment & Recreation | 0 (0.0%) | 0 (0.0%) |
| Accommodation & Food Services | 9 (60.0%) | 6 (40.0%) |
| Public Administration | 21 (80.8%) | 5 (19.2%) |
| Total | 117 (46.8%) | 133 (53.2%) |
Education in Bancroft
School Enrollment in Bancroft
The most common levels of schooling among the 99 students in Bancroft are middle school (35 | 35.3%), high school (26 | 26.3%), and elementary school (22 | 22.2%).
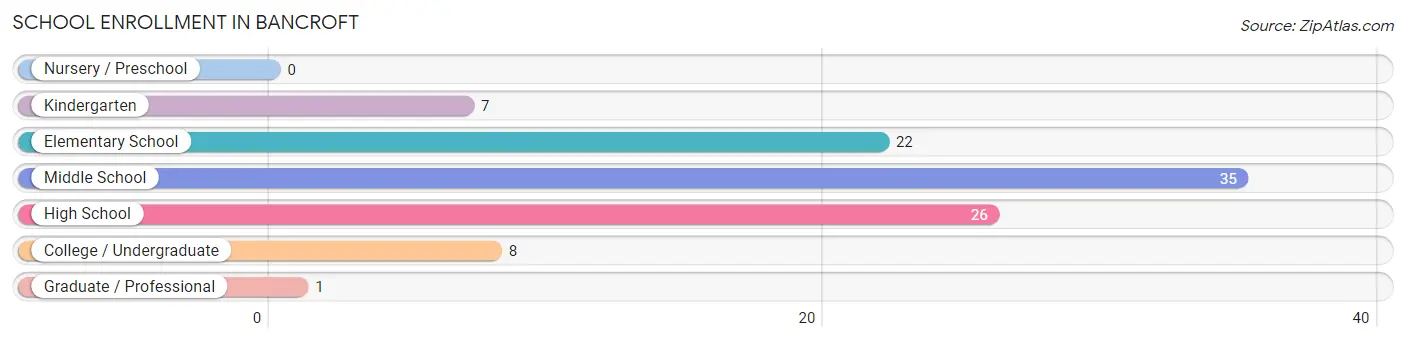
| School Level | # Students | % Students |
| Nursery / Preschool | 0 | 0.0% |
| Kindergarten | 7 | 7.1% |
| Elementary School | 22 | 22.2% |
| Middle School | 35 | 35.3% |
| High School | 26 | 26.3% |
| College / Undergraduate | 8 | 8.1% |
| Graduate / Professional | 1 | 1.0% |
| Total | 99 | 100.0% |
School Enrollment by Age by Funding Source in Bancroft
Out of a total of 99 students who are enrolled in schools in Bancroft, 15 (15.2%) attend a private institution, while the remaining 84 (84.8%) are enrolled in public schools. The age group of 35 years and over has the highest likelihood of being enrolled in private schools, with 1 (33.3% in the age bracket) enrolled. Conversely, the age group of 25 to 34 year olds has the lowest likelihood of being enrolled in a private school, with 4 (100.0% in the age bracket) attending a public institution.
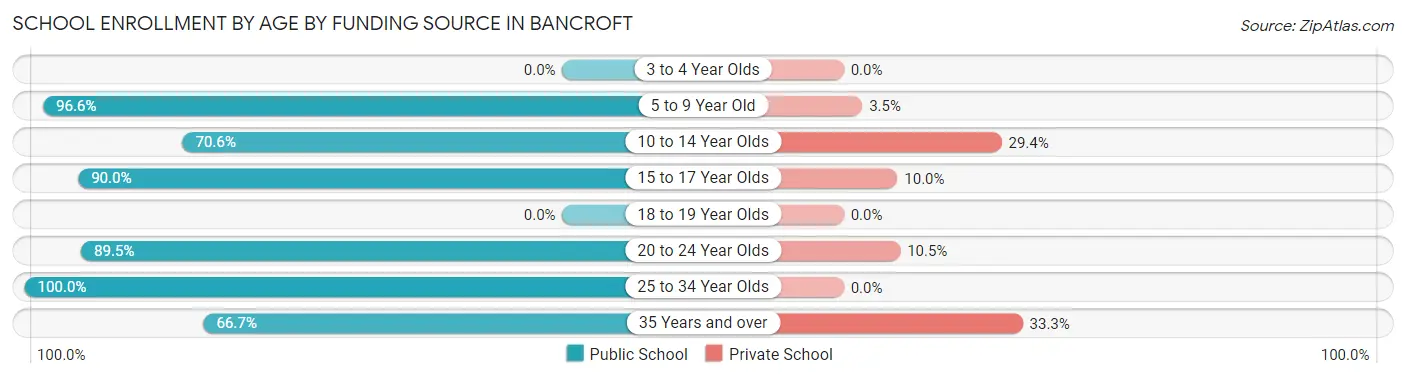
| Age Bracket | Public School | Private School |
| 3 to 4 Year Olds | 0 (0.0%) | 0 (0.0%) |
| 5 to 9 Year Old | 28 (96.6%) | 1 (3.5%) |
| 10 to 14 Year Olds | 24 (70.6%) | 10 (29.4%) |
| 15 to 17 Year Olds | 9 (90.0%) | 1 (10.0%) |
| 18 to 19 Year Olds | 0 (0.0%) | 0 (0.0%) |
| 20 to 24 Year Olds | 17 (89.5%) | 2 (10.5%) |
| 25 to 34 Year Olds | 4 (100.0%) | 0 (0.0%) |
| 35 Years and over | 2 (66.7%) | 1 (33.3%) |
| Total | 84 (84.8%) | 15 (15.2%) |
Educational Attainment by Field of Study in Bancroft
Business (9 | 23.7%), literature & languages (8 | 21.0%), science & technology (7 | 18.4%), visual & performing arts (3 | 7.9%), and arts & humanities (3 | 7.9%) are the most common fields of study among 38 individuals in Bancroft who have obtained a bachelor's degree or higher.
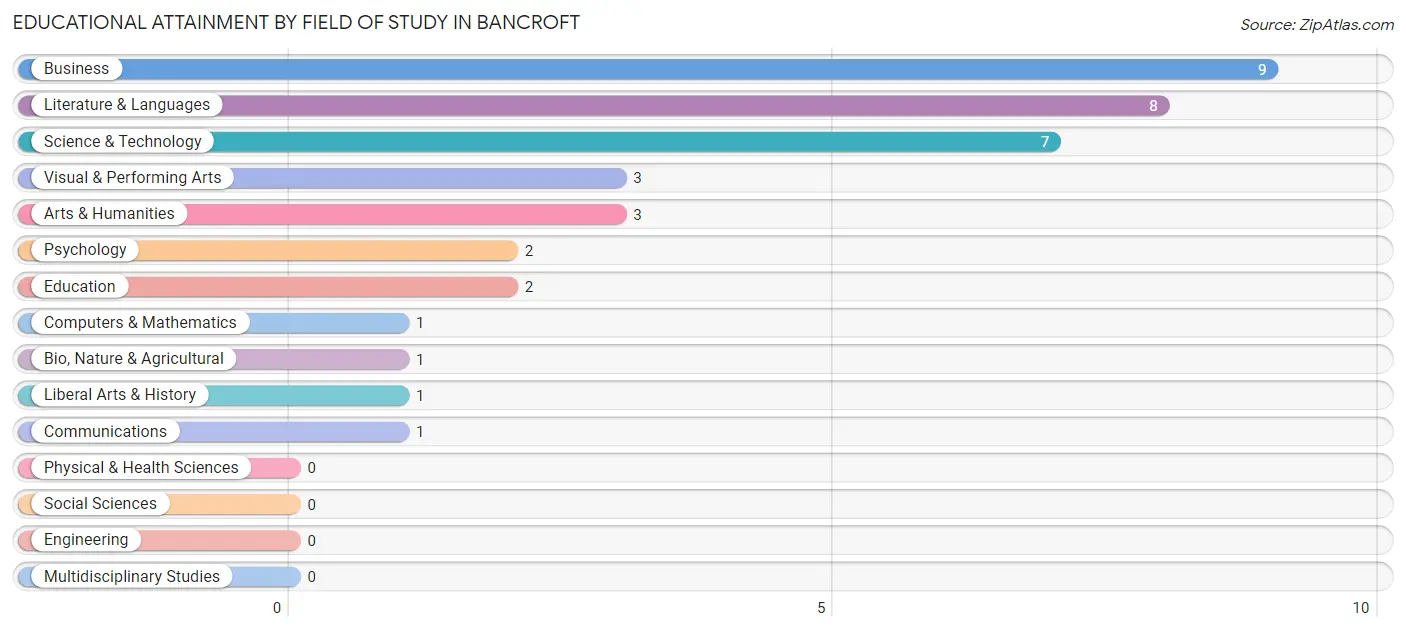
| Field of Study | # Graduates | % Graduates |
| Computers & Mathematics | 1 | 2.6% |
| Bio, Nature & Agricultural | 1 | 2.6% |
| Physical & Health Sciences | 0 | 0.0% |
| Psychology | 2 | 5.3% |
| Social Sciences | 0 | 0.0% |
| Engineering | 0 | 0.0% |
| Multidisciplinary Studies | 0 | 0.0% |
| Science & Technology | 7 | 18.4% |
| Business | 9 | 23.7% |
| Education | 2 | 5.3% |
| Literature & Languages | 8 | 21.0% |
| Liberal Arts & History | 1 | 2.6% |
| Visual & Performing Arts | 3 | 7.9% |
| Communications | 1 | 2.6% |
| Arts & Humanities | 3 | 7.9% |
| Total | 38 | 100.0% |
Transportation & Commute in Bancroft
Vehicle Availability by Sex in Bancroft
The most prevalent vehicle ownership categories in Bancroft are males with 3 vehicles (46, accounting for 40.7%) and females with 3 vehicles (19, making up 34.6%).
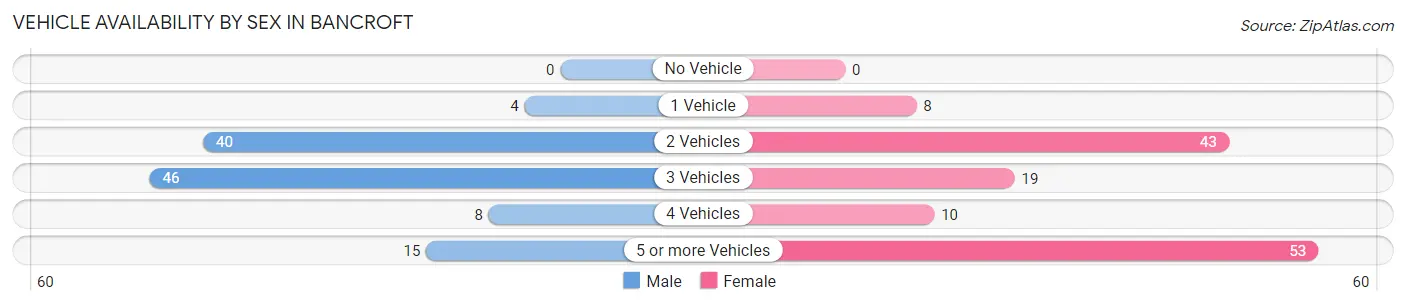
| Vehicles Available | Male | Female |
| No Vehicle | 0 (0.0%) | 0 (0.0%) |
| 1 Vehicle | 4 (3.5%) | 8 (6.0%) |
| 2 Vehicles | 40 (35.4%) | 43 (32.3%) |
| 3 Vehicles | 46 (40.7%) | 19 (14.3%) |
| 4 Vehicles | 8 (7.1%) | 10 (7.5%) |
| 5 or more Vehicles | 15 (13.3%) | 53 (39.9%) |
| Total | 113 (100.0%) | 133 (100.0%) |
Commute Time in Bancroft
The most frequently occuring commute durations in Bancroft are 15 to 19 minutes (52 commuters, 21.8%), 45 to 59 minutes (50 commuters, 21.0%), and 20 to 24 minutes (22 commuters, 9.2%).
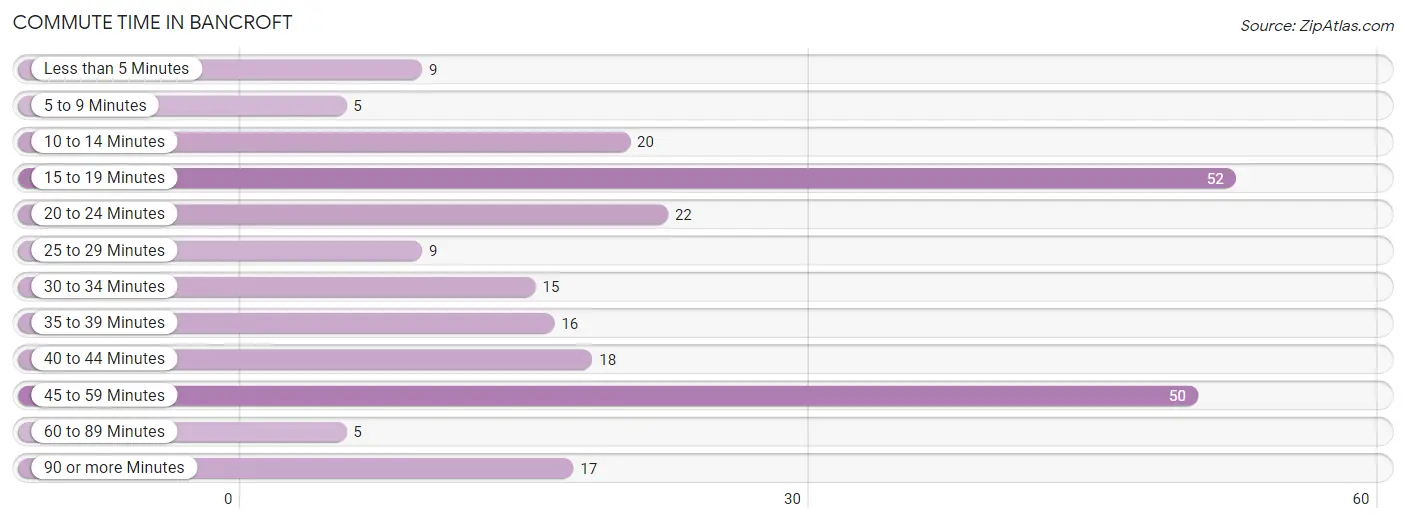
| Commute Time | # Commuters | % Commuters |
| Less than 5 Minutes | 9 | 3.8% |
| 5 to 9 Minutes | 5 | 2.1% |
| 10 to 14 Minutes | 20 | 8.4% |
| 15 to 19 Minutes | 52 | 21.8% |
| 20 to 24 Minutes | 22 | 9.2% |
| 25 to 29 Minutes | 9 | 3.8% |
| 30 to 34 Minutes | 15 | 6.3% |
| 35 to 39 Minutes | 16 | 6.7% |
| 40 to 44 Minutes | 18 | 7.6% |
| 45 to 59 Minutes | 50 | 21.0% |
| 60 to 89 Minutes | 5 | 2.1% |
| 90 or more Minutes | 17 | 7.1% |
Commute Time by Sex in Bancroft
The most common commute times in Bancroft are 45 to 59 minutes (26 commuters, 23.0%) for males and 15 to 19 minutes (38 commuters, 30.4%) for females.
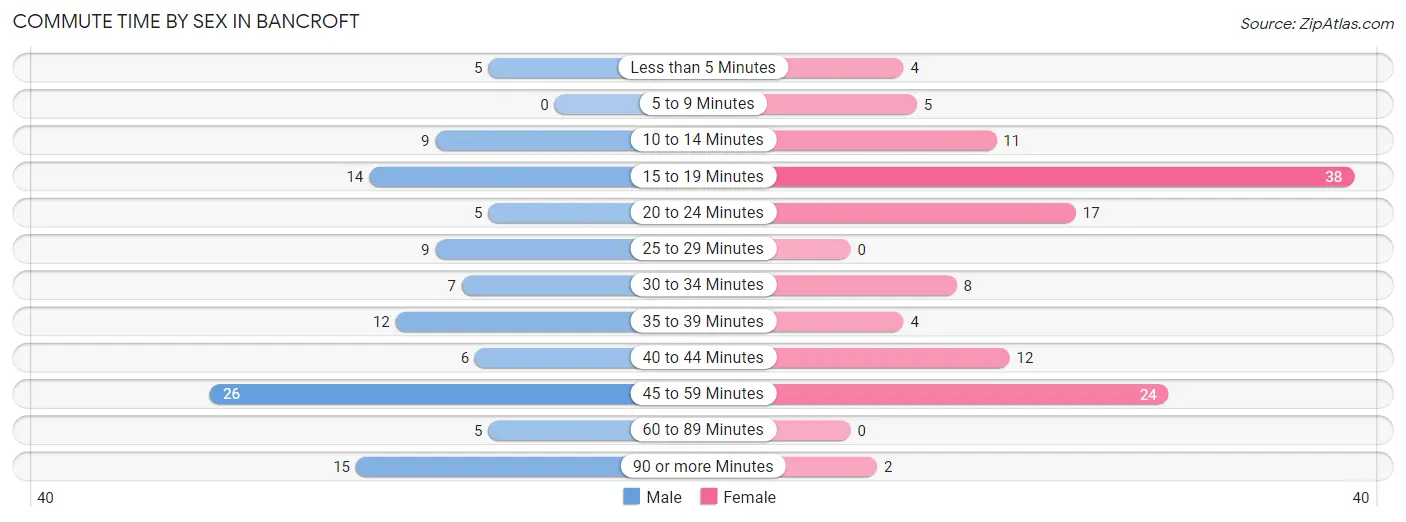
| Commute Time | Male | Female |
| Less than 5 Minutes | 5 (4.4%) | 4 (3.2%) |
| 5 to 9 Minutes | 0 (0.0%) | 5 (4.0%) |
| 10 to 14 Minutes | 9 (8.0%) | 11 (8.8%) |
| 15 to 19 Minutes | 14 (12.4%) | 38 (30.4%) |
| 20 to 24 Minutes | 5 (4.4%) | 17 (13.6%) |
| 25 to 29 Minutes | 9 (8.0%) | 0 (0.0%) |
| 30 to 34 Minutes | 7 (6.2%) | 8 (6.4%) |
| 35 to 39 Minutes | 12 (10.6%) | 4 (3.2%) |
| 40 to 44 Minutes | 6 (5.3%) | 12 (9.6%) |
| 45 to 59 Minutes | 26 (23.0%) | 24 (19.2%) |
| 60 to 89 Minutes | 5 (4.4%) | 0 (0.0%) |
| 90 or more Minutes | 15 (13.3%) | 2 (1.6%) |
Time of Departure to Work by Sex in Bancroft
The most frequent times of departure to work in Bancroft are 6:30 AM to 6:59 AM (27, 23.9%) for males and 7:30 AM to 7:59 AM (42, 33.6%) for females.
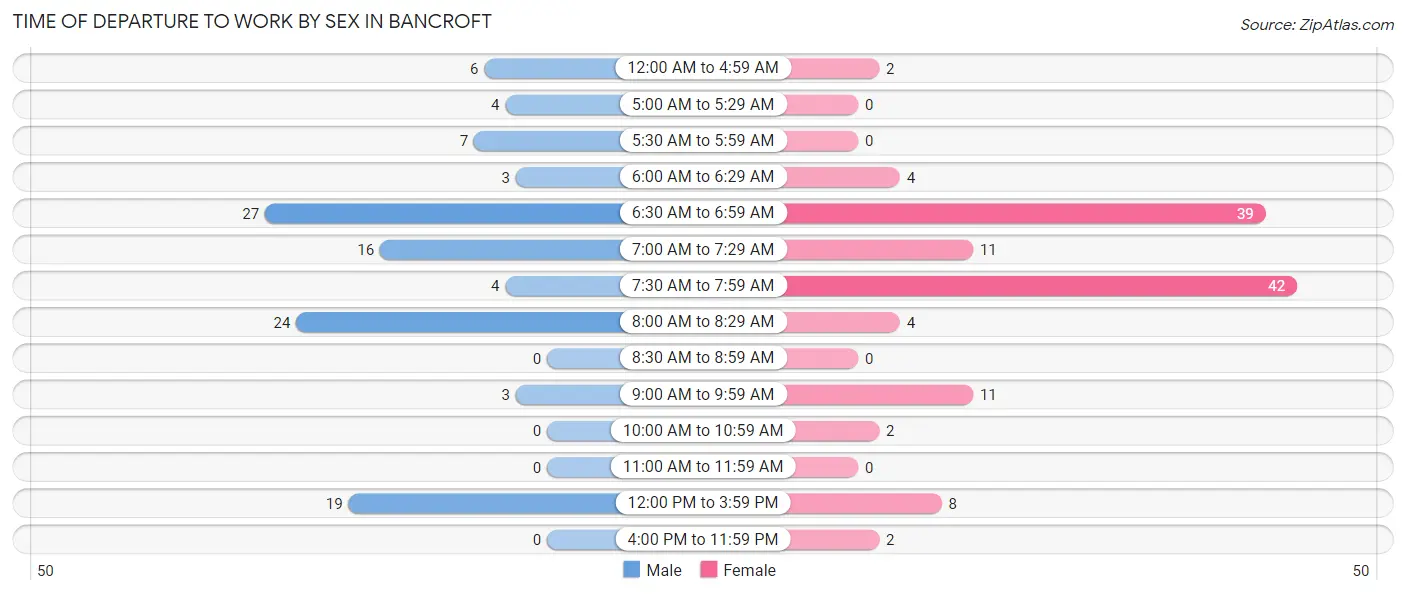
| Time of Departure | Male | Female |
| 12:00 AM to 4:59 AM | 6 (5.3%) | 2 (1.6%) |
| 5:00 AM to 5:29 AM | 4 (3.5%) | 0 (0.0%) |
| 5:30 AM to 5:59 AM | 7 (6.2%) | 0 (0.0%) |
| 6:00 AM to 6:29 AM | 3 (2.6%) | 4 (3.2%) |
| 6:30 AM to 6:59 AM | 27 (23.9%) | 39 (31.2%) |
| 7:00 AM to 7:29 AM | 16 (14.2%) | 11 (8.8%) |
| 7:30 AM to 7:59 AM | 4 (3.5%) | 42 (33.6%) |
| 8:00 AM to 8:29 AM | 24 (21.2%) | 4 (3.2%) |
| 8:30 AM to 8:59 AM | 0 (0.0%) | 0 (0.0%) |
| 9:00 AM to 9:59 AM | 3 (2.6%) | 11 (8.8%) |
| 10:00 AM to 10:59 AM | 0 (0.0%) | 2 (1.6%) |
| 11:00 AM to 11:59 AM | 0 (0.0%) | 0 (0.0%) |
| 12:00 PM to 3:59 PM | 19 (16.8%) | 8 (6.4%) |
| 4:00 PM to 11:59 PM | 0 (0.0%) | 2 (1.6%) |
| Total | 113 (100.0%) | 125 (100.0%) |
Housing Occupancy in Bancroft
Occupancy by Ownership in Bancroft
Of the total 181 dwellings in Bancroft, owner-occupied units account for 128 (70.7%), while renter-occupied units make up 53 (29.3%).
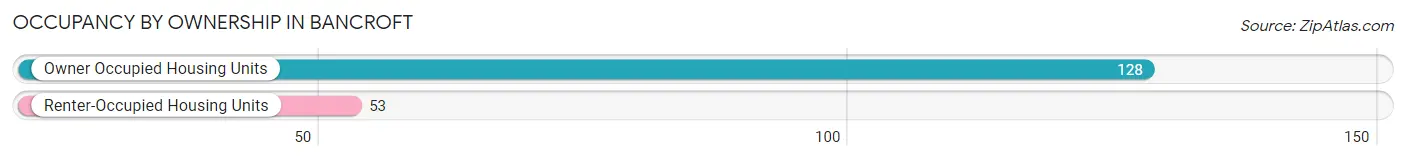
| Occupancy | # Housing Units | % Housing Units |
| Owner Occupied Housing Units | 128 | 70.7% |
| Renter-Occupied Housing Units | 53 | 29.3% |
| Total Occupied Housing Units | 181 | 100.0% |
Occupancy by Household Size in Bancroft
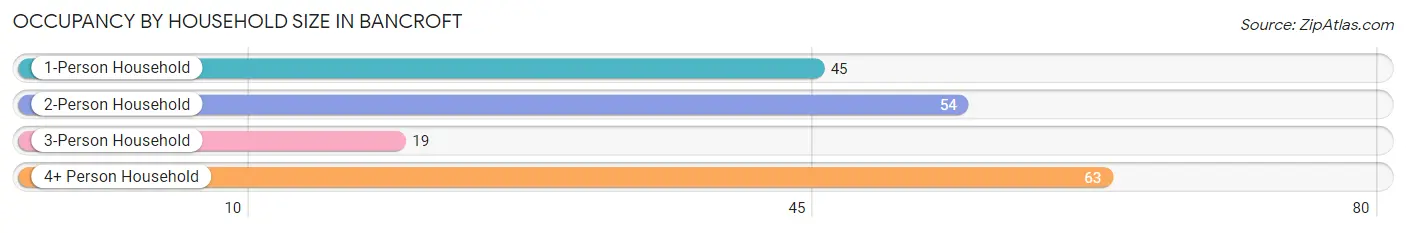
| Household Size | # Housing Units | % Housing Units |
| 1-Person Household | 45 | 24.9% |
| 2-Person Household | 54 | 29.8% |
| 3-Person Household | 19 | 10.5% |
| 4+ Person Household | 63 | 34.8% |
| Total Housing Units | 181 | 100.0% |
Occupancy by Ownership by Household Size in Bancroft
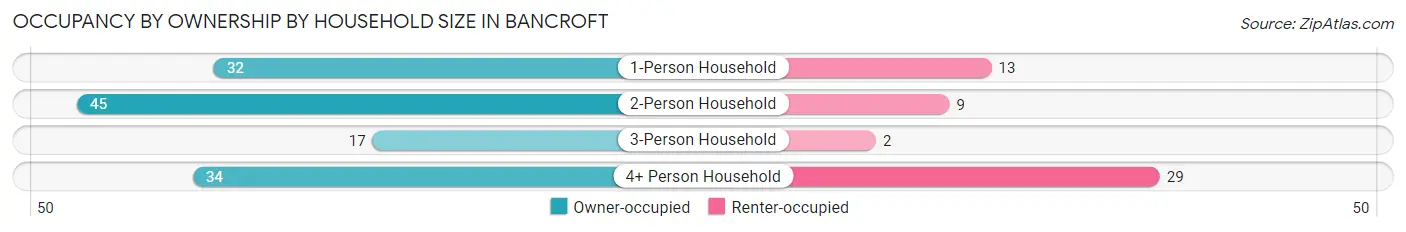
| Household Size | Owner-occupied | Renter-occupied |
| 1-Person Household | 32 (71.1%) | 13 (28.9%) |
| 2-Person Household | 45 (83.3%) | 9 (16.7%) |
| 3-Person Household | 17 (89.5%) | 2 (10.5%) |
| 4+ Person Household | 34 (54.0%) | 29 (46.0%) |
| Total Housing Units | 128 (70.7%) | 53 (29.3%) |
Occupancy by Educational Attainment in Bancroft
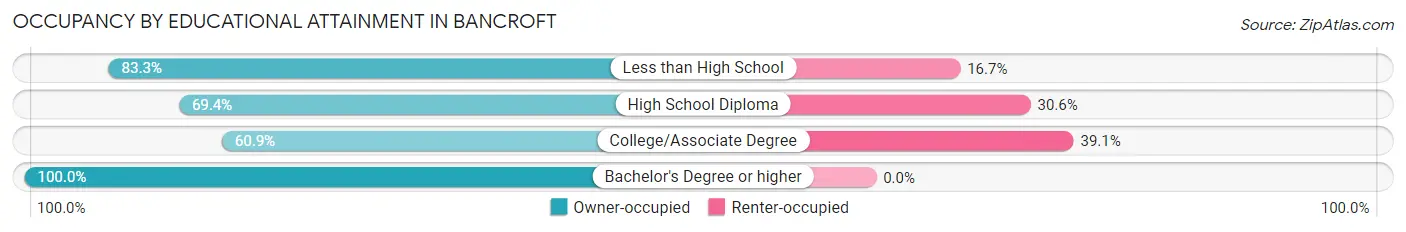
| Household Size | Owner-occupied | Renter-occupied |
| Less than High School | 10 (83.3%) | 2 (16.7%) |
| High School Diploma | 34 (69.4%) | 15 (30.6%) |
| College/Associate Degree | 56 (60.9%) | 36 (39.1%) |
| Bachelor's Degree or higher | 28 (100.0%) | 0 (0.0%) |
Occupancy by Age of Householder in Bancroft
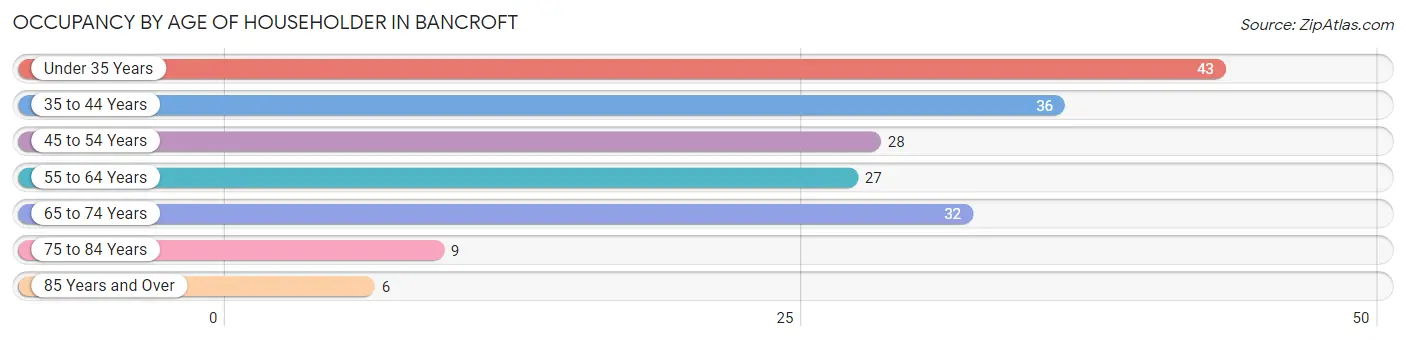
| Age Bracket | # Households | % Households |
| Under 35 Years | 43 | 23.8% |
| 35 to 44 Years | 36 | 19.9% |
| 45 to 54 Years | 28 | 15.5% |
| 55 to 64 Years | 27 | 14.9% |
| 65 to 74 Years | 32 | 17.7% |
| 75 to 84 Years | 9 | 5.0% |
| 85 Years and Over | 6 | 3.3% |
| Total | 181 | 100.0% |
Housing Finances in Bancroft
Median Income by Occupancy in Bancroft
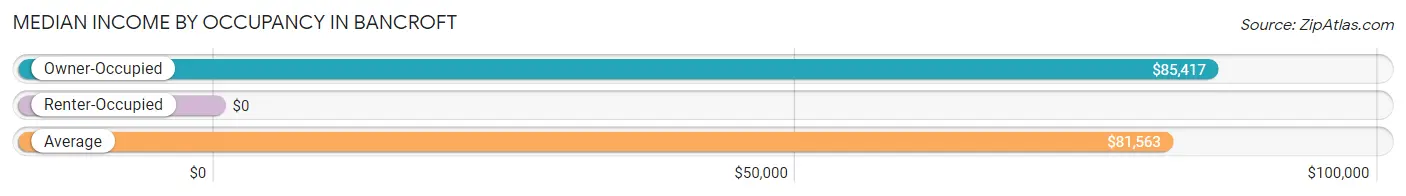
| Occupancy Type | # Households | Median Income |
| Owner-Occupied | 128 (70.7%) | $85,417 |
| Renter-Occupied | 53 (29.3%) | $0 |
| Average | 181 (100.0%) | $81,563 |
Occupancy by Householder Income Bracket in Bancroft
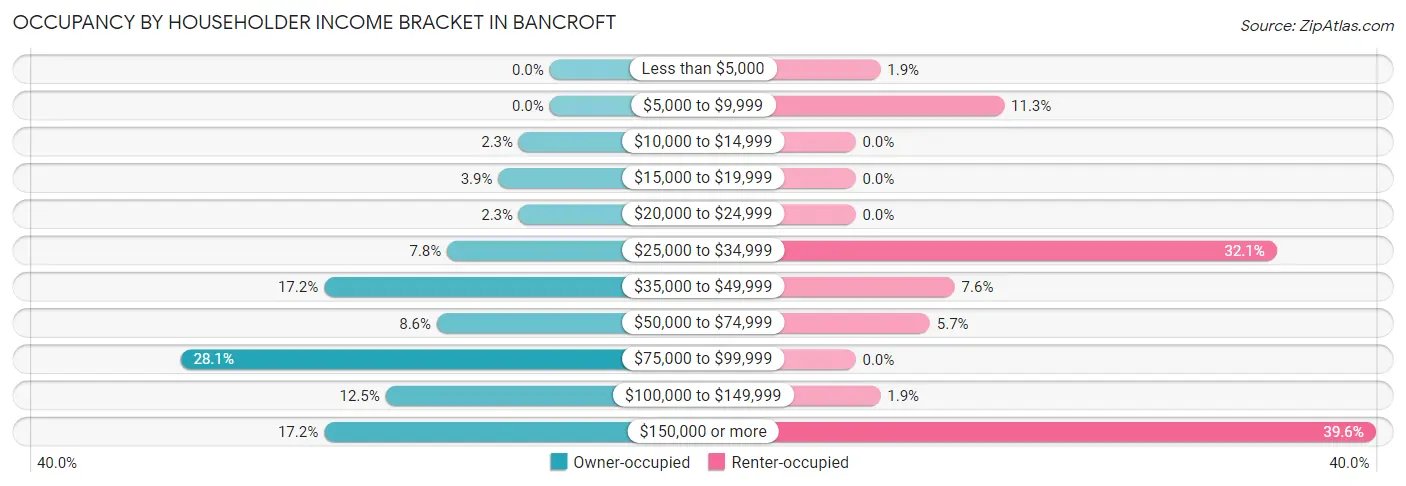
| Income Bracket | Owner-occupied | Renter-occupied |
| Less than $5,000 | 0 (0.0%) | 1 (1.9%) |
| $5,000 to $9,999 | 0 (0.0%) | 6 (11.3%) |
| $10,000 to $14,999 | 3 (2.3%) | 0 (0.0%) |
| $15,000 to $19,999 | 5 (3.9%) | 0 (0.0%) |
| $20,000 to $24,999 | 3 (2.3%) | 0 (0.0%) |
| $25,000 to $34,999 | 10 (7.8%) | 17 (32.1%) |
| $35,000 to $49,999 | 22 (17.2%) | 4 (7.5%) |
| $50,000 to $74,999 | 11 (8.6%) | 3 (5.7%) |
| $75,000 to $99,999 | 36 (28.1%) | 0 (0.0%) |
| $100,000 to $149,999 | 16 (12.5%) | 1 (1.9%) |
| $150,000 or more | 22 (17.2%) | 21 (39.6%) |
| Total | 128 (100.0%) | 53 (100.0%) |
Monthly Housing Cost Tiers in Bancroft
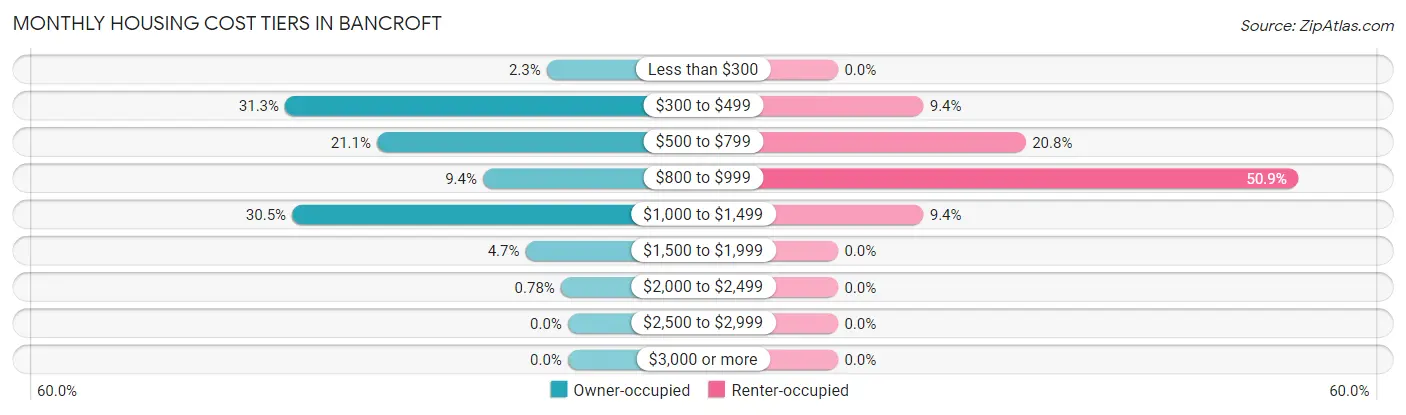
| Monthly Cost | Owner-occupied | Renter-occupied |
| Less than $300 | 3 (2.3%) | 0 (0.0%) |
| $300 to $499 | 40 (31.2%) | 5 (9.4%) |
| $500 to $799 | 27 (21.1%) | 11 (20.7%) |
| $800 to $999 | 12 (9.4%) | 27 (50.9%) |
| $1,000 to $1,499 | 39 (30.5%) | 5 (9.4%) |
| $1,500 to $1,999 | 6 (4.7%) | 0 (0.0%) |
| $2,000 to $2,499 | 1 (0.8%) | 0 (0.0%) |
| $2,500 to $2,999 | 0 (0.0%) | 0 (0.0%) |
| $3,000 or more | 0 (0.0%) | 0 (0.0%) |
| Total | 128 (100.0%) | 53 (100.0%) |
Physical Housing Characteristics in Bancroft
Housing Structures in Bancroft
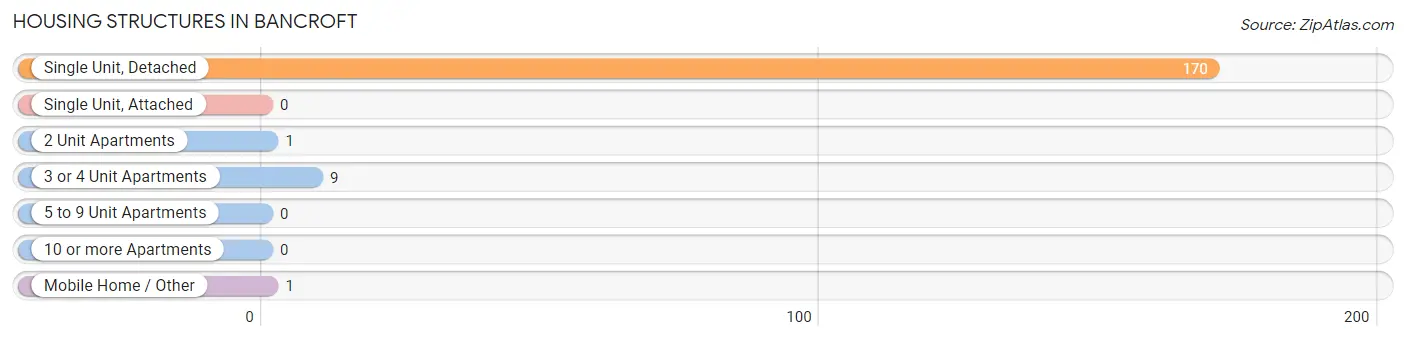
| Structure Type | # Housing Units | % Housing Units |
| Single Unit, Detached | 170 | 93.9% |
| Single Unit, Attached | 0 | 0.0% |
| 2 Unit Apartments | 1 | 0.5% |
| 3 or 4 Unit Apartments | 9 | 5.0% |
| 5 to 9 Unit Apartments | 0 | 0.0% |
| 10 or more Apartments | 0 | 0.0% |
| Mobile Home / Other | 1 | 0.5% |
| Total | 181 | 100.0% |
Housing Structures by Occupancy in Bancroft
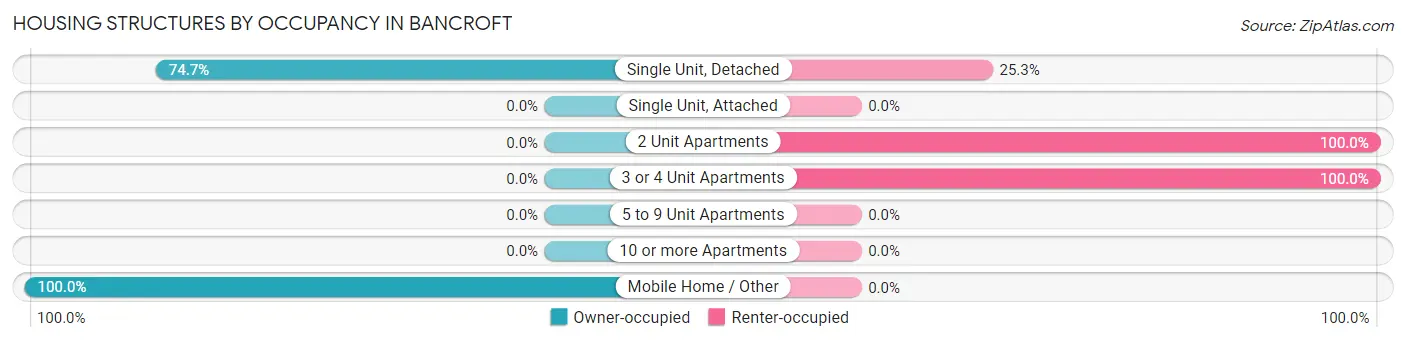
| Structure Type | Owner-occupied | Renter-occupied |
| Single Unit, Detached | 127 (74.7%) | 43 (25.3%) |
| Single Unit, Attached | 0 (0.0%) | 0 (0.0%) |
| 2 Unit Apartments | 0 (0.0%) | 1 (100.0%) |
| 3 or 4 Unit Apartments | 0 (0.0%) | 9 (100.0%) |
| 5 to 9 Unit Apartments | 0 (0.0%) | 0 (0.0%) |
| 10 or more Apartments | 0 (0.0%) | 0 (0.0%) |
| Mobile Home / Other | 1 (100.0%) | 0 (0.0%) |
| Total | 128 (70.7%) | 53 (29.3%) |
Housing Structures by Number of Rooms in Bancroft
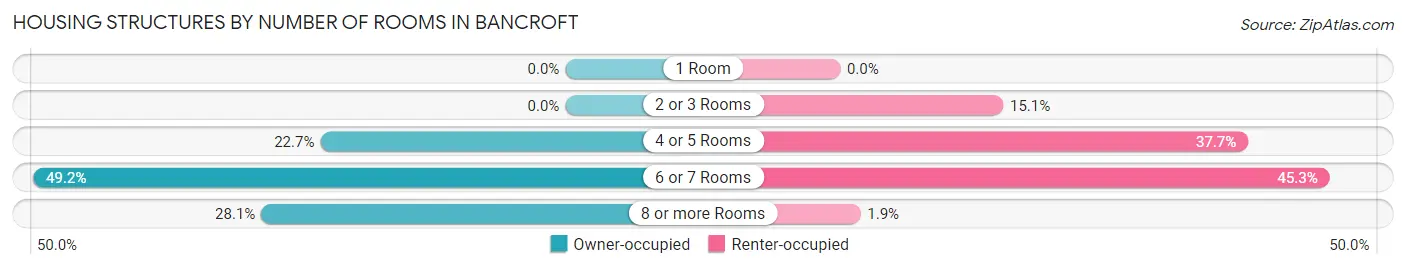
| Number of Rooms | Owner-occupied | Renter-occupied |
| 1 Room | 0 (0.0%) | 0 (0.0%) |
| 2 or 3 Rooms | 0 (0.0%) | 8 (15.1%) |
| 4 or 5 Rooms | 29 (22.7%) | 20 (37.7%) |
| 6 or 7 Rooms | 63 (49.2%) | 24 (45.3%) |
| 8 or more Rooms | 36 (28.1%) | 1 (1.9%) |
| Total | 128 (100.0%) | 53 (100.0%) |
Housing Structure by Heating Type in Bancroft
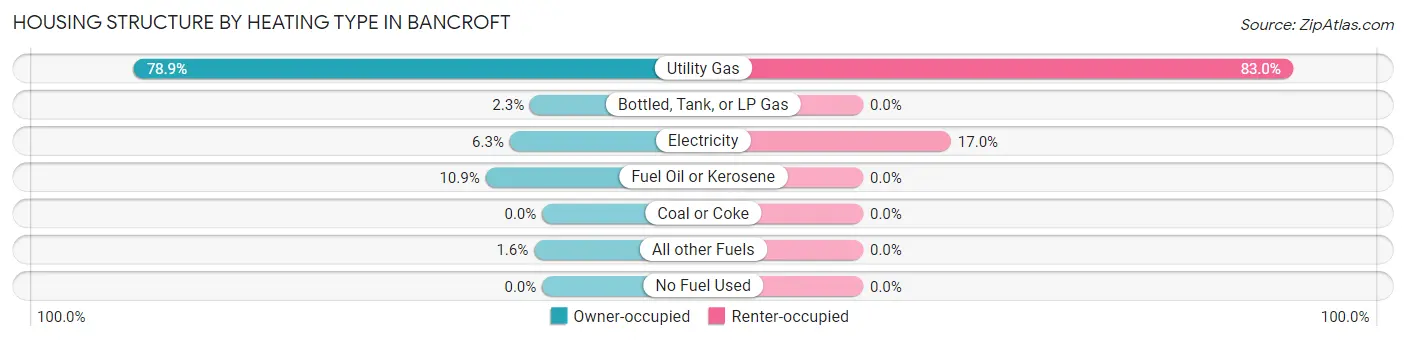
| Heating Type | Owner-occupied | Renter-occupied |
| Utility Gas | 101 (78.9%) | 44 (83.0%) |
| Bottled, Tank, or LP Gas | 3 (2.3%) | 0 (0.0%) |
| Electricity | 8 (6.2%) | 9 (17.0%) |
| Fuel Oil or Kerosene | 14 (10.9%) | 0 (0.0%) |
| Coal or Coke | 0 (0.0%) | 0 (0.0%) |
| All other Fuels | 2 (1.6%) | 0 (0.0%) |
| No Fuel Used | 0 (0.0%) | 0 (0.0%) |
| Total | 128 (100.0%) | 53 (100.0%) |
Household Vehicle Usage in Bancroft
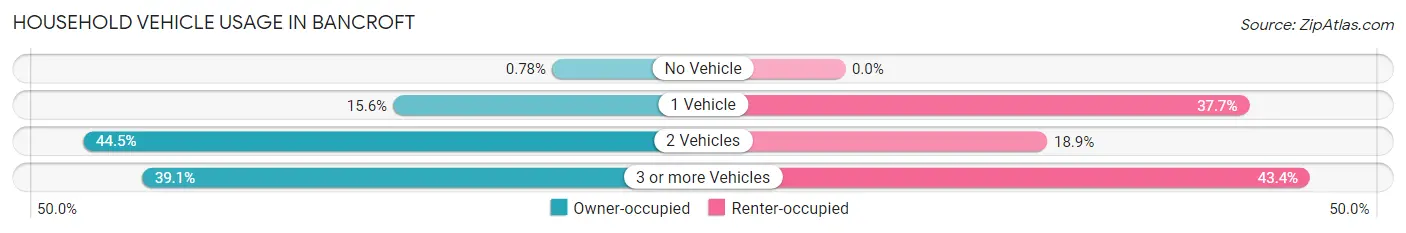
| Vehicles per Household | Owner-occupied | Renter-occupied |
| No Vehicle | 1 (0.8%) | 0 (0.0%) |
| 1 Vehicle | 20 (15.6%) | 20 (37.7%) |
| 2 Vehicles | 57 (44.5%) | 10 (18.9%) |
| 3 or more Vehicles | 50 (39.1%) | 23 (43.4%) |
| Total | 128 (100.0%) | 53 (100.0%) |
Real Estate & Mortgages in Bancroft
Real Estate and Mortgage Overview in Bancroft
| Characteristic | Without Mortgage | With Mortgage |
| Housing Units | 57 | 71 |
| Median Property Value | $140,600 | $111,300 |
| Median Household Income | $89,375 | $8 |
| Monthly Housing Costs | $410 | $0 |
| Real Estate Taxes | $1,518 | $9 |
Property Value by Mortgage Status in Bancroft
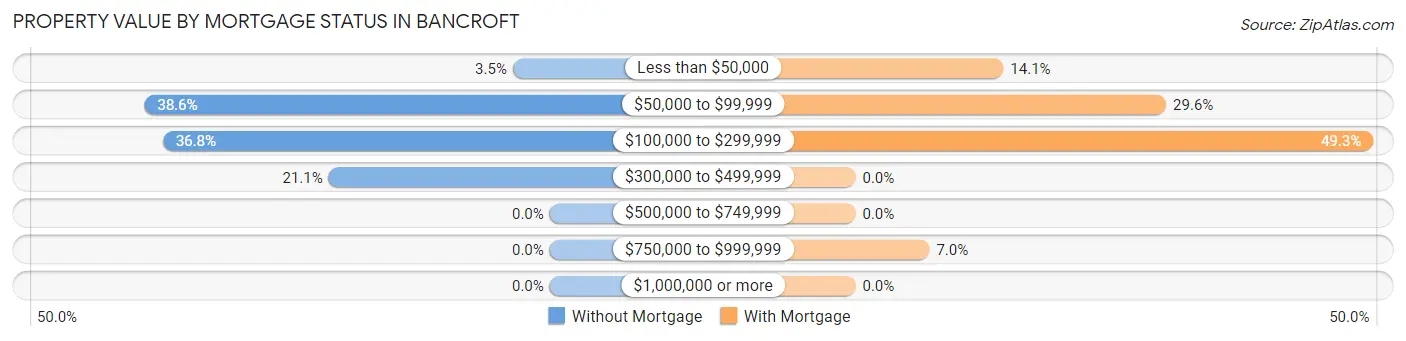
| Property Value | Without Mortgage | With Mortgage |
| Less than $50,000 | 2 (3.5%) | 10 (14.1%) |
| $50,000 to $99,999 | 22 (38.6%) | 21 (29.6%) |
| $100,000 to $299,999 | 21 (36.8%) | 35 (49.3%) |
| $300,000 to $499,999 | 12 (21.0%) | 0 (0.0%) |
| $500,000 to $749,999 | 0 (0.0%) | 0 (0.0%) |
| $750,000 to $999,999 | 0 (0.0%) | 5 (7.0%) |
| $1,000,000 or more | 0 (0.0%) | 0 (0.0%) |
| Total | 57 (100.0%) | 71 (100.0%) |
Household Income by Mortgage Status in Bancroft
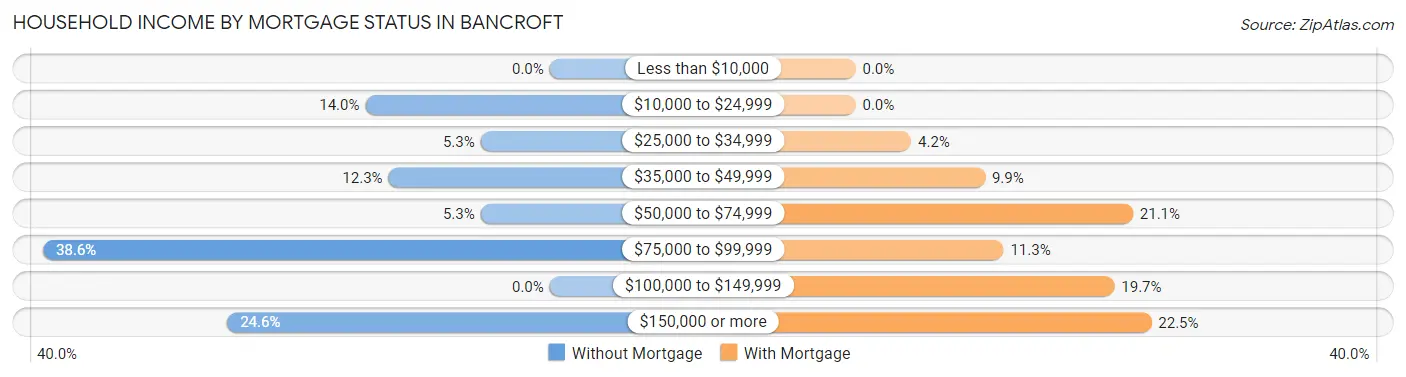
| Household Income | Without Mortgage | With Mortgage |
| Less than $10,000 | 0 (0.0%) | 0 (0.0%) |
| $10,000 to $24,999 | 8 (14.0%) | 0 (0.0%) |
| $25,000 to $34,999 | 3 (5.3%) | 3 (4.2%) |
| $35,000 to $49,999 | 7 (12.3%) | 7 (9.9%) |
| $50,000 to $74,999 | 3 (5.3%) | 15 (21.1%) |
| $75,000 to $99,999 | 22 (38.6%) | 8 (11.3%) |
| $100,000 to $149,999 | 0 (0.0%) | 14 (19.7%) |
| $150,000 or more | 14 (24.6%) | 16 (22.5%) |
| Total | 57 (100.0%) | 71 (100.0%) |
Property Value to Household Income Ratio in Bancroft
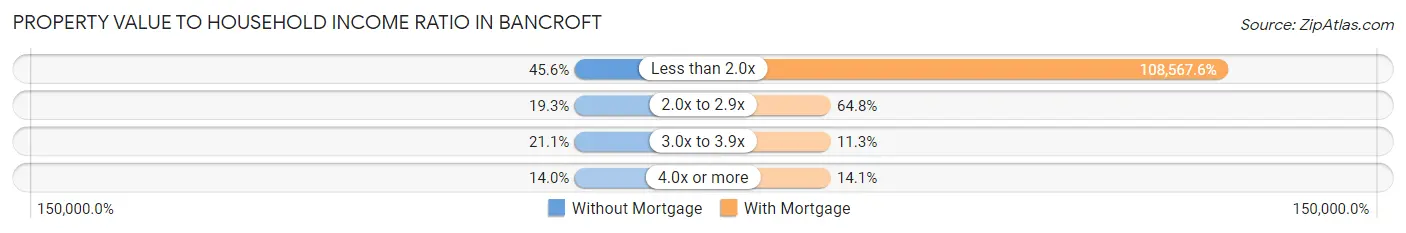
| Value-to-Income Ratio | Without Mortgage | With Mortgage |
| Less than 2.0x | 26 (45.6%) | 77,083 (108,567.6%) |
| 2.0x to 2.9x | 11 (19.3%) | 46 (64.8%) |
| 3.0x to 3.9x | 12 (21.0%) | 8 (11.3%) |
| 4.0x or more | 8 (14.0%) | 10 (14.1%) |
| Total | 57 (100.0%) | 71 (100.0%) |
Real Estate Taxes by Mortgage Status in Bancroft
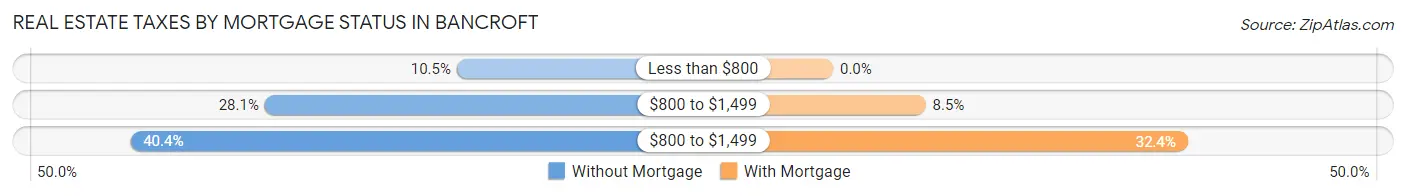
| Property Taxes | Without Mortgage | With Mortgage |
| Less than $800 | 6 (10.5%) | 0 (0.0%) |
| $800 to $1,499 | 16 (28.1%) | 6 (8.5%) |
| $800 to $1,499 | 23 (40.4%) | 23 (32.4%) |
| Total | 57 (100.0%) | 71 (100.0%) |
Health & Disability in Bancroft
Health Insurance Coverage by Age in Bancroft
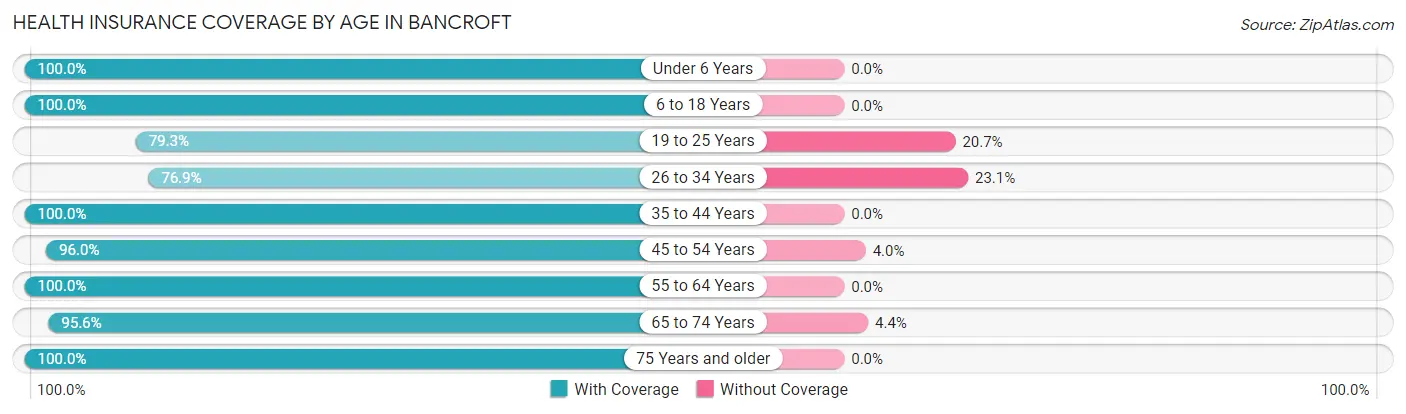
| Age Bracket | With Coverage | Without Coverage |
| Under 6 Years | 35 (100.0%) | 0 (0.0%) |
| 6 to 18 Years | 78 (100.0%) | 0 (0.0%) |
| 19 to 25 Years | 65 (79.3%) | 17 (20.7%) |
| 26 to 34 Years | 40 (76.9%) | 12 (23.1%) |
| 35 to 44 Years | 61 (100.0%) | 0 (0.0%) |
| 45 to 54 Years | 48 (96.0%) | 2 (4.0%) |
| 55 to 64 Years | 72 (100.0%) | 0 (0.0%) |
| 65 to 74 Years | 43 (95.6%) | 2 (4.4%) |
| 75 Years and older | 25 (100.0%) | 0 (0.0%) |
| Total | 467 (93.4%) | 33 (6.6%) |
Health Insurance Coverage by Citizenship Status in Bancroft
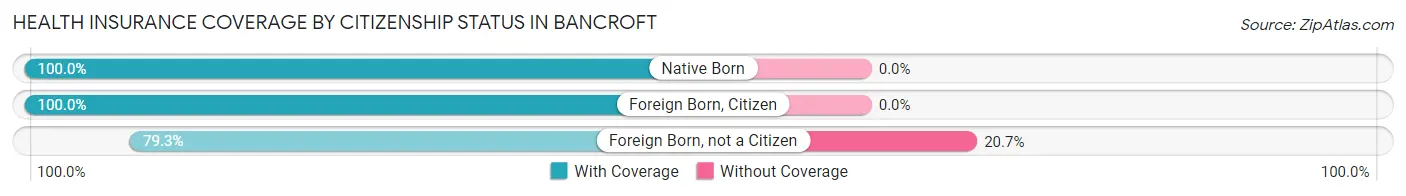
| Citizenship Status | With Coverage | Without Coverage |
| Native Born | 35 (100.0%) | 0 (0.0%) |
| Foreign Born, Citizen | 78 (100.0%) | 0 (0.0%) |
| Foreign Born, not a Citizen | 65 (79.3%) | 17 (20.7%) |
Health Insurance Coverage by Household Income in Bancroft
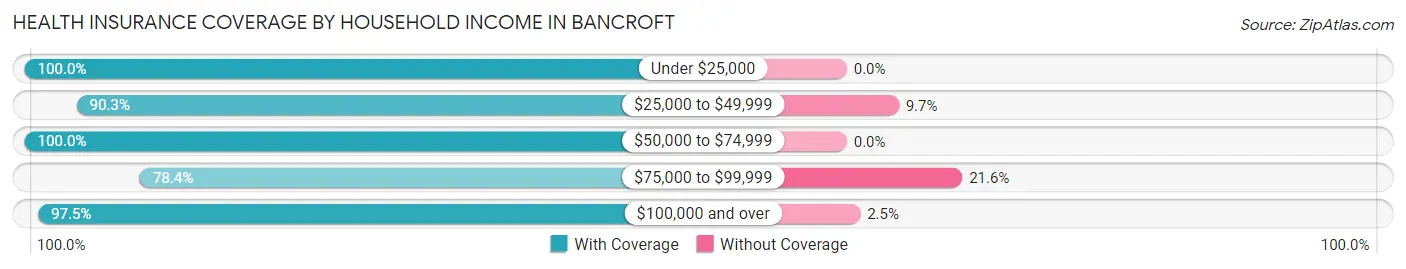
| Household Income | With Coverage | Without Coverage |
| Under $25,000 | 35 (100.0%) | 0 (0.0%) |
| $25,000 to $49,999 | 102 (90.3%) | 11 (9.7%) |
| $50,000 to $74,999 | 40 (100.0%) | 0 (0.0%) |
| $75,000 to $99,999 | 58 (78.4%) | 16 (21.6%) |
| $100,000 and over | 232 (97.5%) | 6 (2.5%) |
Public vs Private Health Insurance Coverage by Age in Bancroft
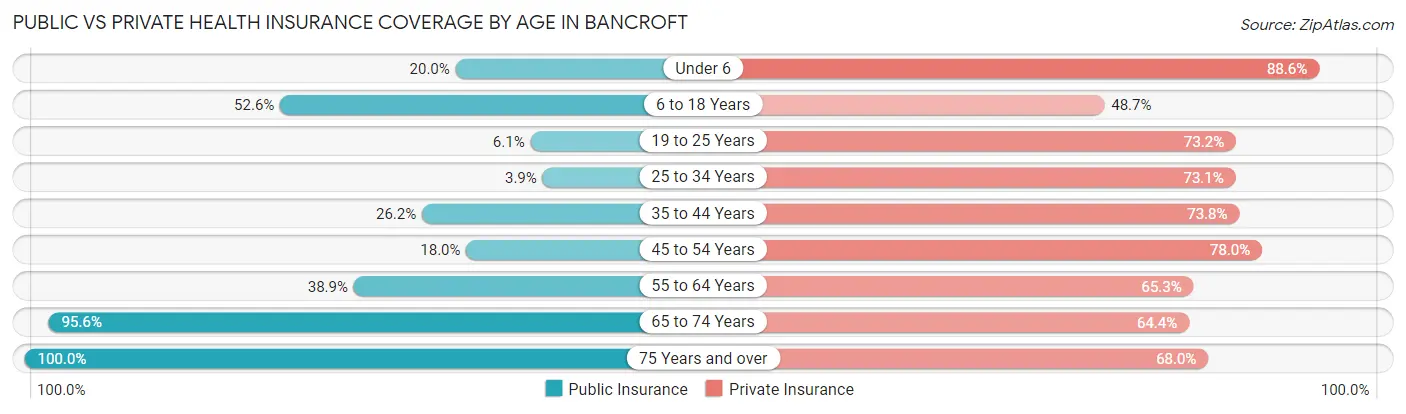
| Age Bracket | Public Insurance | Private Insurance |
| Under 6 | 7 (20.0%) | 31 (88.6%) |
| 6 to 18 Years | 41 (52.6%) | 38 (48.7%) |
| 19 to 25 Years | 5 (6.1%) | 60 (73.2%) |
| 25 to 34 Years | 2 (3.8%) | 38 (73.1%) |
| 35 to 44 Years | 16 (26.2%) | 45 (73.8%) |
| 45 to 54 Years | 9 (18.0%) | 39 (78.0%) |
| 55 to 64 Years | 28 (38.9%) | 47 (65.3%) |
| 65 to 74 Years | 43 (95.6%) | 29 (64.4%) |
| 75 Years and over | 25 (100.0%) | 17 (68.0%) |
| Total | 176 (35.2%) | 344 (68.8%) |
Disability Status by Sex by Age in Bancroft
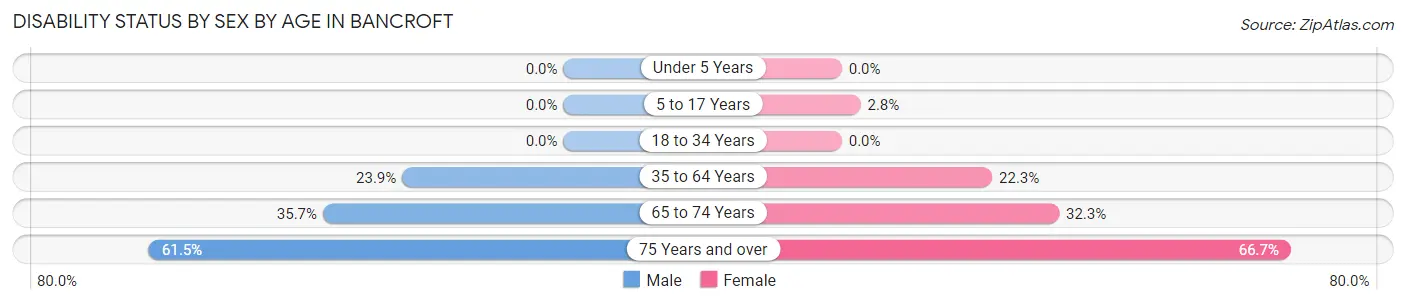
| Age Bracket | Male | Female |
| Under 5 Years | 0 (0.0%) | 0 (0.0%) |
| 5 to 17 Years | 0 (0.0%) | 1 (2.8%) |
| 18 to 34 Years | 0 (0.0%) | 0 (0.0%) |
| 35 to 64 Years | 17 (23.9%) | 25 (22.3%) |
| 65 to 74 Years | 5 (35.7%) | 10 (32.3%) |
| 75 Years and over | 8 (61.5%) | 8 (66.7%) |
Disability Class by Sex by Age in Bancroft
Disability Class: Hearing Difficulty
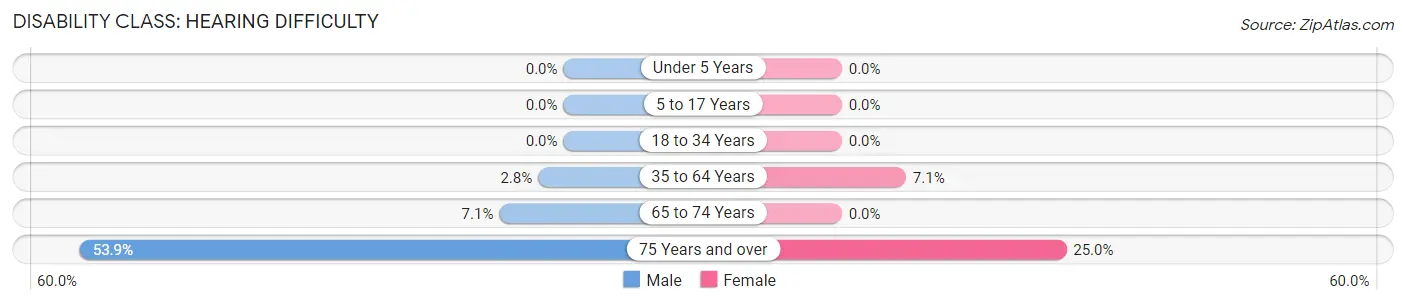
| Age Bracket | Male | Female |
| Under 5 Years | 0 (0.0%) | 0 (0.0%) |
| 5 to 17 Years | 0 (0.0%) | 0 (0.0%) |
| 18 to 34 Years | 0 (0.0%) | 0 (0.0%) |
| 35 to 64 Years | 2 (2.8%) | 8 (7.1%) |
| 65 to 74 Years | 1 (7.1%) | 0 (0.0%) |
| 75 Years and over | 7 (53.8%) | 3 (25.0%) |
Disability Class: Vision Difficulty
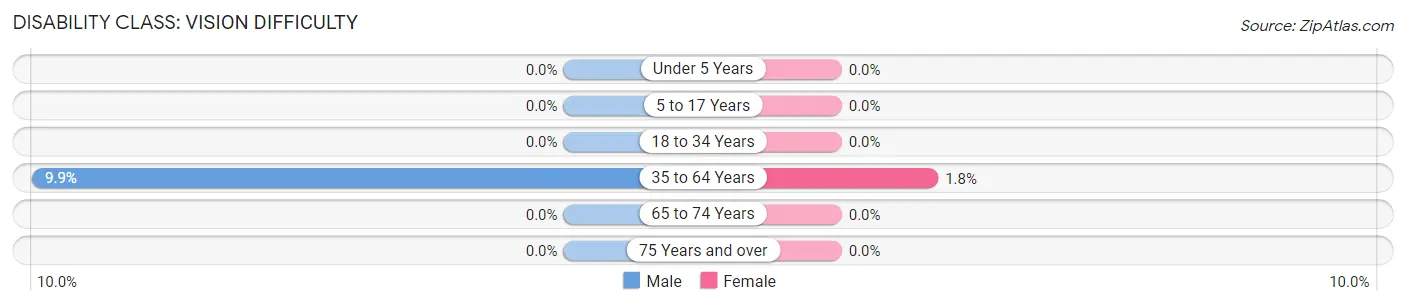
| Age Bracket | Male | Female |
| Under 5 Years | 0 (0.0%) | 0 (0.0%) |
| 5 to 17 Years | 0 (0.0%) | 0 (0.0%) |
| 18 to 34 Years | 0 (0.0%) | 0 (0.0%) |
| 35 to 64 Years | 7 (9.9%) | 2 (1.8%) |
| 65 to 74 Years | 0 (0.0%) | 0 (0.0%) |
| 75 Years and over | 0 (0.0%) | 0 (0.0%) |
Disability Class: Cognitive Difficulty
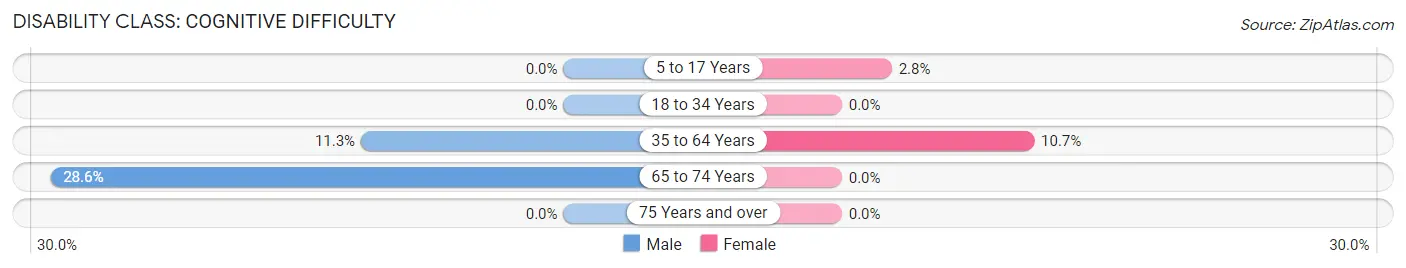
| Age Bracket | Male | Female |
| 5 to 17 Years | 0 (0.0%) | 1 (2.8%) |
| 18 to 34 Years | 0 (0.0%) | 0 (0.0%) |
| 35 to 64 Years | 8 (11.3%) | 12 (10.7%) |
| 65 to 74 Years | 4 (28.6%) | 0 (0.0%) |
| 75 Years and over | 0 (0.0%) | 0 (0.0%) |
Disability Class: Ambulatory Difficulty
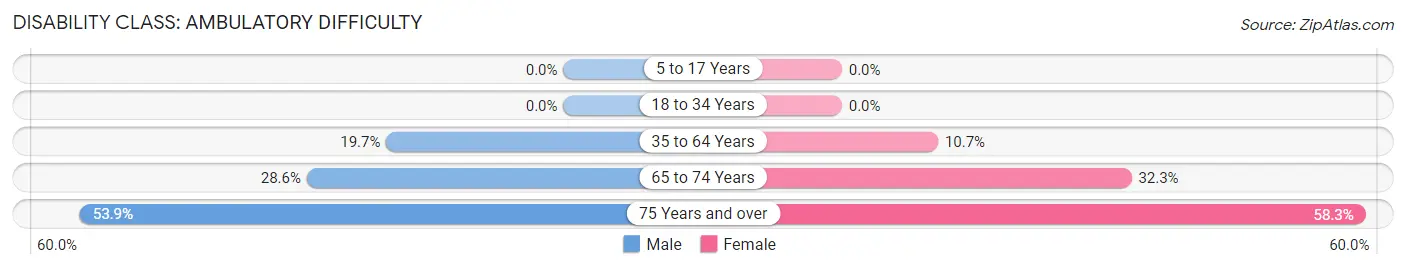
| Age Bracket | Male | Female |
| 5 to 17 Years | 0 (0.0%) | 0 (0.0%) |
| 18 to 34 Years | 0 (0.0%) | 0 (0.0%) |
| 35 to 64 Years | 14 (19.7%) | 12 (10.7%) |
| 65 to 74 Years | 4 (28.6%) | 10 (32.3%) |
| 75 Years and over | 7 (53.8%) | 7 (58.3%) |
Disability Class: Self-Care Difficulty
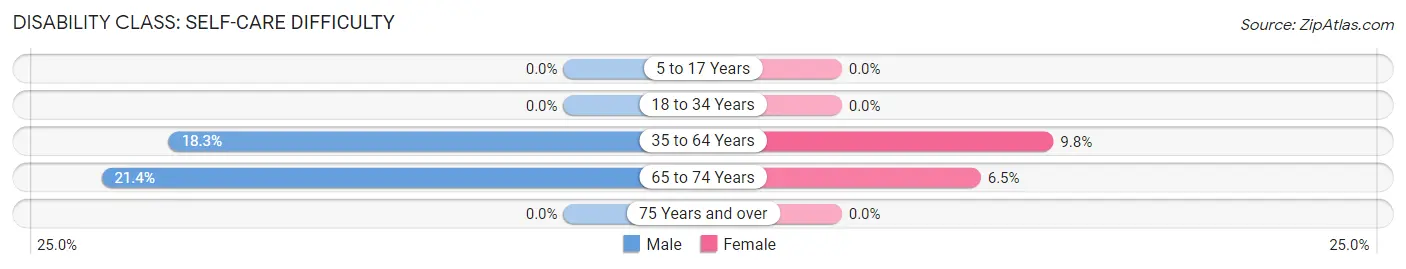
| Age Bracket | Male | Female |
| 5 to 17 Years | 0 (0.0%) | 0 (0.0%) |
| 18 to 34 Years | 0 (0.0%) | 0 (0.0%) |
| 35 to 64 Years | 13 (18.3%) | 11 (9.8%) |
| 65 to 74 Years | 3 (21.4%) | 2 (6.5%) |
| 75 Years and over | 0 (0.0%) | 0 (0.0%) |
Technology Access in Bancroft
Computing Device Access in Bancroft
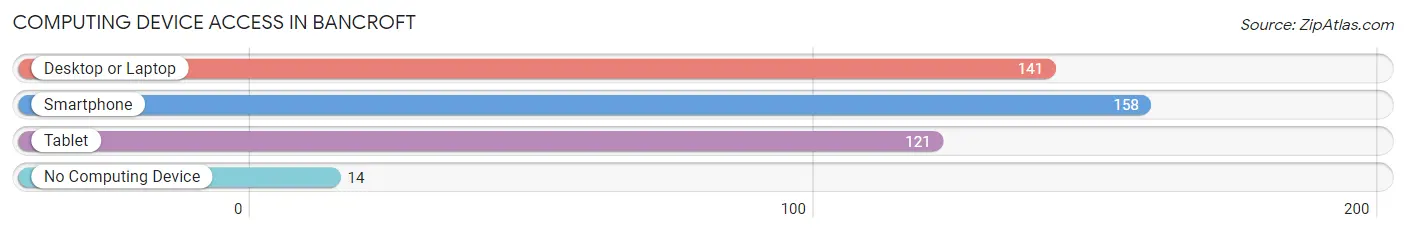
| Device Type | # Households | % Households |
| Desktop or Laptop | 141 | 77.9% |
| Smartphone | 158 | 87.3% |
| Tablet | 121 | 66.8% |
| No Computing Device | 14 | 7.7% |
| Total | 181 | 100.0% |
Internet Access in Bancroft
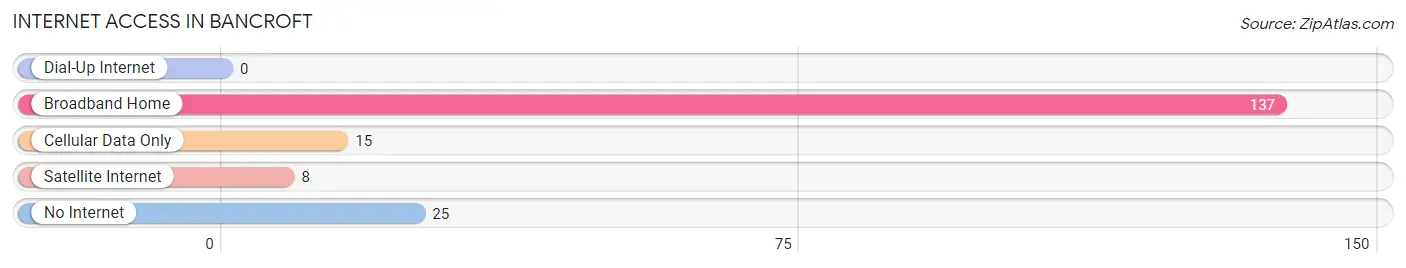
| Internet Type | # Households | % Households |
| Dial-Up Internet | 0 | 0.0% |
| Broadband Home | 137 | 75.7% |
| Cellular Data Only | 15 | 8.3% |
| Satellite Internet | 8 | 4.4% |
| No Internet | 25 | 13.8% |
| Total | 181 | 100.0% |
Bancroft Summary
Bancroft is a small unincorporated community located in the northern part of Michigan’s Lower Peninsula. It is situated in the northeast corner of Alcona County, approximately 20 miles south of Alpena and 40 miles north of Oscoda. The community is surrounded by a mix of rural farmland and wooded areas, and is home to a population of just over 500 people.
History
The area that is now Bancroft was first settled in the late 1800s by a group of German immigrants. The town was originally known as “Bancroft Station”, named after the nearby railroad station. The town was officially incorporated in 1891, and the name was changed to Bancroft.
In the early 1900s, Bancroft was a thriving community with a variety of businesses, including a general store, a blacksmith shop, a sawmill, and a grist mill. The town also had a post office, a school, and a church.
In the 1920s, the town began to decline as the railroad station closed and the population began to move away. The town was eventually abandoned in the 1940s, and the buildings were left to decay.
In the late 1970s, the town was rediscovered by a group of local residents who began to restore the buildings and revive the town. Today, Bancroft is a small but vibrant community with a variety of businesses, including a restaurant, a grocery store, and a hardware store.
Geography
Bancroft is located in the northeast corner of Alcona County, approximately 20 miles south of Alpena and 40 miles north of Oscoda. The town is situated on the banks of the Thunder Bay River, which flows through the area.
The town is surrounded by a mix of rural farmland and wooded areas. The area is known for its abundance of wildlife, including deer, bear, and a variety of birds.
Economy
The economy of Bancroft is largely based on agriculture and tourism. The town is home to several farms, which produce a variety of crops, including corn, soybeans, and wheat.
The town is also a popular destination for tourists, who come to enjoy the area’s natural beauty and outdoor activities. The nearby Thunder Bay River is a popular spot for fishing, canoeing, and kayaking.
Demographics
As of the 2010 census, the population of Bancroft was 514. The town is predominantly white, with 94.3% of the population identifying as Caucasian. The median household income is $37,500, and the median age is 44.
Bancroft is a small but vibrant community with a rich history and a bright future. The town is home to a diverse population of people who are proud to call Bancroft home.
Common Questions
What is Per Capita Income in Bancroft?
Per Capita income in Bancroft is $35,613.
What is the Median Family Income in Bancroft?
Median Family Income in Bancroft is $90,625.
What is the Median Household income in Bancroft?
Median Household Income in Bancroft is $81,563.
What is Income or Wage Gap in Bancroft?
Income or Wage Gap in Bancroft is 59.7%.
Women in Bancroft earn 40.3 cents for every dollar earned by a man.
What is Inequality or Gini Index in Bancroft?
Inequality or Gini Index in Bancroft is 0.42.
What is the Total Population of Bancroft?
Total Population of Bancroft is 500.
What is the Total Male Population of Bancroft?
Total Male Population of Bancroft is 210.
What is the Total Female Population of Bancroft?
Total Female Population of Bancroft is 290.
What is the Ratio of Males per 100 Females in Bancroft?
There are 72.41 Males per 100 Females in Bancroft.
What is the Ratio of Females per 100 Males in Bancroft?
There are 138.10 Females per 100 Males in Bancroft.
What is the Median Population Age in Bancroft?
Median Population Age in Bancroft is 35.3 Years.
What is the Average Family Size in Bancroft
Average Family Size in Bancroft is 3.3 People.
What is the Average Household Size in Bancroft
Average Household Size in Bancroft is 2.8 People.
How Large is the Labor Force in Bancroft?
There are 257 People in the Labor Forcein in Bancroft.
What is the Percentage of People in the Labor Force in Bancroft?
64.3% of People are in the Labor Force in Bancroft.
What is the Unemployment Rate in Bancroft?
Unemployment Rate in Bancroft is 2.7%.