Cities with the Highest Percentage of Households with Income Above $200,000 in North Carolina
RELATED REPORTS & OPTIONS
Household Income | $200k+
North Carolina
Compare Cities
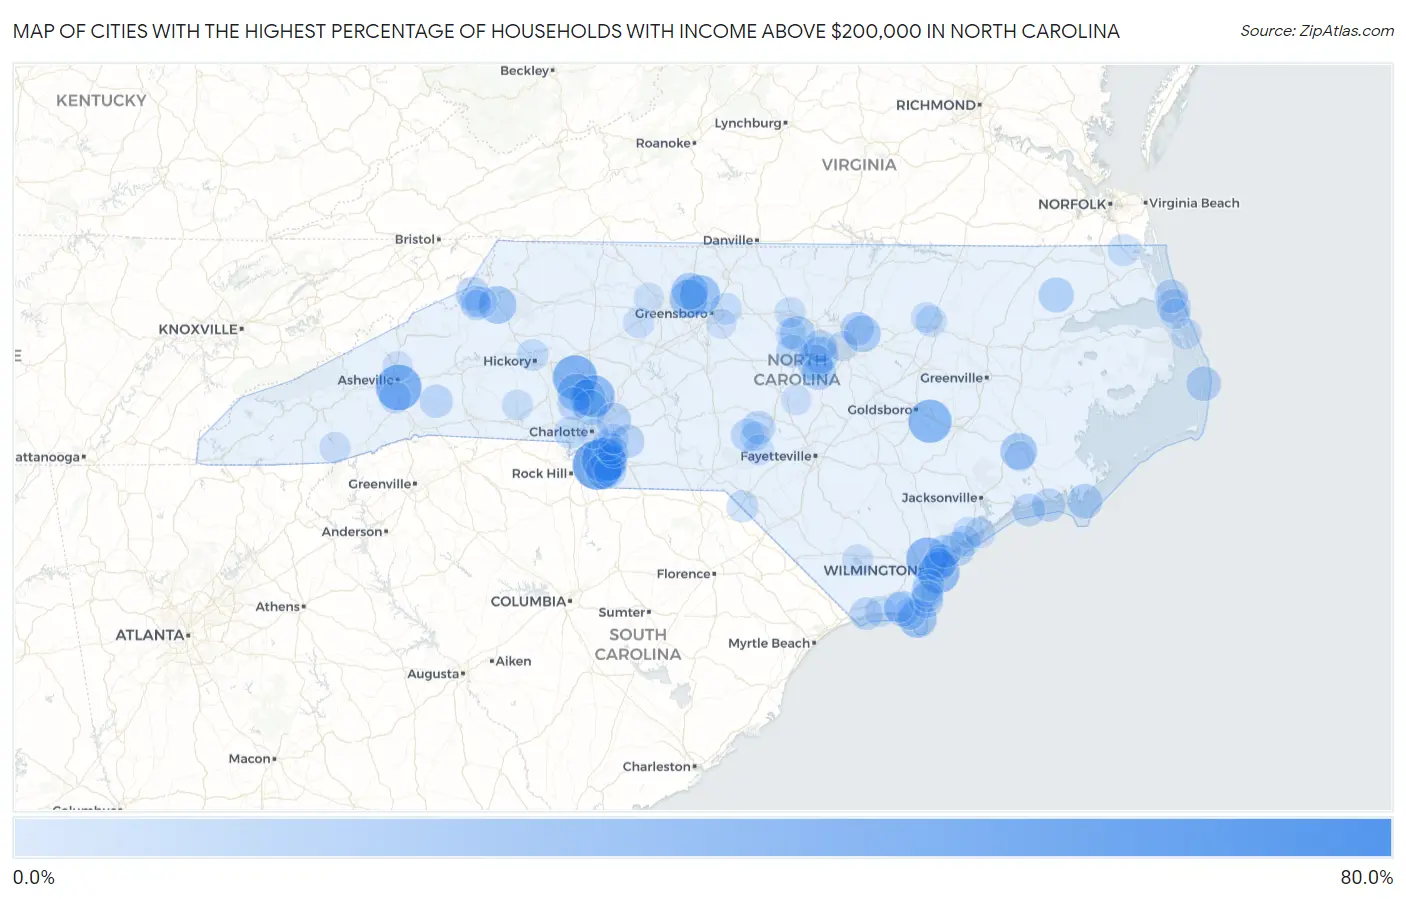
Map of Cities with the Highest Percentage of Households with Income Above $200,000 in North Carolina
0.0%
80.0%
Cities with the Highest Percentage of Households with Income Above $200,000 in North Carolina
| City | Households with Income > $200k | vs State | vs National | |
| 1. | Jackson Springs | 70.2% | 8.5%(+61.7)#1 | 11.4%(+58.8)#74 |
| 2. | Marvin | 55.1% | 8.5%(+46.6)#2 | 11.4%(+43.7)#287 |
| 3. | Grandfather | 54.2% | 8.5%(+45.7)#3 | 11.4%(+42.8)#328 |
| 4. | Governors Club | 53.1% | 8.5%(+44.6)#4 | 11.4%(+41.7)#359 |
| 5. | Crouse | 46.7% | 8.5%(+38.2)#5 | 11.4%(+35.3)#557 |
| 6. | Biltmore Forest | 46.3% | 8.5%(+37.8)#6 | 11.4%(+34.9)#568 |
| 7. | Weddington | 43.7% | 8.5%(+35.2)#7 | 11.4%(+32.3)#669 |
| 8. | Lake Norman Of Catawba | 43.7% | 8.5%(+35.2)#8 | 11.4%(+32.3)#670 |
| 9. | Walnut Creek | 41.1% | 8.5%(+32.6)#9 | 11.4%(+29.7)#777 |
| 10. | Blue Clay Farms | 39.6% | 8.5%(+31.1)#10 | 11.4%(+28.2)#866 |
| 11. | Davidson | 38.2% | 8.5%(+29.7)#11 | 11.4%(+26.8)#945 |
| 12. | Wrightsville Beach | 37.3% | 8.5%(+28.8)#12 | 11.4%(+25.9)#994 |
| 13. | Summerfield | 33.4% | 8.5%(+24.9)#13 | 11.4%(+22.0)#1,296 |
| 14. | Briar Chapel | 31.7% | 8.5%(+23.2)#14 | 11.4%(+20.3)#1,459 |
| 15. | Bald Head Island | 30.3% | 8.5%(+21.8)#15 | 11.4%(+18.9)#1,588 |
| 16. | Oak Ridge | 29.8% | 8.5%(+21.3)#16 | 11.4%(+18.4)#1,638 |
| 17. | Blowing Rock | 28.8% | 8.5%(+20.3)#17 | 11.4%(+17.4)#1,739 |
| 18. | Westport | 28.7% | 8.5%(+20.2)#18 | 11.4%(+17.3)#1,745 |
| 19. | Governors | 28.6% | 8.5%(+20.1)#19 | 11.4%(+17.2)#1,759 |
| 20. | Stokesdale | 26.8% | 8.5%(+18.3)#20 | 11.4%(+15.4)#1,957 |
| 21. | Trent Woods | 26.7% | 8.5%(+18.2)#21 | 11.4%(+15.3)#1,969 |
| 22. | Cary | 26.3% | 8.5%(+17.8)#22 | 11.4%(+14.9)#2,011 |
| 23. | Rolesville | 26.2% | 8.5%(+17.7)#23 | 11.4%(+14.8)#2,033 |
| 24. | Wesley Chapel | 26.1% | 8.5%(+17.6)#24 | 11.4%(+14.7)#2,044 |
| 25. | Cornelius | 25.0% | 8.5%(+16.5)#25 | 11.4%(+13.6)#2,157 |
| 26. | Waxhaw | 24.8% | 8.5%(+16.3)#26 | 11.4%(+13.4)#2,186 |
| 27. | Apex | 24.7% | 8.5%(+16.2)#27 | 11.4%(+13.3)#2,196 |
| 28. | St James | 24.2% | 8.5%(+15.7)#28 | 11.4%(+12.8)#2,276 |
| 29. | Chapel Hill | 23.3% | 8.5%(+14.8)#29 | 11.4%(+11.9)#2,420 |
| 30. | Colerain | 23.0% | 8.5%(+14.5)#30 | 11.4%(+11.6)#2,486 |
| 31. | Marshallberg | 22.5% | 8.5%(+14.0)#31 | 11.4%(+11.1)#2,574 |
| 32. | Huntersville | 22.2% | 8.5%(+13.7)#32 | 11.4%(+10.8)#2,614 |
| 33. | Holly Springs | 22.2% | 8.5%(+13.7)#33 | 11.4%(+10.8)#2,615 |
| 34. | Harrisburg | 21.8% | 8.5%(+13.3)#34 | 11.4%(+10.4)#2,692 |
| 35. | Waves | 21.8% | 8.5%(+13.3)#35 | 11.4%(+10.4)#2,703 |
| 36. | Topsail Beach | 21.6% | 8.5%(+13.1)#36 | 11.4%(+10.2)#2,739 |
| 37. | Carolina Meadows | 21.3% | 8.5%(+12.8)#37 | 11.4%(+9.90)#2,804 |
| 38. | Southern Shores | 20.5% | 8.5%(+12.0)#38 | 11.4%(+9.10)#2,941 |
| 39. | Wake Forest | 20.4% | 8.5%(+11.9)#39 | 11.4%(+9.00)#2,948 |
| 40. | Porters Neck | 20.3% | 8.5%(+11.8)#40 | 11.4%(+8.90)#2,979 |
| 41. | Ogden | 20.1% | 8.5%(+11.6)#41 | 11.4%(+8.70)#3,015 |
| 42. | Kure Beach | 20.1% | 8.5%(+11.6)#42 | 11.4%(+8.70)#3,022 |
| 43. | Fairview | 20.0% | 8.5%(+11.5)#43 | 11.4%(+8.60)#3,039 |
| 44. | Beech Mountain | 20.0% | 8.5%(+11.5)#44 | 11.4%(+8.60)#3,046 |
| 45. | Duck | 19.7% | 8.5%(+11.2)#45 | 11.4%(+8.30)#3,126 |
| 46. | Whispering Pines | 19.3% | 8.5%(+10.8)#46 | 11.4%(+7.90)#3,198 |
| 47. | Morrisville | 19.1% | 8.5%(+10.6)#47 | 11.4%(+7.70)#3,239 |
| 48. | Dudley | 19.1% | 8.5%(+10.6)#48 | 11.4%(+7.70)#3,251 |
| 49. | Pine Knoll Shores | 19.0% | 8.5%(+10.5)#49 | 11.4%(+7.60)#3,278 |
| 50. | Lake Lure | 18.8% | 8.5%(+10.3)#50 | 11.4%(+7.40)#3,326 |
| 51. | Hampstead | 18.7% | 8.5%(+10.2)#51 | 11.4%(+7.30)#3,344 |
| 52. | Pinehurst | 18.6% | 8.5%(+10.1)#52 | 11.4%(+7.20)#3,361 |
| 53. | Lowesville | 18.2% | 8.5%(+9.70)#53 | 11.4%(+6.80)#3,451 |
| 54. | Emerald Isle | 18.1% | 8.5%(+9.60)#54 | 11.4%(+6.70)#3,478 |
| 55. | Fearrington Village | 17.9% | 8.5%(+9.40)#55 | 11.4%(+6.50)#3,524 |
| 56. | Ocean Isle Beach | 17.8% | 8.5%(+9.30)#56 | 11.4%(+6.40)#3,562 |
| 57. | Caswell Beach | 17.4% | 8.5%(+8.90)#57 | 11.4%(+6.00)#3,644 |
| 58. | Mineral Springs | 17.1% | 8.5%(+8.60)#58 | 11.4%(+5.70)#3,704 |
| 59. | Avery Creek | 16.9% | 8.5%(+8.40)#59 | 11.4%(+5.50)#3,744 |
| 60. | Belmont | 16.6% | 8.5%(+8.10)#60 | 11.4%(+5.20)#3,818 |
| 61. | Moyock | 16.5% | 8.5%(+8.00)#61 | 11.4%(+5.10)#3,861 |
| 62. | Sea Breeze | 16.5% | 8.5%(+8.00)#62 | 11.4%(+5.10)#3,869 |
| 63. | Cherry Branch | 16.4% | 8.5%(+7.90)#63 | 11.4%(+5.00)#3,891 |
| 64. | Scotch Meadows | 16.4% | 8.5%(+7.90)#64 | 11.4%(+5.00)#3,896 |
| 65. | Seven Devils | 16.2% | 8.5%(+7.70)#65 | 11.4%(+4.80)#3,939 |
| 66. | Northlakes | 15.9% | 8.5%(+7.40)#66 | 11.4%(+4.50)#4,006 |
| 67. | Myrtle Grove | 15.6% | 8.5%(+7.10)#67 | 11.4%(+4.20)#4,092 |
| 68. | Stallings | 15.5% | 8.5%(+7.00)#68 | 11.4%(+4.10)#4,122 |
| 69. | Banner Elk | 15.5% | 8.5%(+7.00)#69 | 11.4%(+4.10)#4,134 |
| 70. | Carolina Beach | 15.4% | 8.5%(+6.90)#70 | 11.4%(+4.00)#4,150 |
| 71. | Mcleansville | 15.4% | 8.5%(+6.90)#71 | 11.4%(+4.00)#4,165 |
| 72. | Holly Ridge | 15.2% | 8.5%(+6.70)#72 | 11.4%(+3.80)#4,234 |
| 73. | Dortches | 15.1% | 8.5%(+6.60)#73 | 11.4%(+3.70)#4,276 |
| 74. | Carrboro | 14.9% | 8.5%(+6.40)#74 | 11.4%(+3.50)#4,313 |
| 75. | Lake Waccamaw | 14.6% | 8.5%(+6.10)#75 | 11.4%(+3.20)#4,435 |
| 76. | Surf City | 14.5% | 8.5%(+6.00)#76 | 11.4%(+3.10)#4,457 |
| 77. | Holden Beach | 14.5% | 8.5%(+6.00)#77 | 11.4%(+3.10)#4,467 |
| 78. | Cashiers | 14.4% | 8.5%(+5.90)#78 | 11.4%(+3.00)#4,514 |
| 79. | Bermuda Run | 14.3% | 8.5%(+5.80)#79 | 11.4%(+2.90)#4,540 |
| 80. | North Topsail Beach | 14.3% | 8.5%(+5.80)#80 | 11.4%(+2.90)#4,550 |
| 81. | Hillsborough | 14.2% | 8.5%(+5.70)#81 | 11.4%(+2.80)#4,580 |
| 82. | Matthews | 14.0% | 8.5%(+5.50)#82 | 11.4%(+2.60)#4,642 |
| 83. | Fallston | 13.9% | 8.5%(+5.40)#83 | 11.4%(+2.50)#4,715 |
| 84. | Red Oak | 13.8% | 8.5%(+5.30)#84 | 11.4%(+2.40)#4,733 |
| 85. | Nags Head | 13.8% | 8.5%(+5.30)#85 | 11.4%(+2.40)#4,734 |
| 86. | Ashley Heights | 13.6% | 8.5%(+5.10)#86 | 11.4%(+2.20)#4,839 |
| 87. | Brices Creek | 13.5% | 8.5%(+5.00)#87 | 11.4%(+2.10)#4,867 |
| 88. | Indian Trail | 13.3% | 8.5%(+4.80)#88 | 11.4%(+1.90)#4,925 |
| 89. | Sugar Mountain | 13.3% | 8.5%(+4.80)#89 | 11.4%(+1.90)#4,947 |
| 90. | Linville | 13.3% | 8.5%(+4.80)#90 | 11.4%(+1.90)#4,948 |
| 91. | Kitty Hawk | 13.2% | 8.5%(+4.70)#91 | 11.4%(+1.80)#4,977 |
| 92. | Oak Island | 13.0% | 8.5%(+4.50)#92 | 11.4%(+1.60)#5,056 |
| 93. | Weaverville | 13.0% | 8.5%(+4.50)#93 | 11.4%(+1.60)#5,063 |
| 94. | Broadway | 12.9% | 8.5%(+4.40)#94 | 11.4%(+1.50)#5,117 |
| 95. | Raleigh | 12.8% | 8.5%(+4.30)#95 | 11.4%(+1.40)#5,135 |
| 96. | Mint Hill | 12.8% | 8.5%(+4.30)#96 | 11.4%(+1.40)#5,145 |
| 97. | Forest Oaks | 12.7% | 8.5%(+4.20)#97 | 11.4%(+1.30)#5,202 |
| 98. | Bethania | 12.7% | 8.5%(+4.20)#98 | 11.4%(+1.30)#5,218 |
| 99. | Charlotte | 12.4% | 8.5%(+3.90)#99 | 11.4%(+1.000)#5,322 |
| 100. | Southern Pines | 12.3% | 8.5%(+3.80)#100 | 11.4%(+0.900)#5,374 |
Common Questions
What are the Top 10 Cities with the Highest Percentage of Households with Income Above $200,000 in North Carolina?
Top 10 Cities with the Highest Percentage of Households with Income Above $200,000 in North Carolina are:
#1
55.1%
#2
46.3%
#3
43.7%
#4
43.7%
#5
41.1%
#6
39.6%
#7
38.2%
#8
37.3%
#9
33.4%
#10
30.3%
What city has the Highest Percentage of Households with Income Above $200,000 in North Carolina?
Marvin has the Highest Percentage of Households with Income Above $200,000 in North Carolina with 55.1%.
What is the Percentage of Households with Income Above $200,000 in the State of North Carolina?
Percentage of Households with Income Above $200,000 in North Carolina is 8.5%.
What is the Percentage of Households with Income Above $200,000 in the United States?
Percentage of Households with Income Above $200,000 in the United States is 11.4%.