Advance, MI Map & Demographics
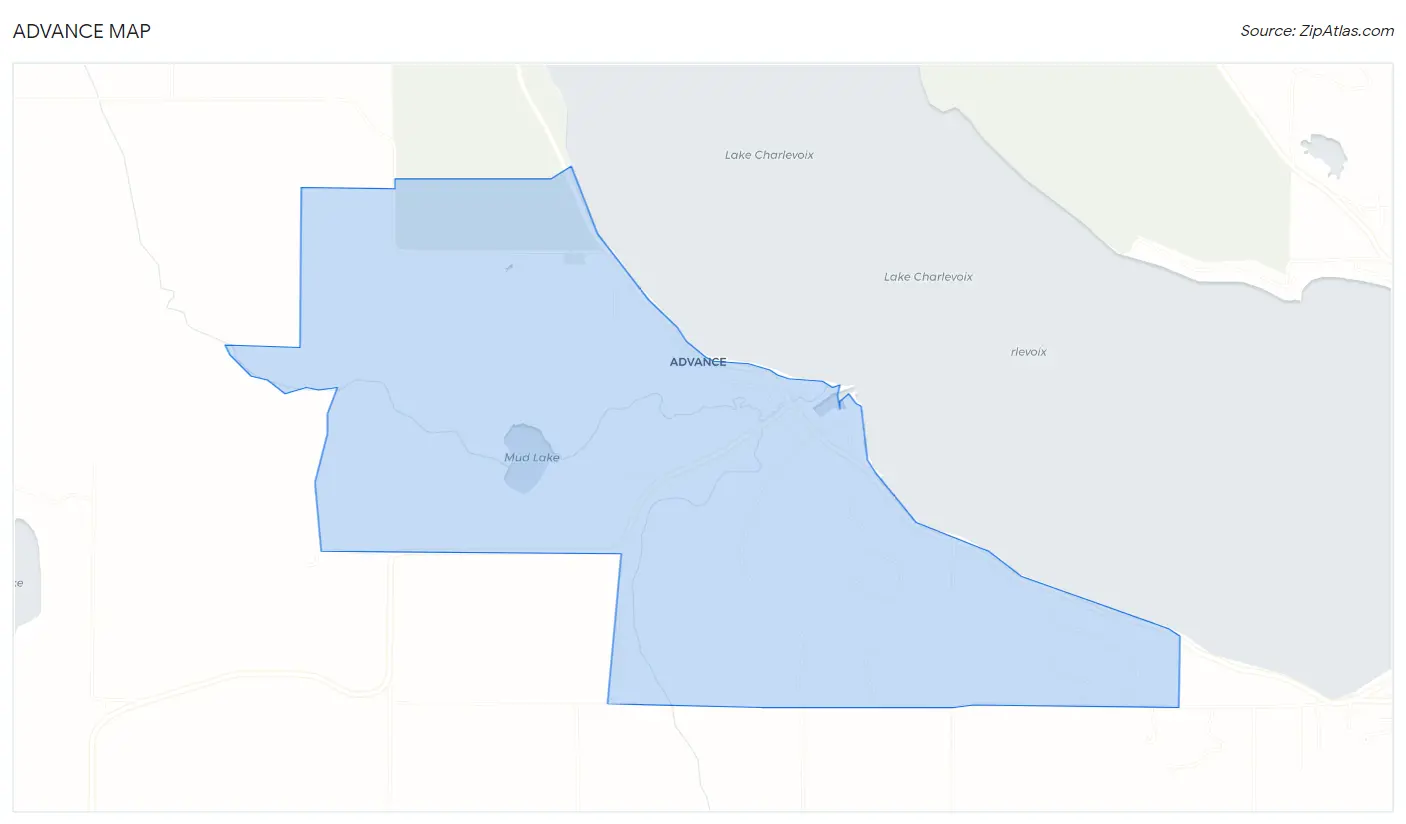
Advance Map
Advance Overview
$88,156
PER CAPITA INCOME
$120,833
AVG FAMILY INCOME
$90,833
AVG HOUSEHOLD INCOME
8.7%
WAGE / INCOME GAP [ % ]
91.3¢/ $1
WAGE / INCOME GAP [ $ ]
0.54
INEQUALITY / GINI INDEX
371
TOTAL POPULATION
185
MALE POPULATION
186
FEMALE POPULATION
99.46
MALES / 100 FEMALES
100.54
FEMALES / 100 MALES
63.1
MEDIAN AGE
2.1
AVG FAMILY SIZE
1.9
AVG HOUSEHOLD SIZE
161
LABOR FORCE [ PEOPLE ]
44.8%
PERCENT IN LABOR FORCE
1.9%
UNEMPLOYMENT RATE
Income in Advance
Income Overview in Advance
Per Capita Income in Advance is $88,156, while median incomes of families and households are $120,833 and $90,833 respectively.
| Characteristic | Number | Measure |
| Per Capita Income | 371 | $88,156 |
| Median Family Income | 142 | $120,833 |
| Mean Family Income | 142 | $197,676 |
| Median Household Income | 194 | $90,833 |
| Mean Household Income | 194 | $162,179 |
| Income Deficit | 142 | $0 |
| Wage / Income Gap (%) | 371 | 8.73% |
| Wage / Income Gap ($) | 371 | 91.27¢ per $1 |
| Gini / Inequality Index | 371 | 0.54 |
Earnings by Sex in Advance
Average Earnings in Advance are $72,969, $73,500 for men and $67,083 for women, a difference of 8.7%.
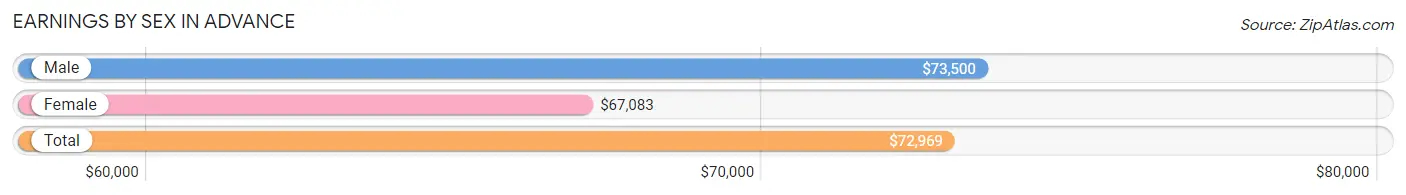
| Sex | Number | Average Earnings |
| Male | 80 (47.3%) | $73,500 |
| Female | 89 (52.7%) | $67,083 |
| Total | 169 (100.0%) | $72,969 |
Earnings by Sex by Income Bracket in Advance
The most common earnings brackets in Advance are $75,000 to $99,999 for men (21 | 26.3%) and $100,000+ for women (30 | 33.7%).
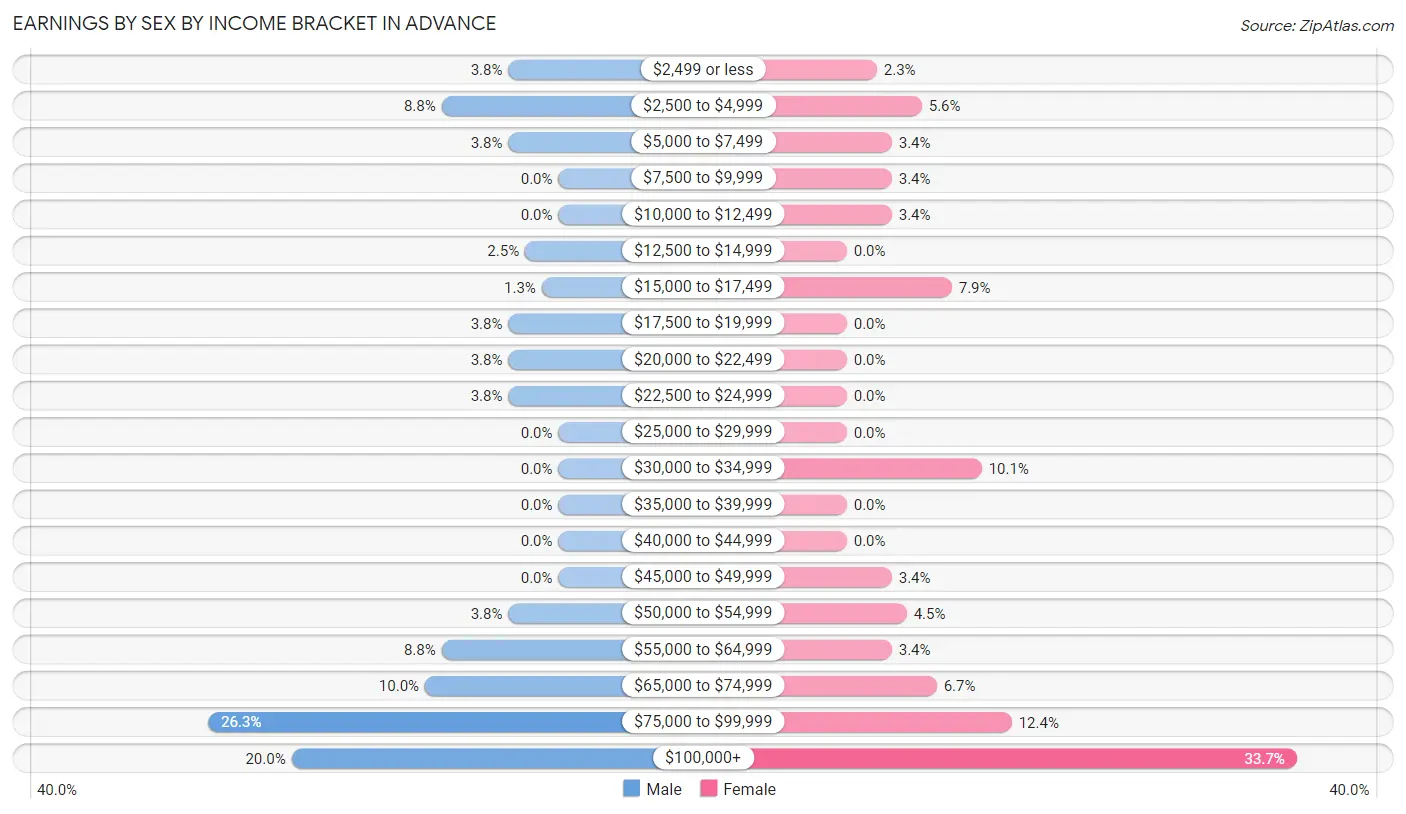
| Income | Male | Female |
| $2,499 or less | 3 (3.7%) | 2 (2.2%) |
| $2,500 to $4,999 | 7 (8.7%) | 5 (5.6%) |
| $5,000 to $7,499 | 3 (3.7%) | 3 (3.4%) |
| $7,500 to $9,999 | 0 (0.0%) | 3 (3.4%) |
| $10,000 to $12,499 | 0 (0.0%) | 3 (3.4%) |
| $12,500 to $14,999 | 2 (2.5%) | 0 (0.0%) |
| $15,000 to $17,499 | 1 (1.3%) | 7 (7.9%) |
| $17,500 to $19,999 | 3 (3.7%) | 0 (0.0%) |
| $20,000 to $22,499 | 3 (3.7%) | 0 (0.0%) |
| $22,500 to $24,999 | 3 (3.7%) | 0 (0.0%) |
| $25,000 to $29,999 | 0 (0.0%) | 0 (0.0%) |
| $30,000 to $34,999 | 0 (0.0%) | 9 (10.1%) |
| $35,000 to $39,999 | 0 (0.0%) | 0 (0.0%) |
| $40,000 to $44,999 | 0 (0.0%) | 0 (0.0%) |
| $45,000 to $49,999 | 0 (0.0%) | 3 (3.4%) |
| $50,000 to $54,999 | 3 (3.7%) | 4 (4.5%) |
| $55,000 to $64,999 | 7 (8.7%) | 3 (3.4%) |
| $65,000 to $74,999 | 8 (10.0%) | 6 (6.7%) |
| $75,000 to $99,999 | 21 (26.3%) | 11 (12.4%) |
| $100,000+ | 16 (20.0%) | 30 (33.7%) |
| Total | 80 (100.0%) | 89 (100.0%) |
Earnings by Sex by Educational Attainment in Advance
Average earnings in Advance are $84,688 for men and $73,333 for women, a difference of 13.4%. Men with an educational attainment of graduate degree enjoy the highest average annual earnings of $89,583, while those with high school diploma education earn the least with $18,333. Women with an educational attainment of graduate degree earn the most with the average annual earnings of $81,667, while those with graduate degree education have the smallest earnings of $81,667.
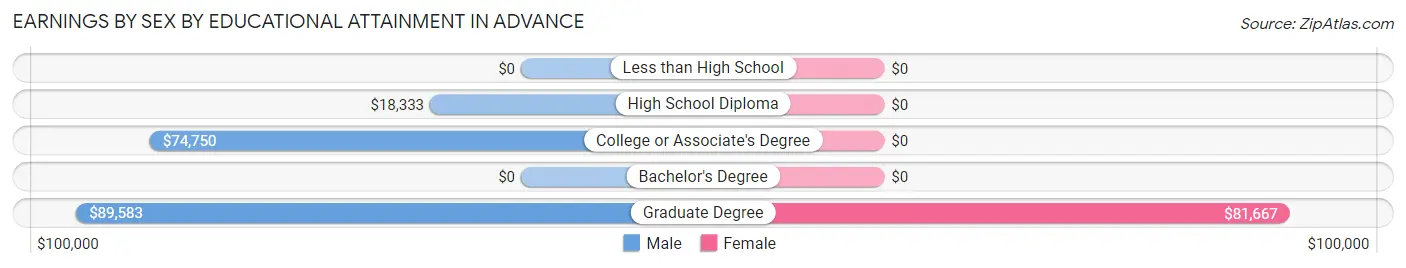
| Educational Attainment | Male Income | Female Income |
| Less than High School | - | - |
| High School Diploma | $18,333 | $0 |
| College or Associate's Degree | $74,750 | $0 |
| Bachelor's Degree | - | - |
| Graduate Degree | $89,583 | $81,667 |
| Total | $84,688 | $73,333 |
Family Income in Advance
Family Income Brackets in Advance
According to the Advance family income data, there are 37 families falling into the $200,000+ income range, which is the most common income bracket and makes up 26.1% of all families.
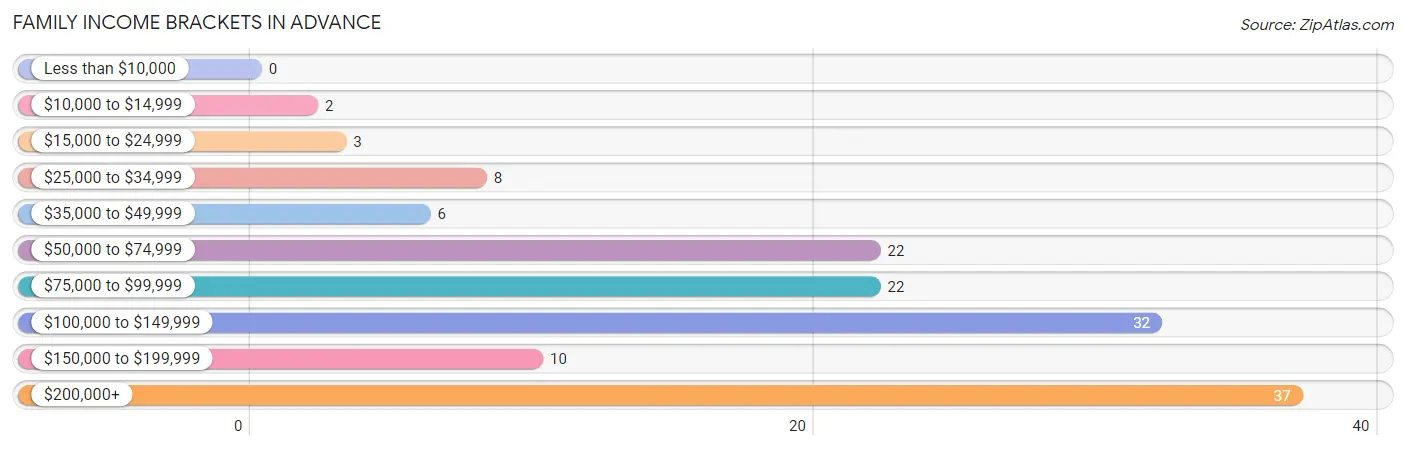
| Income Bracket | # Families | % Families |
| Less than $10,000 | 0 | 0.0% |
| $10,000 to $14,999 | 2 | 1.4% |
| $15,000 to $24,999 | 3 | 2.1% |
| $25,000 to $34,999 | 8 | 5.6% |
| $35,000 to $49,999 | 6 | 4.2% |
| $50,000 to $74,999 | 22 | 15.5% |
| $75,000 to $99,999 | 22 | 15.5% |
| $100,000 to $149,999 | 32 | 22.5% |
| $150,000 to $199,999 | 10 | 7.0% |
| $200,000+ | 37 | 26.1% |
Family Income by Famaliy Size in Advance
2-person families (120 | 84.5%) account for the highest median family income in Advance with $121,667 per family, while 2-person families (120 | 84.5%) have the highest median income of $60,834 per family member.
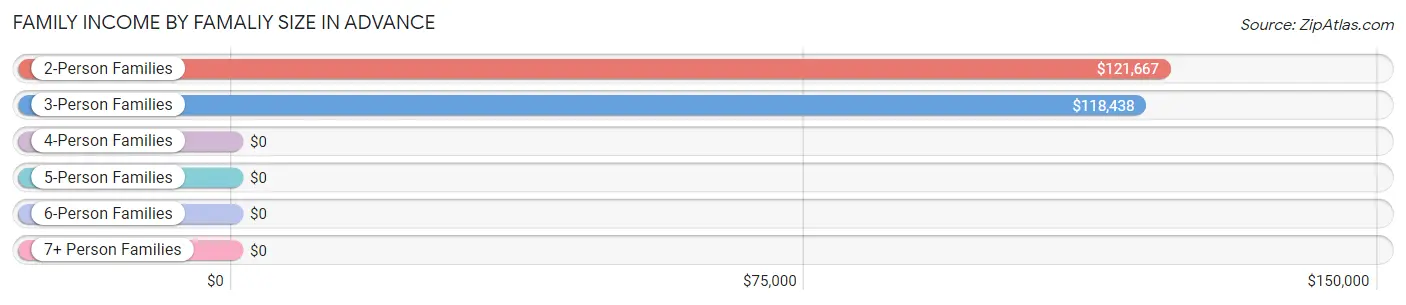
| Income Bracket | # Families | Median Income |
| 2-Person Families | 120 (84.5%) | $121,667 |
| 3-Person Families | 19 (13.4%) | $118,438 |
| 4-Person Families | 3 (2.1%) | $0 |
| 5-Person Families | 0 (0.0%) | $0 |
| 6-Person Families | 0 (0.0%) | $0 |
| 7+ Person Families | 0 (0.0%) | $0 |
| Total | 142 (100.0%) | $120,833 |
Family Income by Number of Earners in Advance
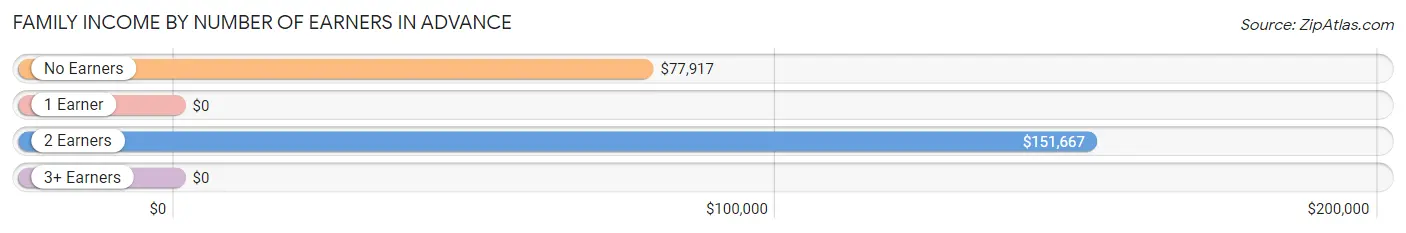
| Number of Earners | # Families | Median Income |
| No Earners | 55 (38.7%) | $77,917 |
| 1 Earner | 58 (40.8%) | $0 |
| 2 Earners | 22 (15.5%) | $151,667 |
| 3+ Earners | 7 (4.9%) | $0 |
| Total | 142 (100.0%) | $120,833 |
Household Income in Advance
Household Income Brackets in Advance
With 37 households falling in the category, the $200,000+ income range is the most frequent in Advance, accounting for 19.1% of all households. In contrast, only 2 households (1.0%) fall into the $10,000 to $14,999 income bracket, making it the least populous group.
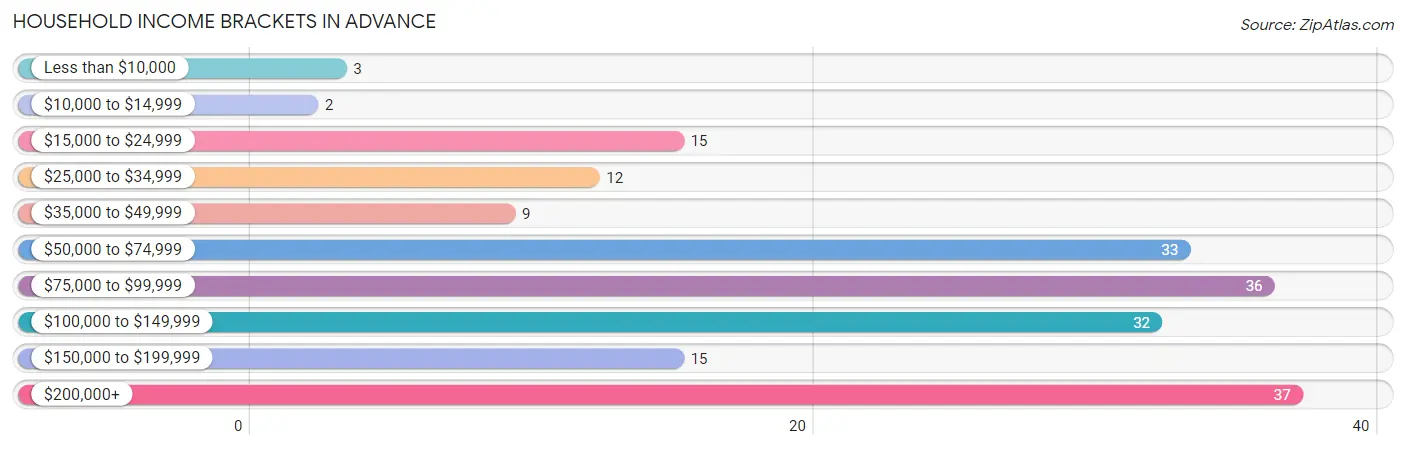
| Income Bracket | # Households | % Households |
| Less than $10,000 | 3 | 1.5% |
| $10,000 to $14,999 | 2 | 1.0% |
| $15,000 to $24,999 | 15 | 7.7% |
| $25,000 to $34,999 | 12 | 6.2% |
| $35,000 to $49,999 | 9 | 4.6% |
| $50,000 to $74,999 | 33 | 17.0% |
| $75,000 to $99,999 | 36 | 18.6% |
| $100,000 to $149,999 | 32 | 16.5% |
| $150,000 to $199,999 | 15 | 7.7% |
| $200,000+ | 37 | 19.1% |
Household Income by Householder Age in Advance
The median household income in Advance is $90,833, with the highest median household income of $195,250 found in the 45 to 64 years age bracket for the primary householder. A total of 75 households (38.7%) fall into this category.
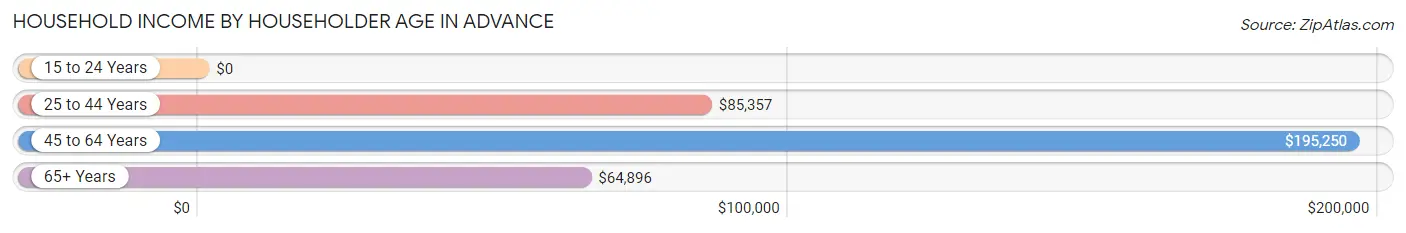
| Income Bracket | # Households | Median Income |
| 15 to 24 Years | 0 (0.0%) | $0 |
| 25 to 44 Years | 28 (14.4%) | $85,357 |
| 45 to 64 Years | 75 (38.7%) | $195,250 |
| 65+ Years | 91 (46.9%) | $64,896 |
| Total | 194 (100.0%) | $90,833 |
Poverty in Advance
Income Below Poverty by Sex and Age in Advance
With 1.1% poverty level for males and 9.7% for females among the residents of Advance, 55 to 64 year old males and 25 to 34 year old females are the most vulnerable to poverty, with 2 males (3.8%) and 13 females (65.0%) in their respective age groups living below the poverty level.
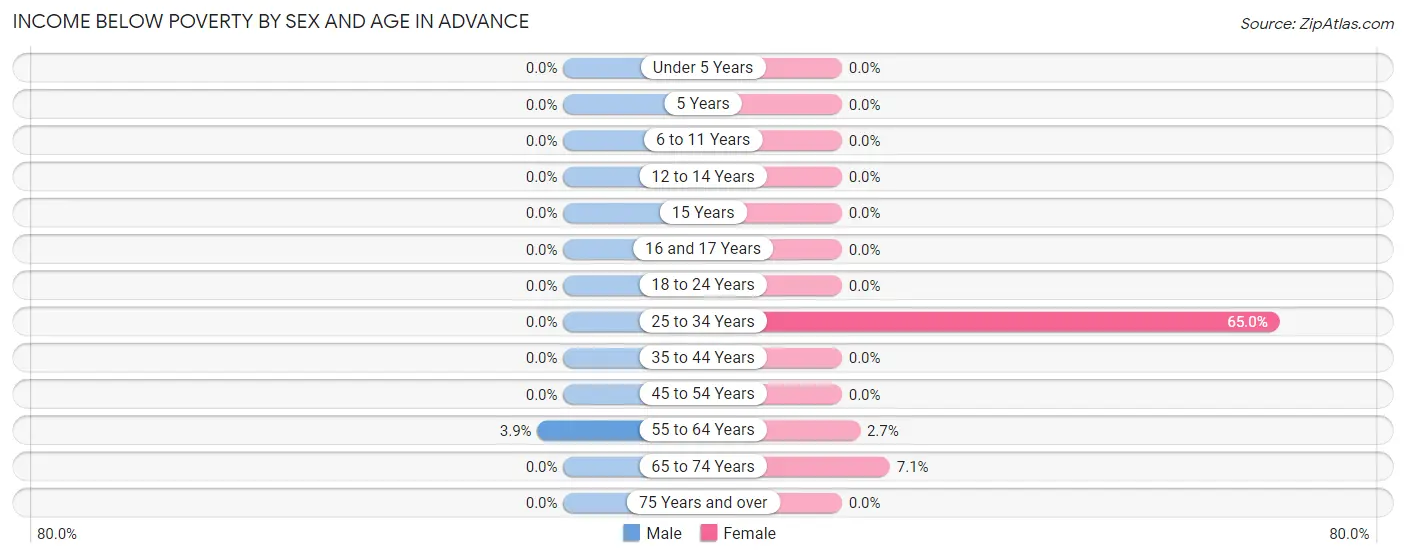
| Age Bracket | Male | Female |
| Under 5 Years | 0 (0.0%) | 0 (0.0%) |
| 5 Years | 0 (0.0%) | 0 (0.0%) |
| 6 to 11 Years | 0 (0.0%) | 0 (0.0%) |
| 12 to 14 Years | 0 (0.0%) | 0 (0.0%) |
| 15 Years | 0 (0.0%) | 0 (0.0%) |
| 16 and 17 Years | 0 (0.0%) | 0 (0.0%) |
| 18 to 24 Years | 0 (0.0%) | 0 (0.0%) |
| 25 to 34 Years | 0 (0.0%) | 13 (65.0%) |
| 35 to 44 Years | 0 (0.0%) | 0 (0.0%) |
| 45 to 54 Years | 0 (0.0%) | 0 (0.0%) |
| 55 to 64 Years | 2 (3.8%) | 2 (2.7%) |
| 65 to 74 Years | 0 (0.0%) | 3 (7.1%) |
| 75 Years and over | 0 (0.0%) | 0 (0.0%) |
| Total | 2 (1.1%) | 18 (9.7%) |
Income Above Poverty by Sex and Age in Advance
According to the poverty statistics in Advance, males aged 18 to 24 years and females aged under 5 years are the age groups that are most secure financially, with 100.0% of males and 100.0% of females in these age groups living above the poverty line.
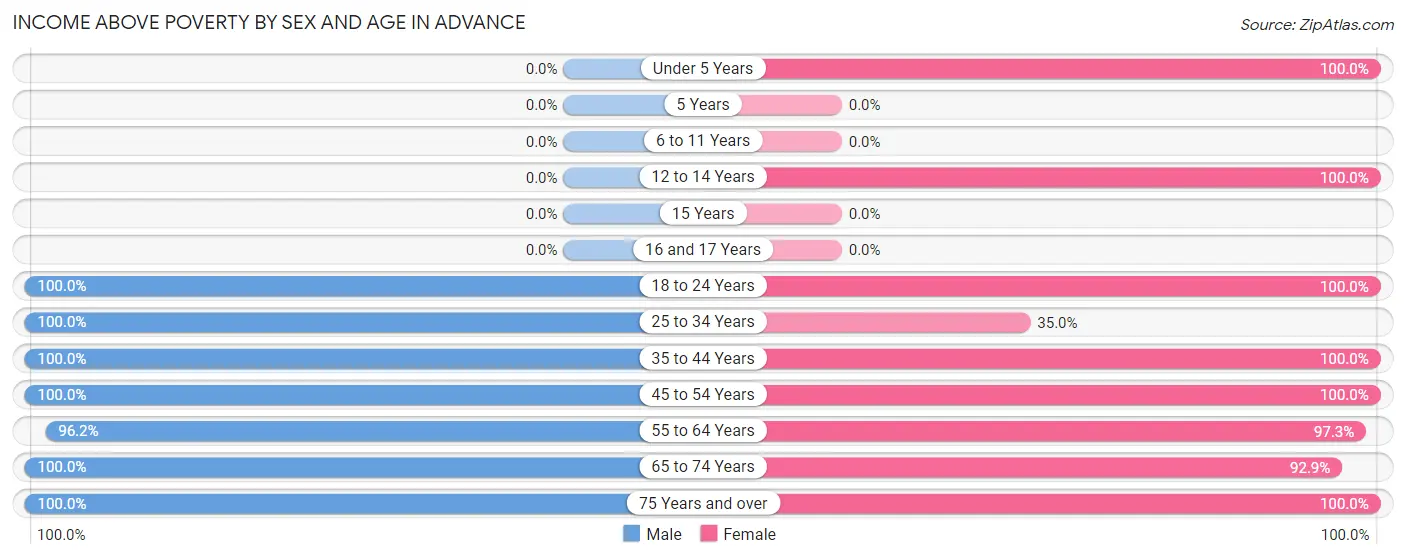
| Age Bracket | Male | Female |
| Under 5 Years | 0 (0.0%) | 9 (100.0%) |
| 5 Years | 0 (0.0%) | 0 (0.0%) |
| 6 to 11 Years | 0 (0.0%) | 0 (0.0%) |
| 12 to 14 Years | 0 (0.0%) | 3 (100.0%) |
| 15 Years | 0 (0.0%) | 0 (0.0%) |
| 16 and 17 Years | 0 (0.0%) | 0 (0.0%) |
| 18 to 24 Years | 13 (100.0%) | 3 (100.0%) |
| 25 to 34 Years | 11 (100.0%) | 7 (35.0%) |
| 35 to 44 Years | 8 (100.0%) | 2 (100.0%) |
| 45 to 54 Years | 19 (100.0%) | 15 (100.0%) |
| 55 to 64 Years | 50 (96.2%) | 72 (97.3%) |
| 65 to 74 Years | 55 (100.0%) | 39 (92.9%) |
| 75 Years and over | 27 (100.0%) | 18 (100.0%) |
| Total | 183 (98.9%) | 168 (90.3%) |
Income Below Poverty Among Married-Couple Families in Advance
The poverty statistics for married-couple families in Advance show that 1.5% or 2 of the total 136 families live below the poverty line. Families with no children have the highest poverty rate of 1.5%, comprising of 2 families. On the other hand, families with 1 or 2 children have the lowest poverty rate of 0.0%, which includes 0 families.
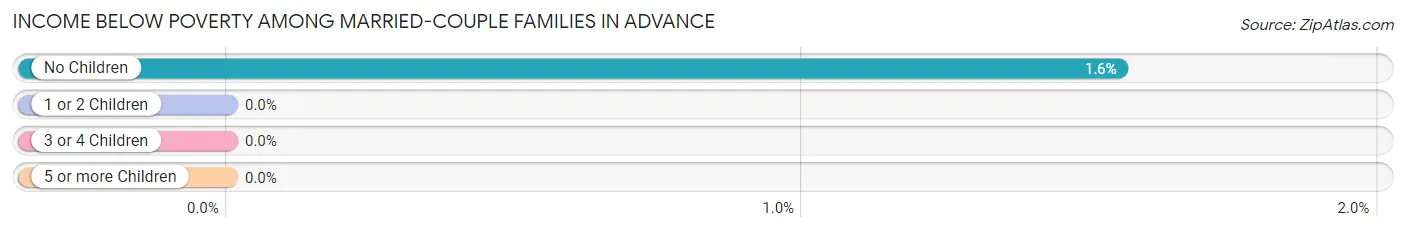
| Children | Above Poverty | Below Poverty |
| No Children | 127 (98.5%) | 2 (1.5%) |
| 1 or 2 Children | 7 (100.0%) | 0 (0.0%) |
| 3 or 4 Children | 0 (0.0%) | 0 (0.0%) |
| 5 or more Children | 0 (0.0%) | 0 (0.0%) |
| Total | 134 (98.5%) | 2 (1.5%) |
Income Below Poverty Among Single-Parent Households in Advance
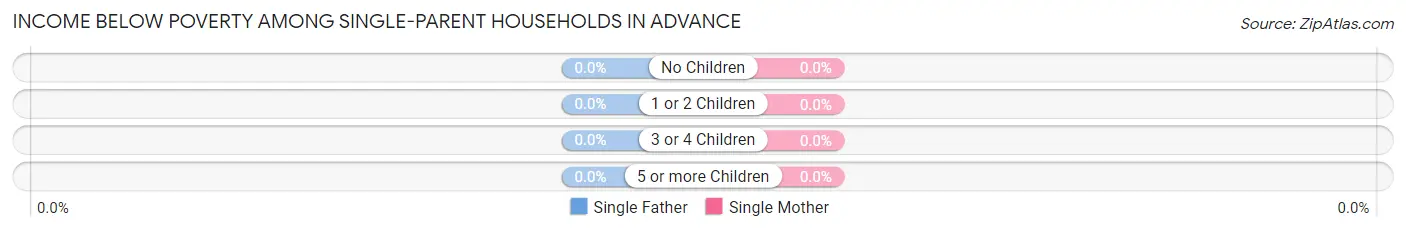
| Children | Single Father | Single Mother |
| No Children | 0 (0.0%) | 0 (0.0%) |
| 1 or 2 Children | 0 (0.0%) | 0 (0.0%) |
| 3 or 4 Children | 0 (0.0%) | 0 (0.0%) |
| 5 or more Children | 0 (0.0%) | 0 (0.0%) |
| Total | 0 (0.0%) | 0 (0.0%) |
Income Below Poverty Among Married-Couple vs Single-Parent Households in Advance
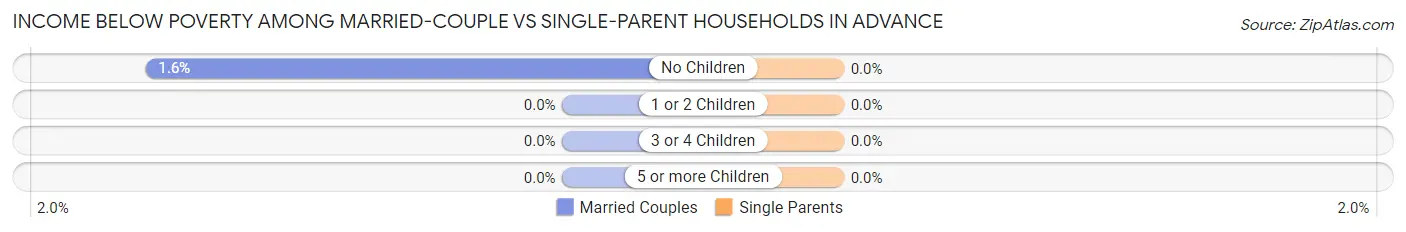
| Children | Married-Couple Families | Single-Parent Households |
| No Children | 2 (1.5%) | 0 (0.0%) |
| 1 or 2 Children | 0 (0.0%) | 0 (0.0%) |
| 3 or 4 Children | 0 (0.0%) | 0 (0.0%) |
| 5 or more Children | 0 (0.0%) | 0 (0.0%) |
| Total | 2 (1.5%) | 0 (0.0%) |
Race in Advance
The most populous races in Advance are White / Caucasian (369 | 99.5%), and Native / Alaskan (2 | 0.5%).
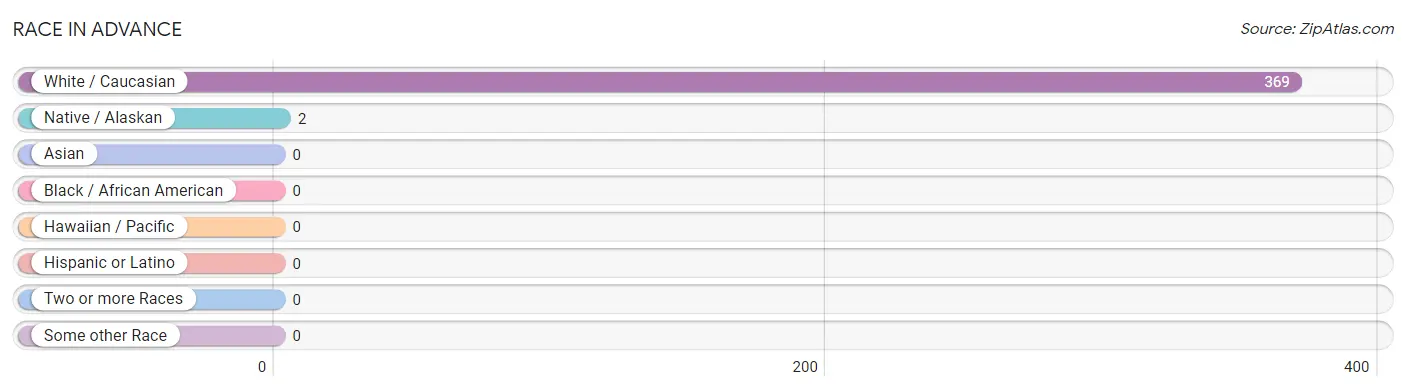
| Race | # Population | % Population |
| Asian | 0 | 0.0% |
| Black / African American | 0 | 0.0% |
| Hawaiian / Pacific | 0 | 0.0% |
| Hispanic or Latino | 0 | 0.0% |
| Native / Alaskan | 2 | 0.5% |
| White / Caucasian | 369 | 99.5% |
| Two or more Races | 0 | 0.0% |
| Some other Race | 0 | 0.0% |
| Total | 371 | 100.0% |
Ancestry in Advance
The most populous ancestries reported in Advance are German (93 | 25.1%), Irish (90 | 24.3%), English (55 | 14.8%), Polish (46 | 12.4%), and Danish (27 | 7.3%), together accounting for 83.8% of all Advance residents.
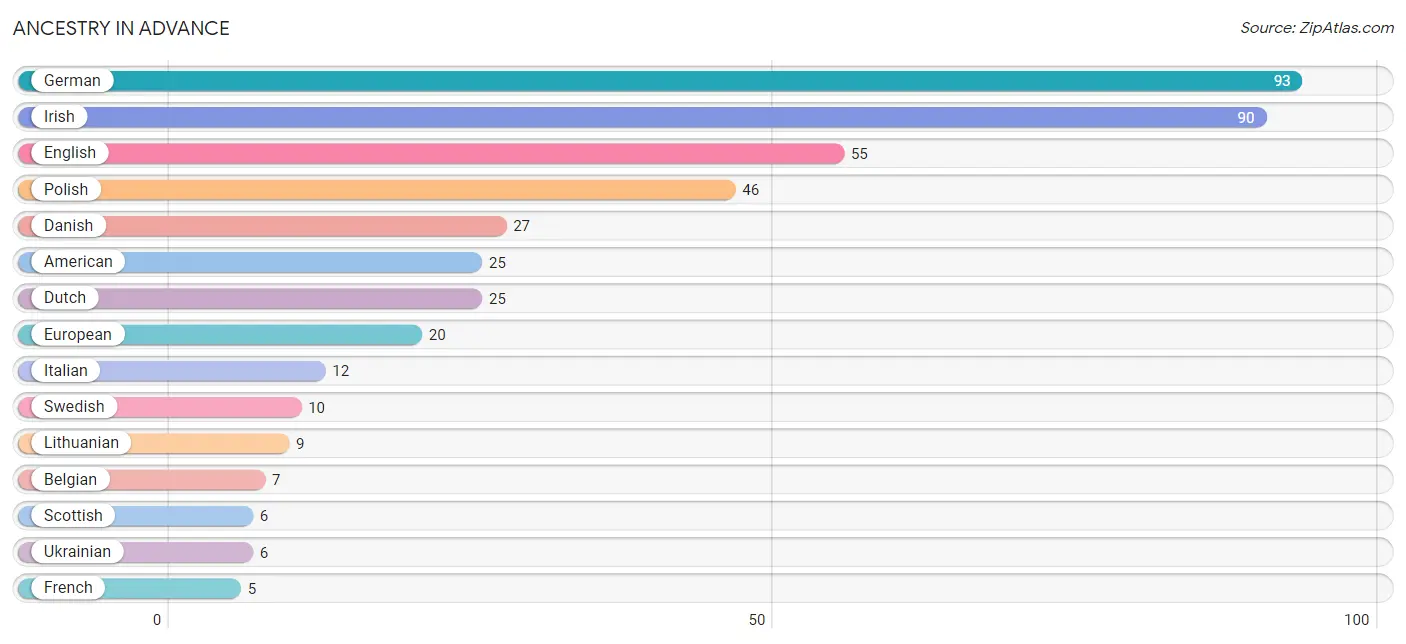
| Ancestry | # Population | % Population |
| American | 25 | 6.7% |
| Austrian | 4 | 1.1% |
| Belgian | 7 | 1.9% |
| Canadian | 2 | 0.5% |
| Danish | 27 | 7.3% |
| Dutch | 25 | 6.7% |
| Eastern European | 2 | 0.5% |
| English | 55 | 14.8% |
| European | 20 | 5.4% |
| Finnish | 3 | 0.8% |
| French | 5 | 1.3% |
| German | 93 | 25.1% |
| Hungarian | 2 | 0.5% |
| Irish | 90 | 24.3% |
| Italian | 12 | 3.2% |
| Lithuanian | 9 | 2.4% |
| Northern European | 3 | 0.8% |
| Norwegian | 3 | 0.8% |
| Ottawa | 2 | 0.5% |
| Polish | 46 | 12.4% |
| Russian | 4 | 1.1% |
| Scotch-Irish | 3 | 0.8% |
| Scottish | 6 | 1.6% |
| Swedish | 10 | 2.7% |
| Ukrainian | 6 | 1.6% | View All 25 Rows |
Immigrants in Advance
The most numerous immigrant groups reported in Advance came from Europe (4 | 1.1%), Germany (4 | 1.1%), and Western Europe (4 | 1.1%), together accounting for 3.2% of all Advance residents.
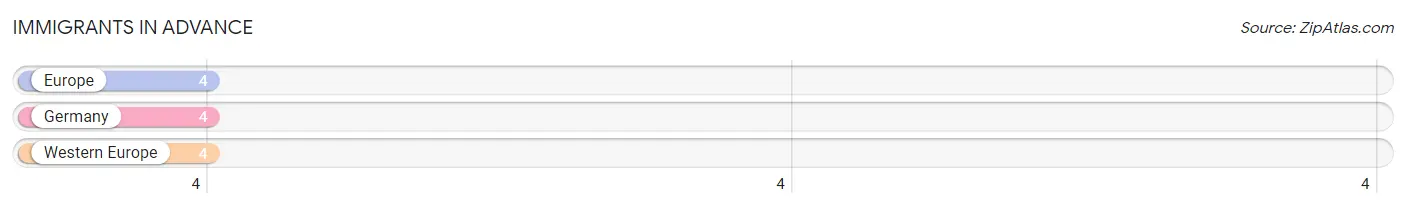
| Immigration Origin | # Population | % Population |
| Europe | 4 | 1.1% |
| Germany | 4 | 1.1% |
| Western Europe | 4 | 1.1% | View All 3 Rows |
Sex and Age in Advance
Sex and Age in Advance
The most populous age groups in Advance are 55 to 59 Years (32 | 17.3%) for men and 60 to 64 Years (41 | 22.0%) for women.
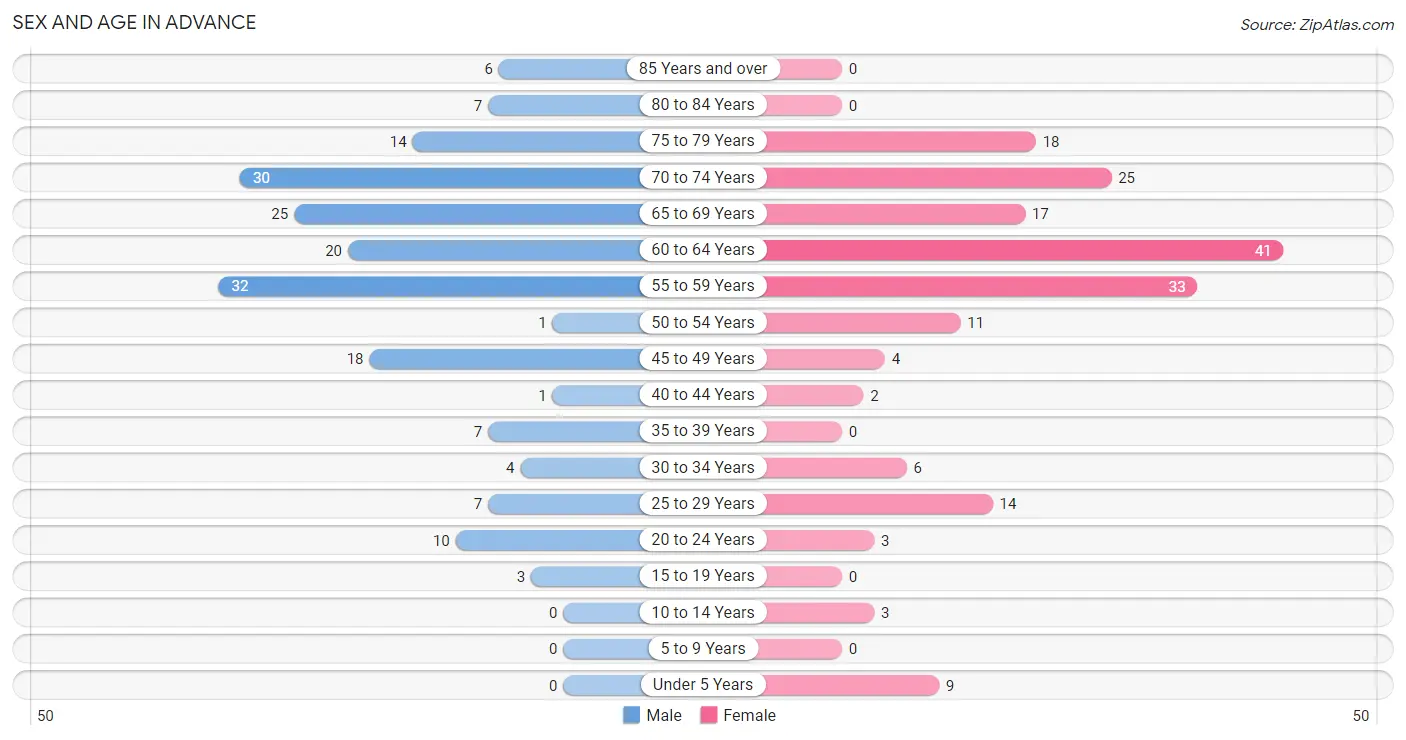
| Age Bracket | Male | Female |
| Under 5 Years | 0 (0.0%) | 9 (4.8%) |
| 5 to 9 Years | 0 (0.0%) | 0 (0.0%) |
| 10 to 14 Years | 0 (0.0%) | 3 (1.6%) |
| 15 to 19 Years | 3 (1.6%) | 0 (0.0%) |
| 20 to 24 Years | 10 (5.4%) | 3 (1.6%) |
| 25 to 29 Years | 7 (3.8%) | 14 (7.5%) |
| 30 to 34 Years | 4 (2.2%) | 6 (3.2%) |
| 35 to 39 Years | 7 (3.8%) | 0 (0.0%) |
| 40 to 44 Years | 1 (0.5%) | 2 (1.1%) |
| 45 to 49 Years | 18 (9.7%) | 4 (2.1%) |
| 50 to 54 Years | 1 (0.5%) | 11 (5.9%) |
| 55 to 59 Years | 32 (17.3%) | 33 (17.7%) |
| 60 to 64 Years | 20 (10.8%) | 41 (22.0%) |
| 65 to 69 Years | 25 (13.5%) | 17 (9.1%) |
| 70 to 74 Years | 30 (16.2%) | 25 (13.4%) |
| 75 to 79 Years | 14 (7.6%) | 18 (9.7%) |
| 80 to 84 Years | 7 (3.8%) | 0 (0.0%) |
| 85 Years and over | 6 (3.2%) | 0 (0.0%) |
| Total | 185 (100.0%) | 186 (100.0%) |
Families and Households in Advance
Median Family Size in Advance
The median family size in Advance is 2.13 persons per family, with single male/father families (3 | 2.1%) accounting for the largest median family size of 3 persons per family. On the other hand, married-couple families (136 | 95.8%) represent the smallest median family size with 2.11 persons per family.
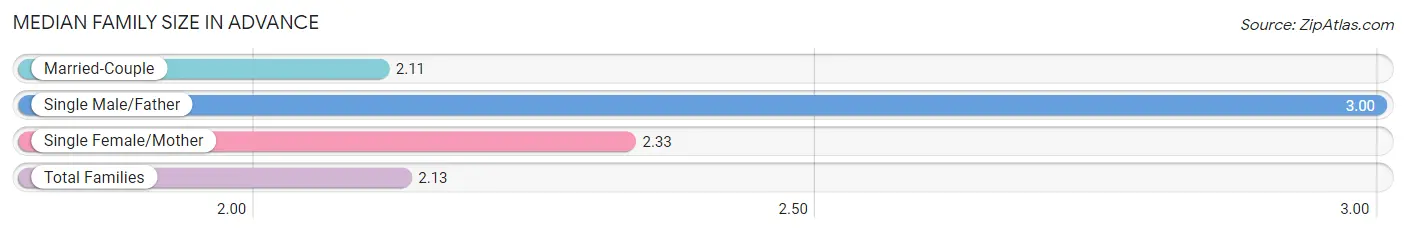
| Family Type | # Families | Family Size |
| Married-Couple | 136 (95.8%) | 2.11 |
| Single Male/Father | 3 (2.1%) | 3.00 |
| Single Female/Mother | 3 (2.1%) | 2.33 |
| Total Families | 142 (100.0%) | 2.13 |
Median Household Size in Advance
The median household size in Advance is 1.91 persons per household, with single male/father households (3 | 1.5%) accounting for the largest median household size of 4 persons per household. non-family households (52 | 26.8%) represent the smallest median household size with 1.25 persons per household.
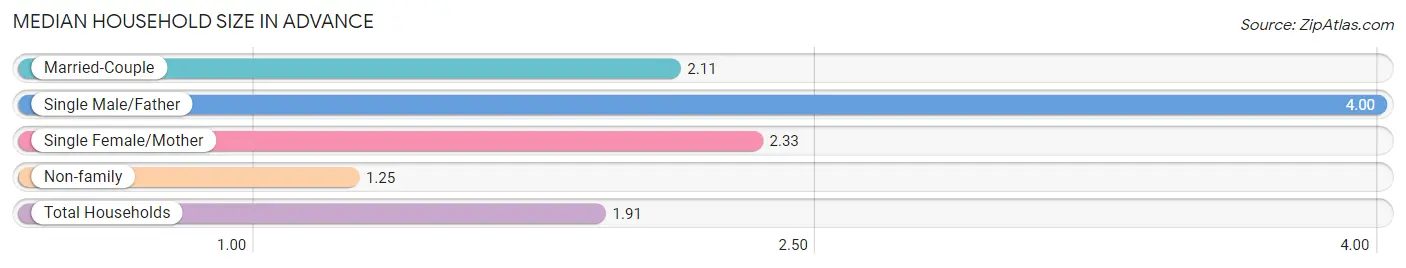
| Household Type | # Households | Household Size |
| Married-Couple | 136 (70.1%) | 2.11 |
| Single Male/Father | 3 (1.5%) | 4.00 |
| Single Female/Mother | 3 (1.5%) | 2.33 |
| Non-family | 52 (26.8%) | 1.25 |
| Total Households | 194 (100.0%) | 1.91 |
Household Size by Marriage Status in Advance
Out of a total of 194 households in Advance, 142 (73.2%) are family households, while 52 (26.8%) are nonfamily households. The most numerous type of family households are 2-person households, comprising 120, and the most common type of nonfamily households are 1-person households, comprising 37.
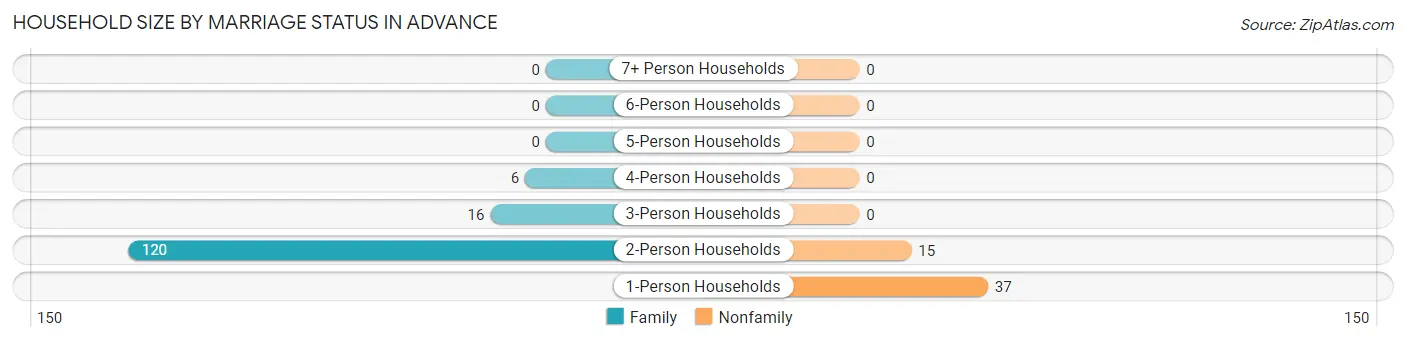
| Household Size | Family Households | Nonfamily Households |
| 1-Person Households | - | 37 (19.1%) |
| 2-Person Households | 120 (61.9%) | 15 (7.7%) |
| 3-Person Households | 16 (8.3%) | 0 (0.0%) |
| 4-Person Households | 6 (3.1%) | 0 (0.0%) |
| 5-Person Households | 0 (0.0%) | 0 (0.0%) |
| 6-Person Households | 0 (0.0%) | 0 (0.0%) |
| 7+ Person Households | 0 (0.0%) | 0 (0.0%) |
| Total | 142 (73.2%) | 52 (26.8%) |
Female Fertility in Advance
Fertility by Age in Advance
Average fertility rate in Advance is 125.0 births per 1,000 women. Women in the age bracket of 20 to 34 years have the highest fertility rate with 174.0 births per 1,000 women. Women in the age bracket of 20 to 34 years acount for 100.0% of all women with births.
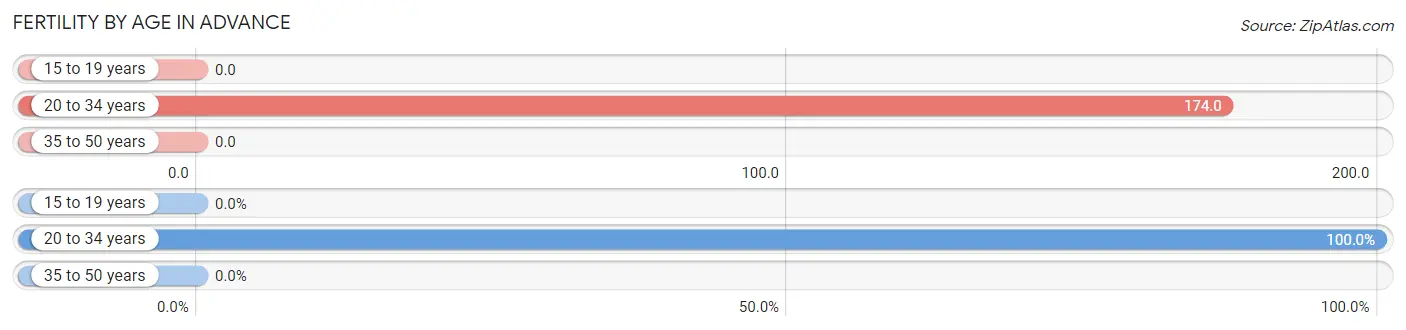
| Age Bracket | Women with Births | Births / 1,000 Women |
| 15 to 19 years | 0 (0.0%) | 0.0 |
| 20 to 34 years | 4 (100.0%) | 174.0 |
| 35 to 50 years | 0 (0.0%) | 0.0 |
| Total | 4 (100.0%) | 125.0 |
Fertility by Age by Marriage Status in Advance
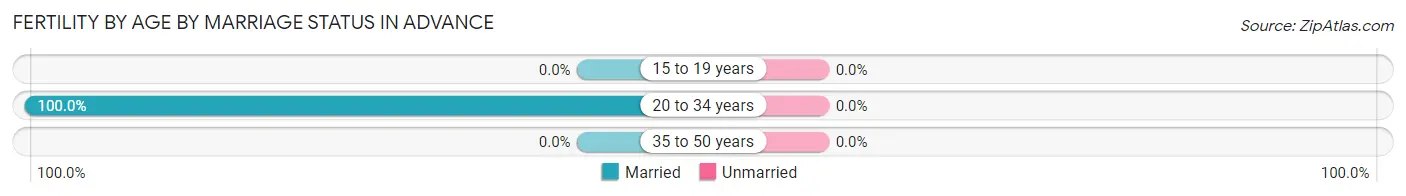
| Age Bracket | Married | Unmarried |
| 15 to 19 years | 0 (0.0%) | 0 (0.0%) |
| 20 to 34 years | 4 (100.0%) | 0 (0.0%) |
| 35 to 50 years | 0 (0.0%) | 0 (0.0%) |
| Total | 4 (100.0%) | 0 (0.0%) |
Fertility by Education in Advance
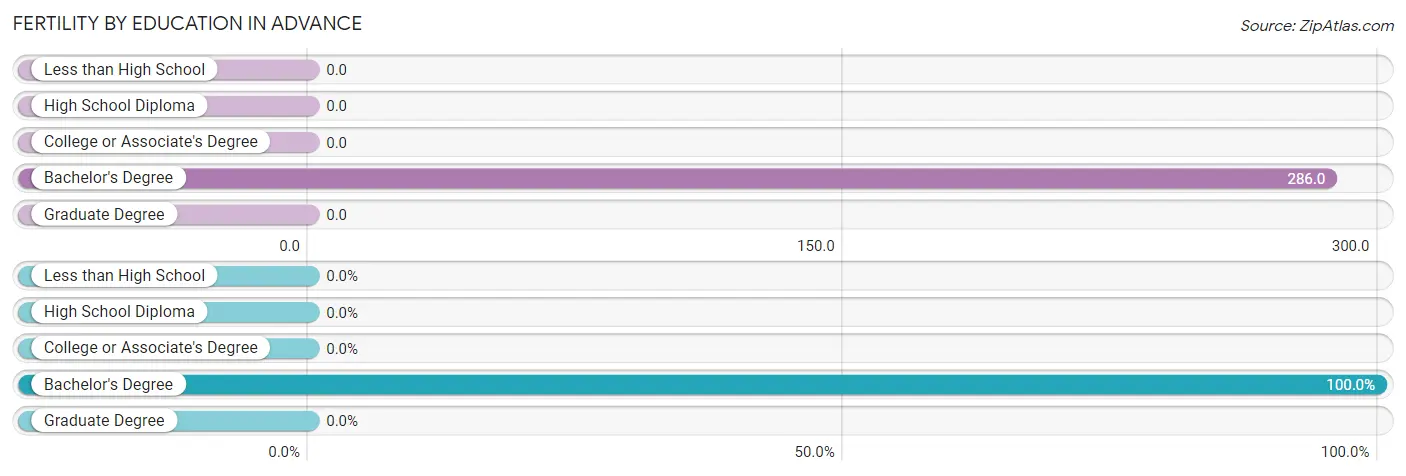
| Educational Attainment | Women with Births | Births / 1,000 Women |
| Less than High School | 0 (0.0%) | 0.0 |
| High School Diploma | 0 (0.0%) | 0.0 |
| College or Associate's Degree | 0 (0.0%) | 0.0 |
| Bachelor's Degree | 4 (100.0%) | 286.0 |
| Graduate Degree | 0 (0.0%) | 0.0 |
| Total | 4 (100.0%) | 125.0 |
Fertility by Education by Marriage Status in Advance
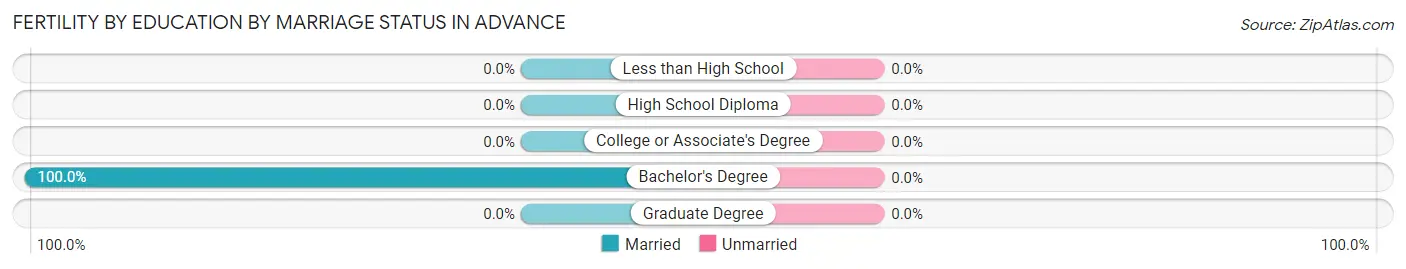
| Educational Attainment | Married | Unmarried |
| Less than High School | 0 (0.0%) | 0 (0.0%) |
| High School Diploma | 0 (0.0%) | 0 (0.0%) |
| College or Associate's Degree | 0 (0.0%) | 0 (0.0%) |
| Bachelor's Degree | 4 (100.0%) | 0 (0.0%) |
| Graduate Degree | 0 (0.0%) | 0 (0.0%) |
| Total | 4 (100.0%) | 0 (0.0%) |
Employment Characteristics in Advance
Employment by Class of Employer in Advance
Among the 158 employed individuals in Advance, private company employees (100 | 63.3%), local government employees (16 | 10.1%), and self-employed (incorporated) (13 | 8.2%) make up the most common classes of employment.
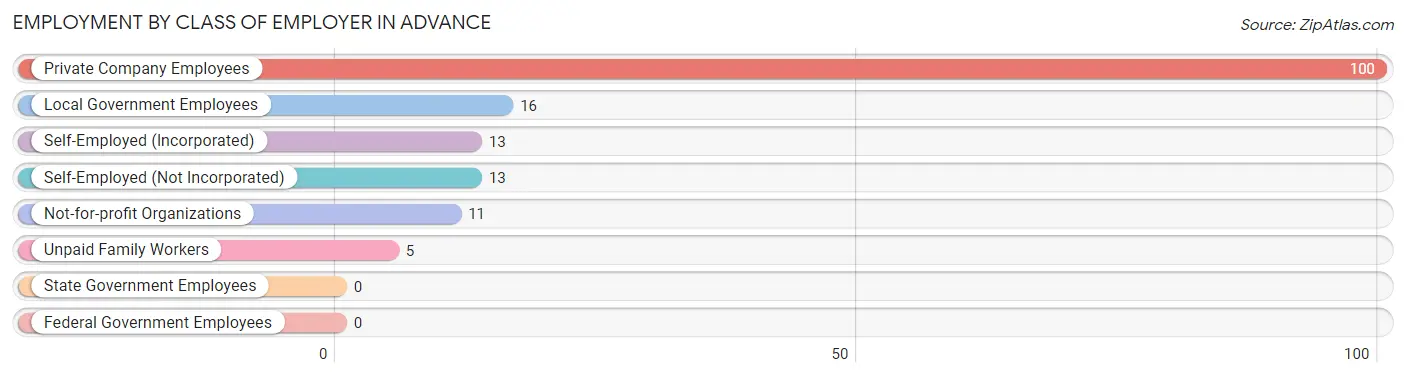
| Employer Class | # Employees | % Employees |
| Private Company Employees | 100 | 63.3% |
| Self-Employed (Incorporated) | 13 | 8.2% |
| Self-Employed (Not Incorporated) | 13 | 8.2% |
| Not-for-profit Organizations | 11 | 7.0% |
| Local Government Employees | 16 | 10.1% |
| State Government Employees | 0 | 0.0% |
| Federal Government Employees | 0 | 0.0% |
| Unpaid Family Workers | 5 | 3.2% |
| Total | 158 | 100.0% |
Employment Status by Age in Advance
According to the labor force statistics for Advance, out of the total population over 16 years of age (359), 44.8% or 161 individuals are in the labor force, with 1.9% or 3 of them unemployed. The age group with the highest labor force participation rate is 45 to 54 years, with 100.0% or 34 individuals in the labor force. Within the labor force, the 65 to 74 years age range has the highest percentage of unemployed individuals, with 12.5% or 3 of them being unemployed.
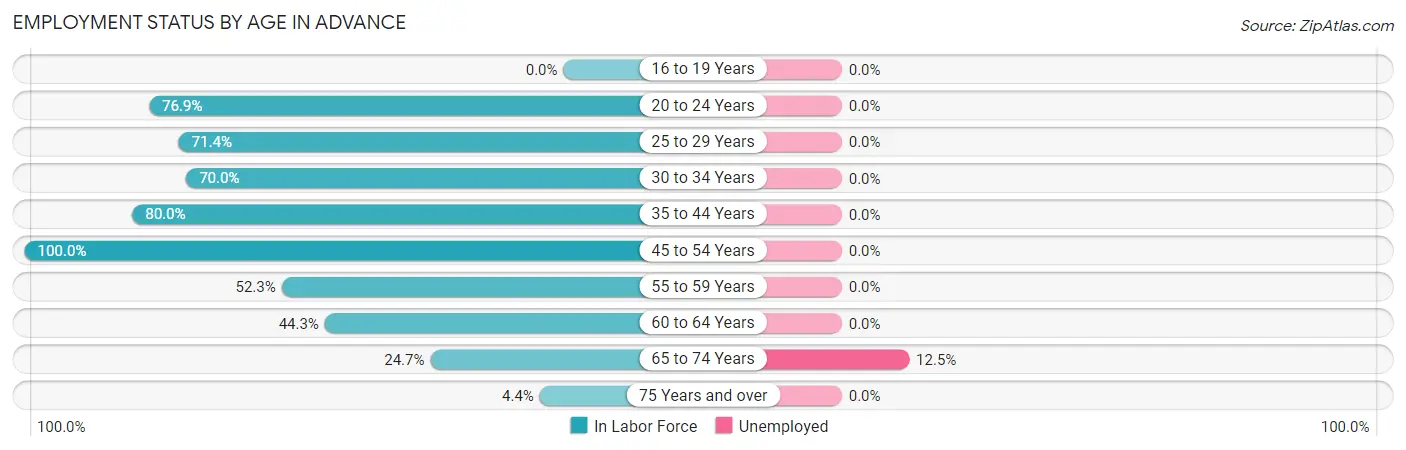
| Age Bracket | In Labor Force | Unemployed |
| 16 to 19 Years | 0 (0.0%) | 0 (0.0%) |
| 20 to 24 Years | 10 (76.9%) | 0 (0.0%) |
| 25 to 29 Years | 15 (71.4%) | 0 (0.0%) |
| 30 to 34 Years | 7 (70.0%) | 0 (0.0%) |
| 35 to 44 Years | 8 (80.0%) | 0 (0.0%) |
| 45 to 54 Years | 34 (100.0%) | 0 (0.0%) |
| 55 to 59 Years | 34 (52.3%) | 0 (0.0%) |
| 60 to 64 Years | 27 (44.3%) | 0 (0.0%) |
| 65 to 74 Years | 24 (24.7%) | 3 (12.5%) |
| 75 Years and over | 2 (4.4%) | 0 (0.0%) |
| Total | 161 (44.8%) | 3 (1.9%) |
Employment Status by Educational Attainment in Advance
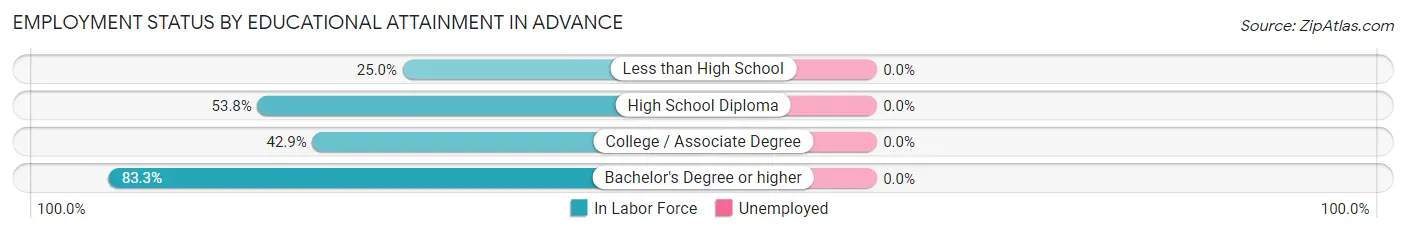
| Educational Attainment | In Labor Force | Unemployed |
| Less than High School | 2 (25.0%) | 0 (0.0%) |
| High School Diploma | 7 (53.8%) | 0 (0.0%) |
| College / Associate Degree | 36 (42.9%) | 0 (0.0%) |
| Bachelor's Degree or higher | 80 (83.3%) | 0 (0.0%) |
| Total | 125 (62.2%) | 0 (0.0%) |
Employment Occupations by Sex in Advance
Management, Business, Science and Arts Occupations
The most common Management, Business, Science and Arts occupations in Advance are Management (31 | 19.6%), Health Diagnosing & Treating (20 | 12.7%), Community & Social Service (16 | 10.1%), Health Technologists (16 | 10.1%), and Education Instruction & Library (13 | 8.2%).
Management, Business, Science and Arts Occupations by Sex
Within the Management, Business, Science and Arts occupations in Advance, the most male-oriented occupations are Business & Financial (100.0%), Computers, Engineering & Science (100.0%), and Computers & Mathematics (100.0%), while the most female-oriented occupations are Arts, Media & Entertainment (100.0%), Health Diagnosing & Treating (70.0%), and Community & Social Service (62.5%).
| Occupation | Male | Female |
| Management | 22 (71.0%) | 9 (29.0%) |
| Business & Financial | 5 (100.0%) | 0 (0.0%) |
| Computers, Engineering & Science | 4 (100.0%) | 0 (0.0%) |
| Computers & Mathematics | 4 (100.0%) | 0 (0.0%) |
| Architecture & Engineering | 0 (0.0%) | 0 (0.0%) |
| Life, Physical & Social Science | 0 (0.0%) | 0 (0.0%) |
| Community & Social Service | 6 (37.5%) | 10 (62.5%) |
| Education, Arts & Media | 0 (0.0%) | 0 (0.0%) |
| Legal Services & Support | 0 (0.0%) | 0 (0.0%) |
| Education Instruction & Library | 6 (46.2%) | 7 (53.8%) |
| Arts, Media & Entertainment | 0 (0.0%) | 3 (100.0%) |
| Health Diagnosing & Treating | 6 (30.0%) | 14 (70.0%) |
| Health Technologists | 6 (37.5%) | 10 (62.5%) |
| Total (Category) | 43 (56.6%) | 33 (43.4%) |
| Total (Overall) | 77 (48.7%) | 81 (51.3%) |
Services Occupations
The most common Services occupations in Advance are Healthcare Support (5 | 3.2%), and Personal Care & Service (2 | 1.3%).
Services Occupations by Sex
| Occupation | Male | Female |
| Healthcare Support | 5 (100.0%) | 0 (0.0%) |
| Security & Protection | 0 (0.0%) | 0 (0.0%) |
| Firefighting & Prevention | 0 (0.0%) | 0 (0.0%) |
| Law Enforcement | 0 (0.0%) | 0 (0.0%) |
| Food Preparation & Serving | 0 (0.0%) | 0 (0.0%) |
| Cleaning & Maintenance | 0 (0.0%) | 0 (0.0%) |
| Personal Care & Service | 0 (0.0%) | 2 (100.0%) |
| Total (Category) | 5 (71.4%) | 2 (28.6%) |
| Total (Overall) | 77 (48.7%) | 81 (51.3%) |
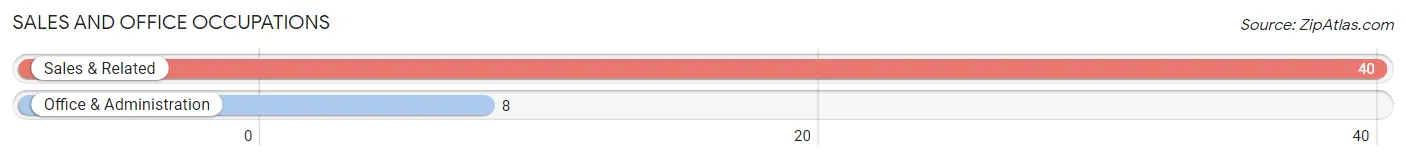
Sales and Office Occupations
The most common Sales and Office occupations in Advance are Sales & Related (40 | 25.3%), and Office & Administration (8 | 5.1%).
Sales and Office Occupations by Sex
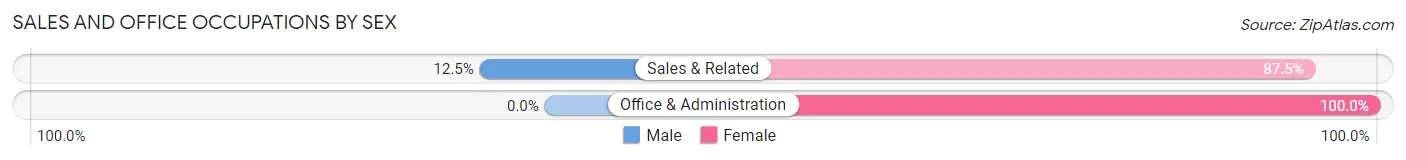
| Occupation | Male | Female |
| Sales & Related | 5 (12.5%) | 35 (87.5%) |
| Office & Administration | 0 (0.0%) | 8 (100.0%) |
| Total (Category) | 5 (10.4%) | 43 (89.6%) |
| Total (Overall) | 77 (48.7%) | 81 (51.3%) |
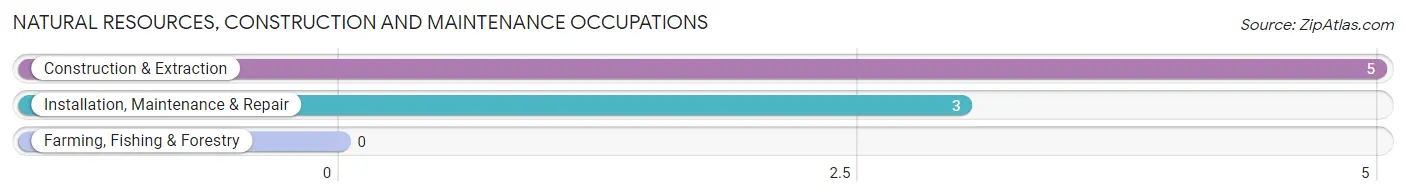
Natural Resources, Construction and Maintenance Occupations
The most common Natural Resources, Construction and Maintenance occupations in Advance are Construction & Extraction (5 | 3.2%), and Installation, Maintenance & Repair (3 | 1.9%).
Natural Resources, Construction and Maintenance Occupations by Sex
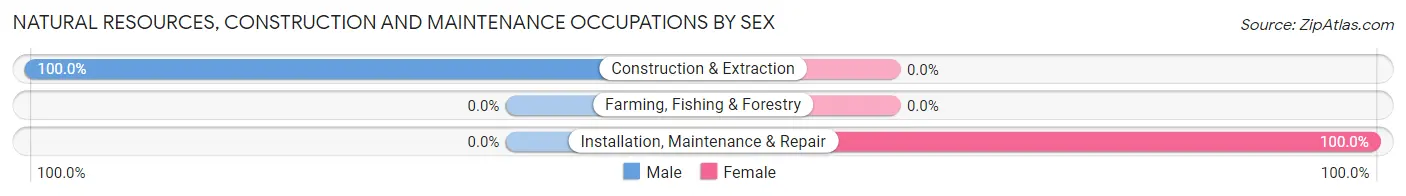
| Occupation | Male | Female |
| Farming, Fishing & Forestry | 0 (0.0%) | 0 (0.0%) |
| Construction & Extraction | 5 (100.0%) | 0 (0.0%) |
| Installation, Maintenance & Repair | 0 (0.0%) | 3 (100.0%) |
| Total (Category) | 5 (62.5%) | 3 (37.5%) |
| Total (Overall) | 77 (48.7%) | 81 (51.3%) |
Production, Transportation and Moving Occupations
The most common Production, Transportation and Moving occupations in Advance are Transportation (9 | 5.7%), Production (7 | 4.4%), and Material Moving (3 | 1.9%).
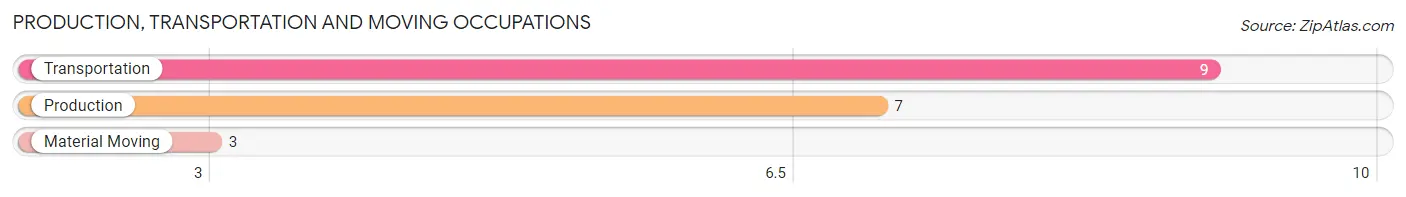
Production, Transportation and Moving Occupations by Sex
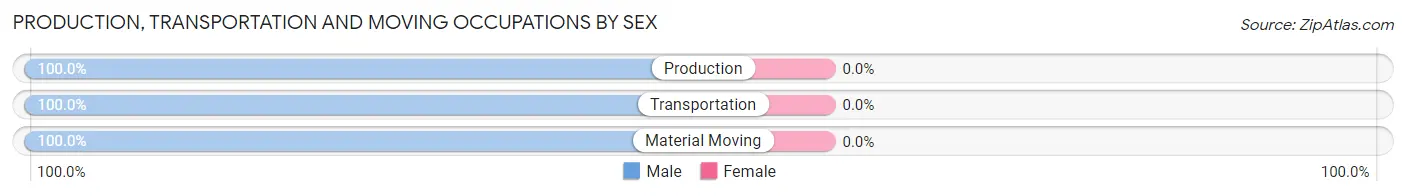
| Occupation | Male | Female |
| Production | 7 (100.0%) | 0 (0.0%) |
| Transportation | 9 (100.0%) | 0 (0.0%) |
| Material Moving | 3 (100.0%) | 0 (0.0%) |
| Total (Category) | 19 (100.0%) | 0 (0.0%) |
| Total (Overall) | 77 (48.7%) | 81 (51.3%) |
Employment Industries by Sex in Advance
Employment Industries in Advance
The major employment industries in Advance include Professional & Scientific (36 | 22.8%), Health Care & Social Assistance (23 | 14.6%), Manufacturing (22 | 13.9%), Educational Services (13 | 8.2%), and Accommodation & Food Services (13 | 8.2%).
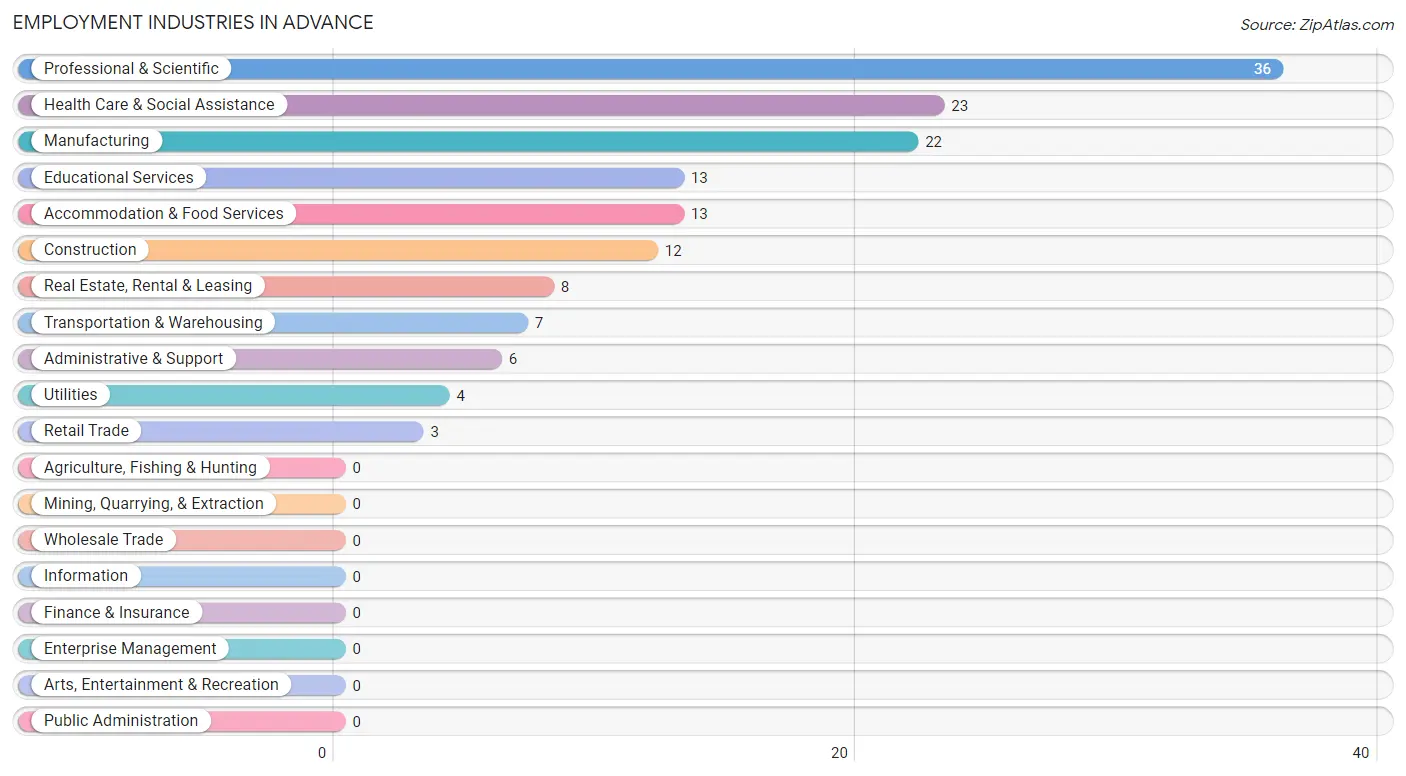
Employment Industries by Sex in Advance
The Advance industries that see more men than women are Construction (100.0%), Manufacturing (100.0%), and Transportation & Warehousing (100.0%), whereas the industries that tend to have a higher number of women are Retail Trade (100.0%), Real Estate, Rental & Leasing (100.0%), and Administrative & Support (100.0%).
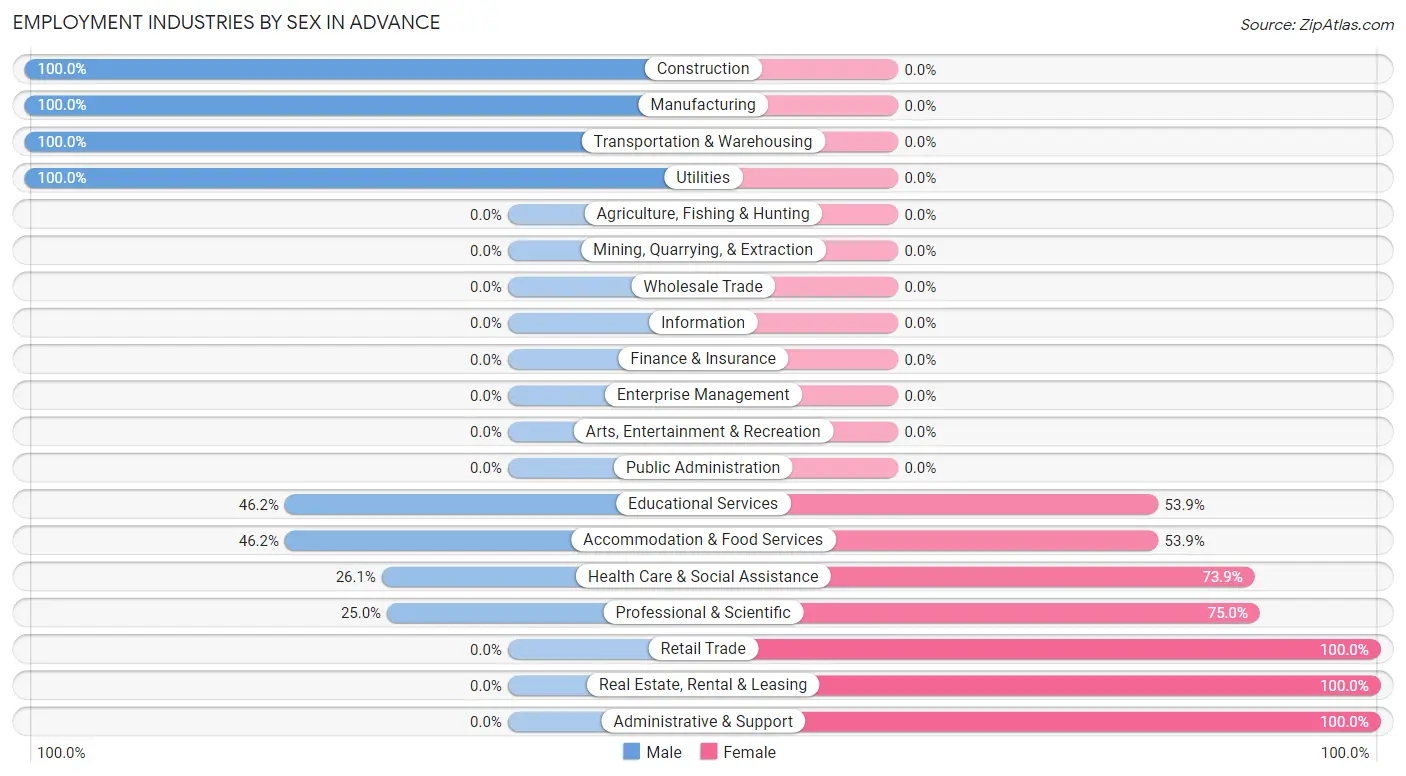
| Industry | Male | Female |
| Agriculture, Fishing & Hunting | 0 (0.0%) | 0 (0.0%) |
| Mining, Quarrying, & Extraction | 0 (0.0%) | 0 (0.0%) |
| Construction | 12 (100.0%) | 0 (0.0%) |
| Manufacturing | 22 (100.0%) | 0 (0.0%) |
| Wholesale Trade | 0 (0.0%) | 0 (0.0%) |
| Retail Trade | 0 (0.0%) | 3 (100.0%) |
| Transportation & Warehousing | 7 (100.0%) | 0 (0.0%) |
| Utilities | 4 (100.0%) | 0 (0.0%) |
| Information | 0 (0.0%) | 0 (0.0%) |
| Finance & Insurance | 0 (0.0%) | 0 (0.0%) |
| Real Estate, Rental & Leasing | 0 (0.0%) | 8 (100.0%) |
| Professional & Scientific | 9 (25.0%) | 27 (75.0%) |
| Enterprise Management | 0 (0.0%) | 0 (0.0%) |
| Administrative & Support | 0 (0.0%) | 6 (100.0%) |
| Educational Services | 6 (46.2%) | 7 (53.8%) |
| Health Care & Social Assistance | 6 (26.1%) | 17 (73.9%) |
| Arts, Entertainment & Recreation | 0 (0.0%) | 0 (0.0%) |
| Accommodation & Food Services | 6 (46.2%) | 7 (53.8%) |
| Public Administration | 0 (0.0%) | 0 (0.0%) |
| Total | 77 (48.7%) | 81 (51.3%) |
Education in Advance
School Enrollment in Advance
The most common levels of schooling among the 6 students in Advance are nursery / preschool (3 | 50.0%), and middle school (3 | 50.0%).
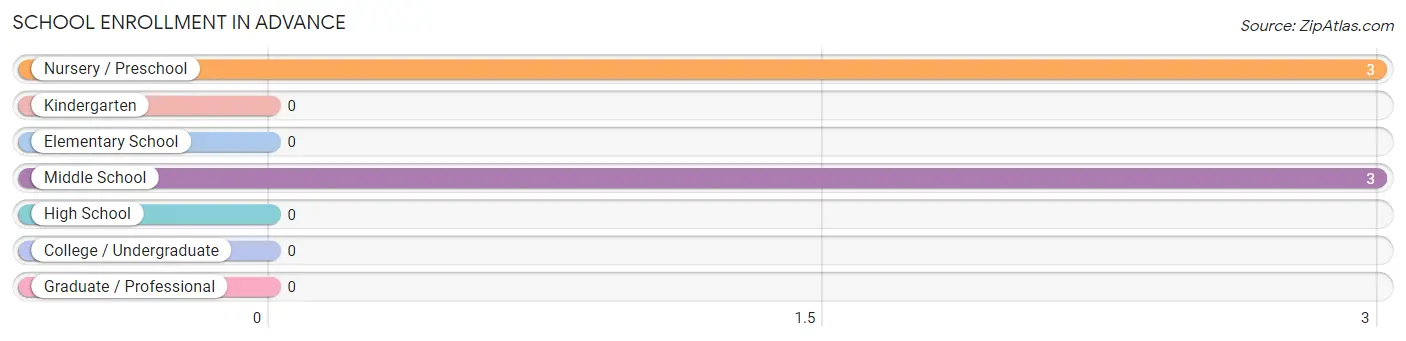
| School Level | # Students | % Students |
| Nursery / Preschool | 3 | 50.0% |
| Kindergarten | 0 | 0.0% |
| Elementary School | 0 | 0.0% |
| Middle School | 3 | 50.0% |
| High School | 0 | 0.0% |
| College / Undergraduate | 0 | 0.0% |
| Graduate / Professional | 0 | 0.0% |
| Total | 6 | 100.0% |
School Enrollment by Age by Funding Source in Advance
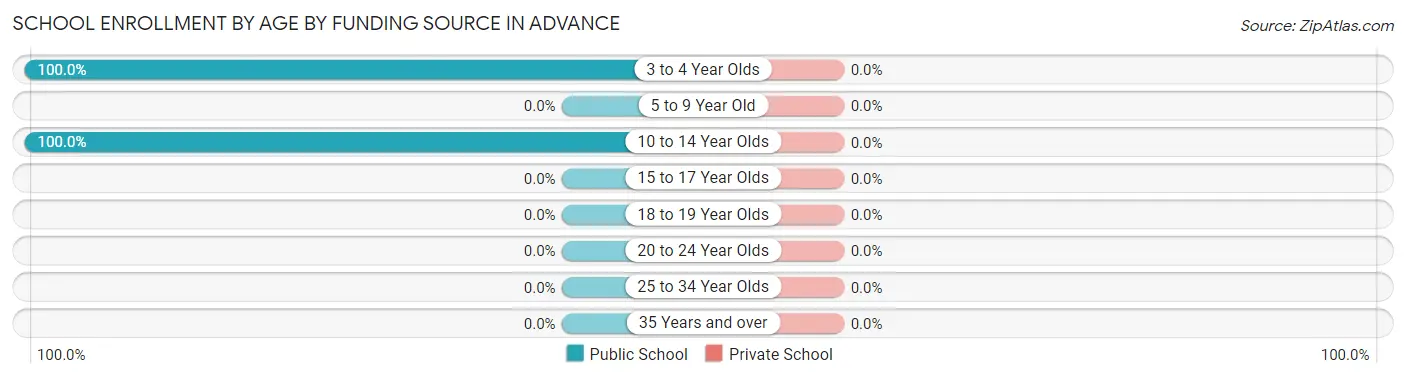
| Age Bracket | Public School | Private School |
| 3 to 4 Year Olds | 3 (100.0%) | 0 (0.0%) |
| 5 to 9 Year Old | 0 (0.0%) | 0 (0.0%) |
| 10 to 14 Year Olds | 3 (100.0%) | 0 (0.0%) |
| 15 to 17 Year Olds | 0 (0.0%) | 0 (0.0%) |
| 18 to 19 Year Olds | 0 (0.0%) | 0 (0.0%) |
| 20 to 24 Year Olds | 0 (0.0%) | 0 (0.0%) |
| 25 to 34 Year Olds | 0 (0.0%) | 0 (0.0%) |
| 35 Years and over | 0 (0.0%) | 0 (0.0%) |
| Total | 6 (100.0%) | 0 (0.0%) |
Educational Attainment by Field of Study in Advance
Business (76 | 40.0%), engineering (30 | 15.8%), education (29 | 15.3%), science & technology (15 | 7.9%), and arts & humanities (11 | 5.8%) are the most common fields of study among 190 individuals in Advance who have obtained a bachelor's degree or higher.
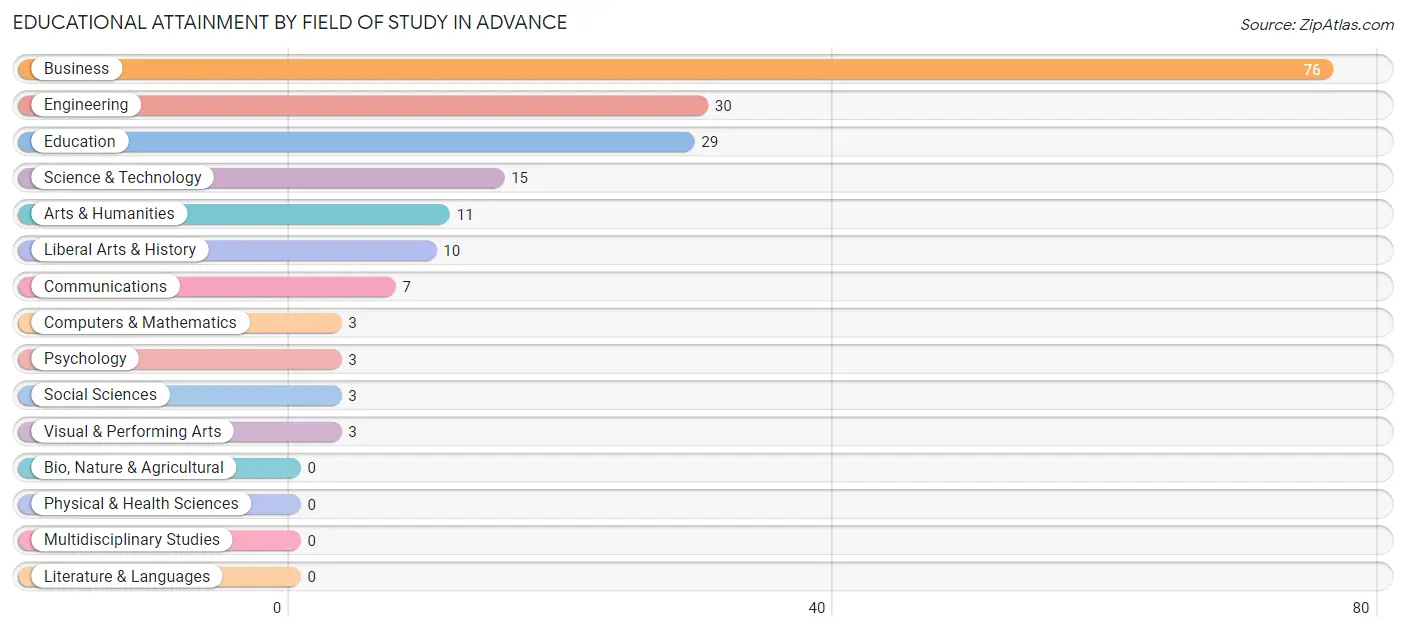
| Field of Study | # Graduates | % Graduates |
| Computers & Mathematics | 3 | 1.6% |
| Bio, Nature & Agricultural | 0 | 0.0% |
| Physical & Health Sciences | 0 | 0.0% |
| Psychology | 3 | 1.6% |
| Social Sciences | 3 | 1.6% |
| Engineering | 30 | 15.8% |
| Multidisciplinary Studies | 0 | 0.0% |
| Science & Technology | 15 | 7.9% |
| Business | 76 | 40.0% |
| Education | 29 | 15.3% |
| Literature & Languages | 0 | 0.0% |
| Liberal Arts & History | 10 | 5.3% |
| Visual & Performing Arts | 3 | 1.6% |
| Communications | 7 | 3.7% |
| Arts & Humanities | 11 | 5.8% |
| Total | 190 | 100.0% |
Transportation & Commute in Advance
Vehicle Availability by Sex in Advance
The most prevalent vehicle ownership categories in Advance are males with 2 vehicles (25, accounting for 32.5%) and females with 2 vehicles (25, making up 30.9%).
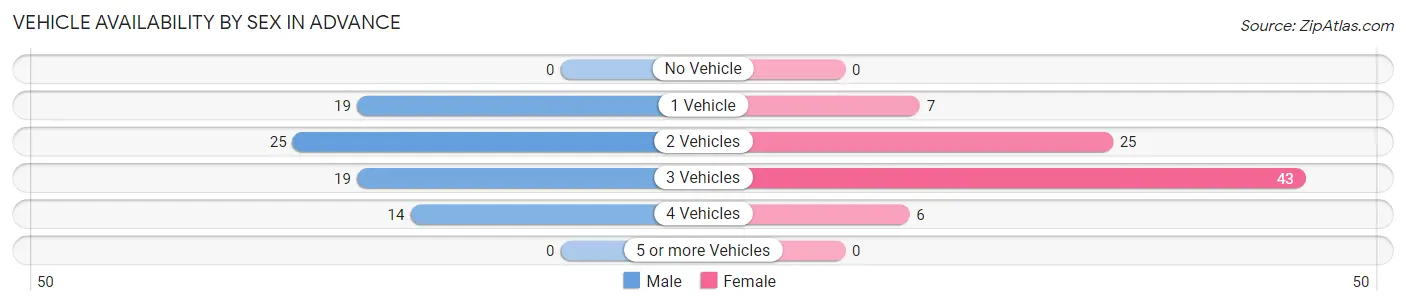
| Vehicles Available | Male | Female |
| No Vehicle | 0 (0.0%) | 0 (0.0%) |
| 1 Vehicle | 19 (24.7%) | 7 (8.6%) |
| 2 Vehicles | 25 (32.5%) | 25 (30.9%) |
| 3 Vehicles | 19 (24.7%) | 43 (53.1%) |
| 4 Vehicles | 14 (18.2%) | 6 (7.4%) |
| 5 or more Vehicles | 0 (0.0%) | 0 (0.0%) |
| Total | 77 (100.0%) | 81 (100.0%) |
Commute Time in Advance
The most frequently occuring commute durations in Advance are 15 to 19 minutes (49 commuters, 33.1%), 10 to 14 minutes (38 commuters, 25.7%), and 5 to 9 minutes (17 commuters, 11.5%).
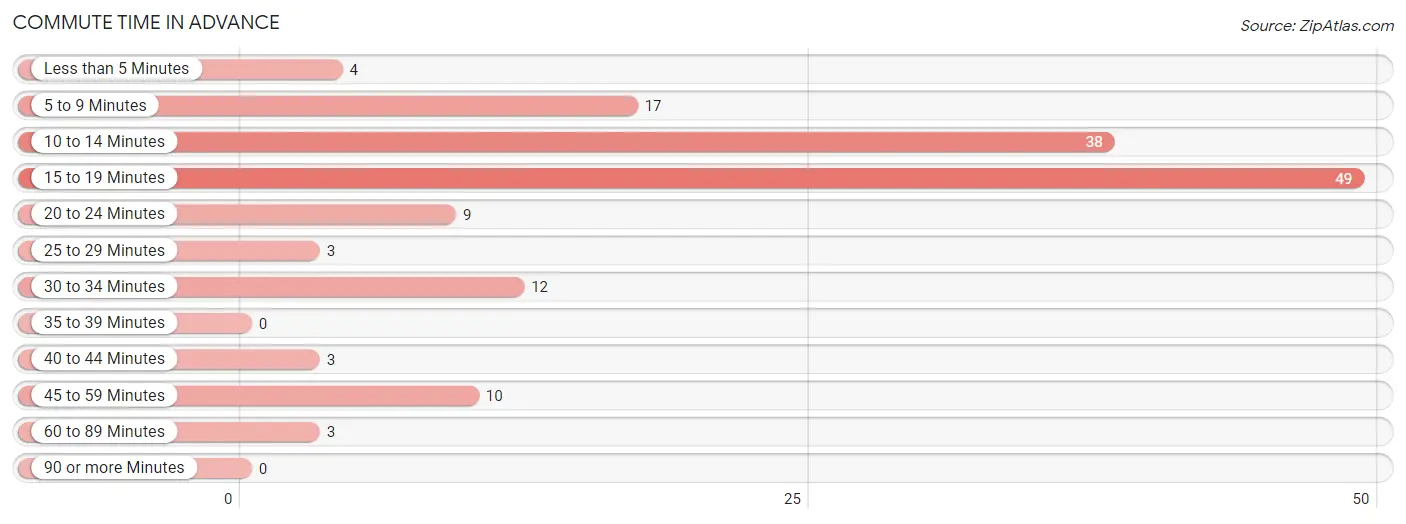
| Commute Time | # Commuters | % Commuters |
| Less than 5 Minutes | 4 | 2.7% |
| 5 to 9 Minutes | 17 | 11.5% |
| 10 to 14 Minutes | 38 | 25.7% |
| 15 to 19 Minutes | 49 | 33.1% |
| 20 to 24 Minutes | 9 | 6.1% |
| 25 to 29 Minutes | 3 | 2.0% |
| 30 to 34 Minutes | 12 | 8.1% |
| 35 to 39 Minutes | 0 | 0.0% |
| 40 to 44 Minutes | 3 | 2.0% |
| 45 to 59 Minutes | 10 | 6.8% |
| 60 to 89 Minutes | 3 | 2.0% |
| 90 or more Minutes | 0 | 0.0% |
Commute Time by Sex in Advance
The most common commute times in Advance are 10 to 14 minutes (24 commuters, 33.3%) for males and 15 to 19 minutes (34 commuters, 44.7%) for females.
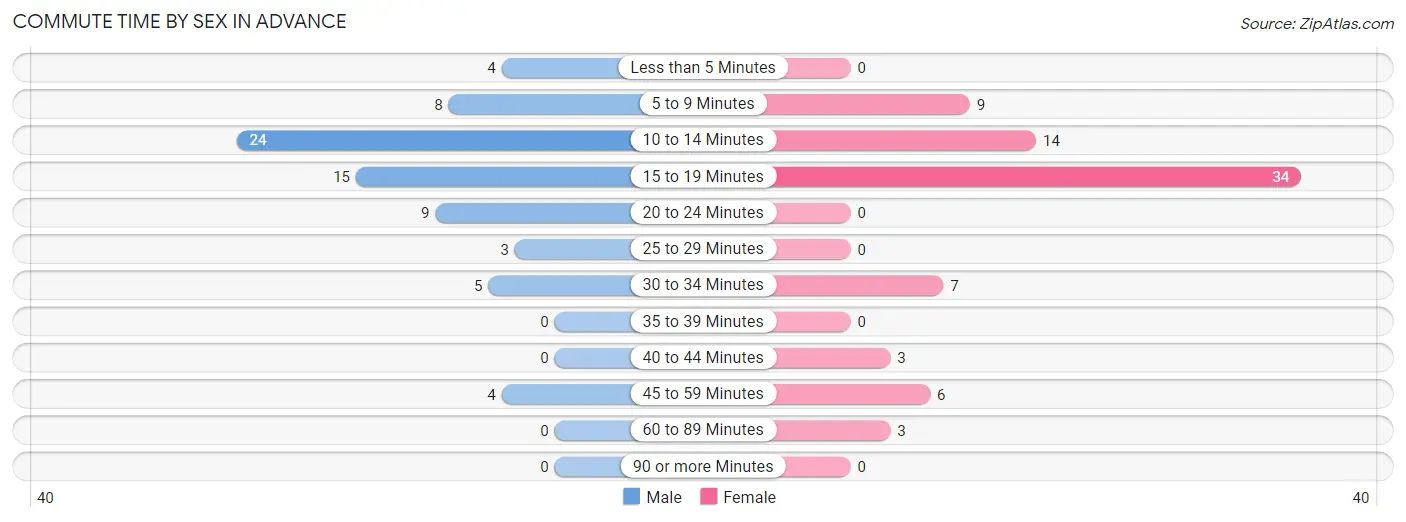
| Commute Time | Male | Female |
| Less than 5 Minutes | 4 (5.6%) | 0 (0.0%) |
| 5 to 9 Minutes | 8 (11.1%) | 9 (11.8%) |
| 10 to 14 Minutes | 24 (33.3%) | 14 (18.4%) |
| 15 to 19 Minutes | 15 (20.8%) | 34 (44.7%) |
| 20 to 24 Minutes | 9 (12.5%) | 0 (0.0%) |
| 25 to 29 Minutes | 3 (4.2%) | 0 (0.0%) |
| 30 to 34 Minutes | 5 (6.9%) | 7 (9.2%) |
| 35 to 39 Minutes | 0 (0.0%) | 0 (0.0%) |
| 40 to 44 Minutes | 0 (0.0%) | 3 (4.0%) |
| 45 to 59 Minutes | 4 (5.6%) | 6 (7.9%) |
| 60 to 89 Minutes | 0 (0.0%) | 3 (4.0%) |
| 90 or more Minutes | 0 (0.0%) | 0 (0.0%) |
Time of Departure to Work by Sex in Advance
The most frequent times of departure to work in Advance are 7:30 AM to 7:59 AM (24, 33.3%) for males and 12:00 AM to 4:59 AM (27, 35.5%) for females.
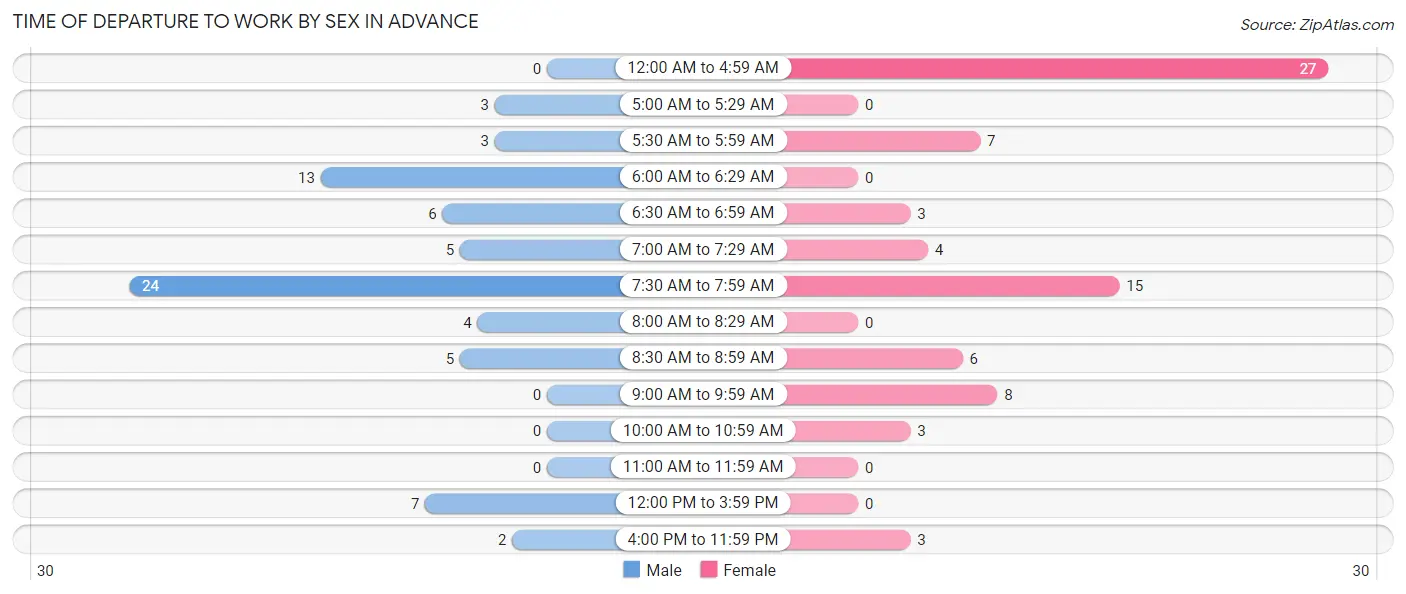
| Time of Departure | Male | Female |
| 12:00 AM to 4:59 AM | 0 (0.0%) | 27 (35.5%) |
| 5:00 AM to 5:29 AM | 3 (4.2%) | 0 (0.0%) |
| 5:30 AM to 5:59 AM | 3 (4.2%) | 7 (9.2%) |
| 6:00 AM to 6:29 AM | 13 (18.1%) | 0 (0.0%) |
| 6:30 AM to 6:59 AM | 6 (8.3%) | 3 (4.0%) |
| 7:00 AM to 7:29 AM | 5 (6.9%) | 4 (5.3%) |
| 7:30 AM to 7:59 AM | 24 (33.3%) | 15 (19.7%) |
| 8:00 AM to 8:29 AM | 4 (5.6%) | 0 (0.0%) |
| 8:30 AM to 8:59 AM | 5 (6.9%) | 6 (7.9%) |
| 9:00 AM to 9:59 AM | 0 (0.0%) | 8 (10.5%) |
| 10:00 AM to 10:59 AM | 0 (0.0%) | 3 (4.0%) |
| 11:00 AM to 11:59 AM | 0 (0.0%) | 0 (0.0%) |
| 12:00 PM to 3:59 PM | 7 (9.7%) | 0 (0.0%) |
| 4:00 PM to 11:59 PM | 2 (2.8%) | 3 (4.0%) |
| Total | 72 (100.0%) | 76 (100.0%) |
Housing Occupancy in Advance
Occupancy by Ownership in Advance
Of the total 194 dwellings in Advance, owner-occupied units account for 185 (95.4%), while renter-occupied units make up 9 (4.6%).
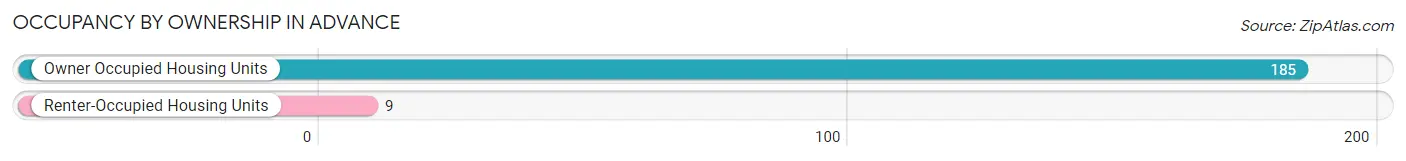
| Occupancy | # Housing Units | % Housing Units |
| Owner Occupied Housing Units | 185 | 95.4% |
| Renter-Occupied Housing Units | 9 | 4.6% |
| Total Occupied Housing Units | 194 | 100.0% |
Occupancy by Household Size in Advance
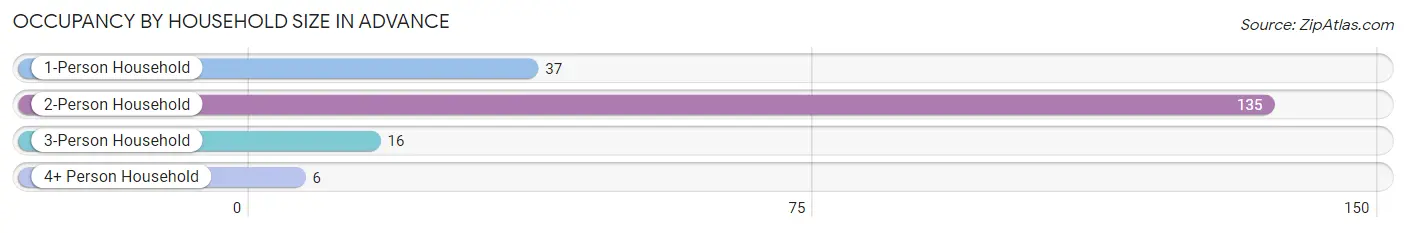
| Household Size | # Housing Units | % Housing Units |
| 1-Person Household | 37 | 19.1% |
| 2-Person Household | 135 | 69.6% |
| 3-Person Household | 16 | 8.3% |
| 4+ Person Household | 6 | 3.1% |
| Total Housing Units | 194 | 100.0% |
Occupancy by Ownership by Household Size in Advance
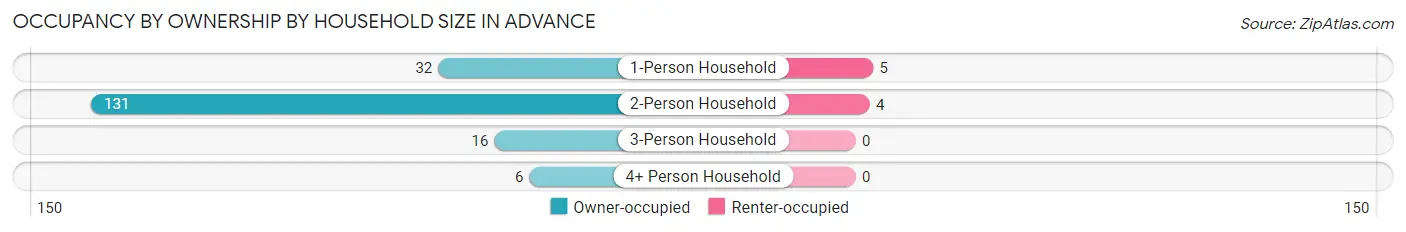
| Household Size | Owner-occupied | Renter-occupied |
| 1-Person Household | 32 (86.5%) | 5 (13.5%) |
| 2-Person Household | 131 (97.0%) | 4 (3.0%) |
| 3-Person Household | 16 (100.0%) | 0 (0.0%) |
| 4+ Person Household | 6 (100.0%) | 0 (0.0%) |
| Total Housing Units | 185 (95.4%) | 9 (4.6%) |
Occupancy by Educational Attainment in Advance
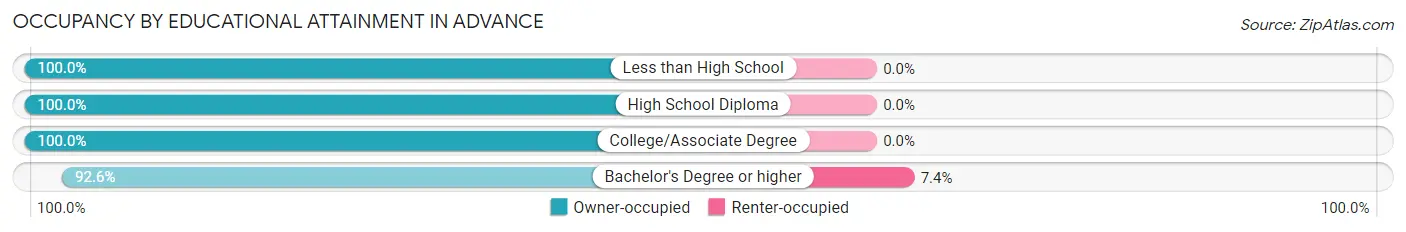
| Household Size | Owner-occupied | Renter-occupied |
| Less than High School | 8 (100.0%) | 0 (0.0%) |
| High School Diploma | 14 (100.0%) | 0 (0.0%) |
| College/Associate Degree | 51 (100.0%) | 0 (0.0%) |
| Bachelor's Degree or higher | 112 (92.6%) | 9 (7.4%) |
Occupancy by Age of Householder in Advance
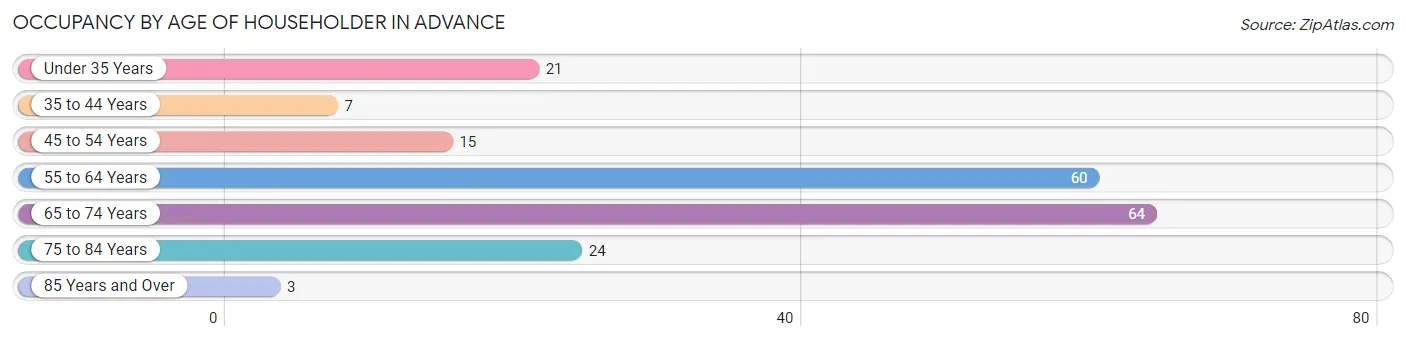
| Age Bracket | # Households | % Households |
| Under 35 Years | 21 | 10.8% |
| 35 to 44 Years | 7 | 3.6% |
| 45 to 54 Years | 15 | 7.7% |
| 55 to 64 Years | 60 | 30.9% |
| 65 to 74 Years | 64 | 33.0% |
| 75 to 84 Years | 24 | 12.4% |
| 85 Years and Over | 3 | 1.5% |
| Total | 194 | 100.0% |
Housing Finances in Advance
Median Income by Occupancy in Advance
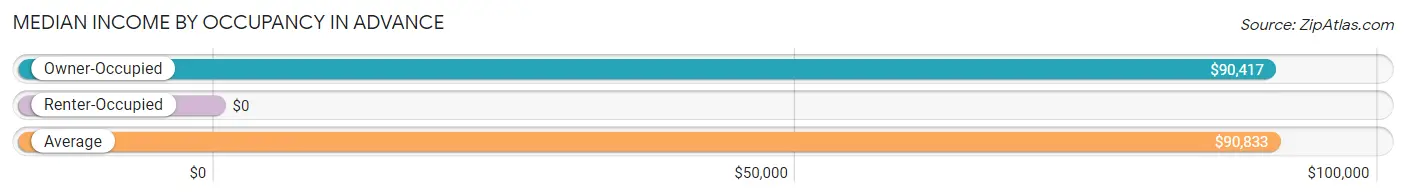
| Occupancy Type | # Households | Median Income |
| Owner-Occupied | 185 (95.4%) | $90,417 |
| Renter-Occupied | 9 (4.6%) | $0 |
| Average | 194 (100.0%) | $90,833 |
Occupancy by Householder Income Bracket in Advance
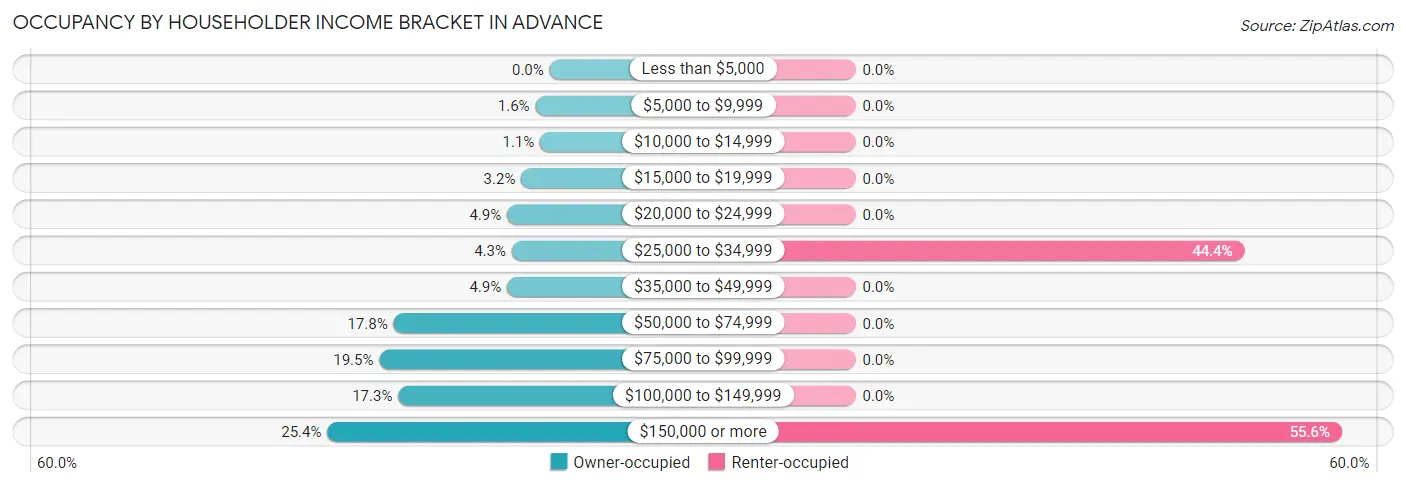
| Income Bracket | Owner-occupied | Renter-occupied |
| Less than $5,000 | 0 (0.0%) | 0 (0.0%) |
| $5,000 to $9,999 | 3 (1.6%) | 0 (0.0%) |
| $10,000 to $14,999 | 2 (1.1%) | 0 (0.0%) |
| $15,000 to $19,999 | 6 (3.2%) | 0 (0.0%) |
| $20,000 to $24,999 | 9 (4.9%) | 0 (0.0%) |
| $25,000 to $34,999 | 8 (4.3%) | 4 (44.4%) |
| $35,000 to $49,999 | 9 (4.9%) | 0 (0.0%) |
| $50,000 to $74,999 | 33 (17.8%) | 0 (0.0%) |
| $75,000 to $99,999 | 36 (19.5%) | 0 (0.0%) |
| $100,000 to $149,999 | 32 (17.3%) | 0 (0.0%) |
| $150,000 or more | 47 (25.4%) | 5 (55.6%) |
| Total | 185 (100.0%) | 9 (100.0%) |
Monthly Housing Cost Tiers in Advance
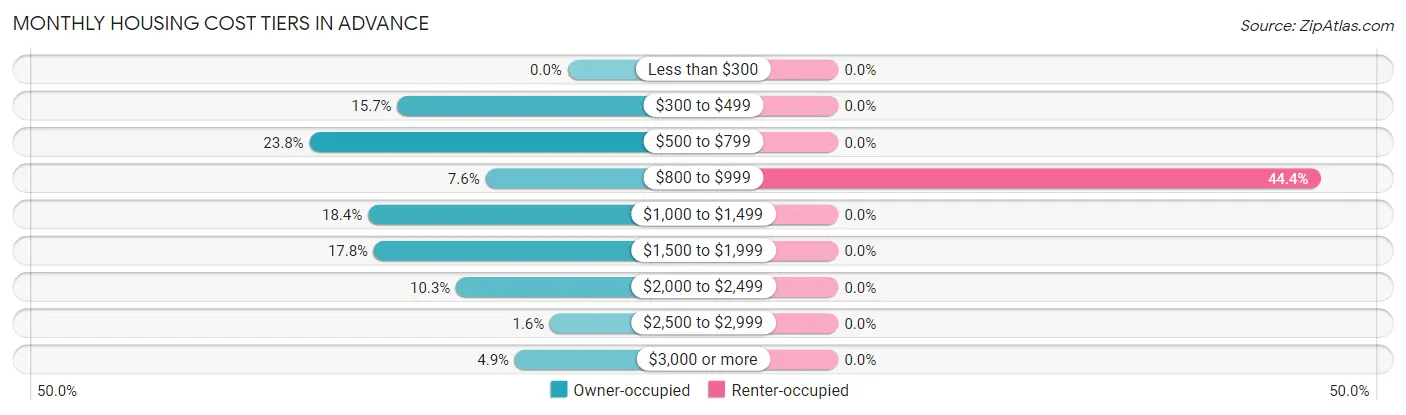
| Monthly Cost | Owner-occupied | Renter-occupied |
| Less than $300 | 0 (0.0%) | 0 (0.0%) |
| $300 to $499 | 29 (15.7%) | 0 (0.0%) |
| $500 to $799 | 44 (23.8%) | 0 (0.0%) |
| $800 to $999 | 14 (7.6%) | 4 (44.4%) |
| $1,000 to $1,499 | 34 (18.4%) | 0 (0.0%) |
| $1,500 to $1,999 | 33 (17.8%) | 0 (0.0%) |
| $2,000 to $2,499 | 19 (10.3%) | 0 (0.0%) |
| $2,500 to $2,999 | 3 (1.6%) | 0 (0.0%) |
| $3,000 or more | 9 (4.9%) | 0 (0.0%) |
| Total | 185 (100.0%) | 9 (100.0%) |
Physical Housing Characteristics in Advance
Housing Structures in Advance
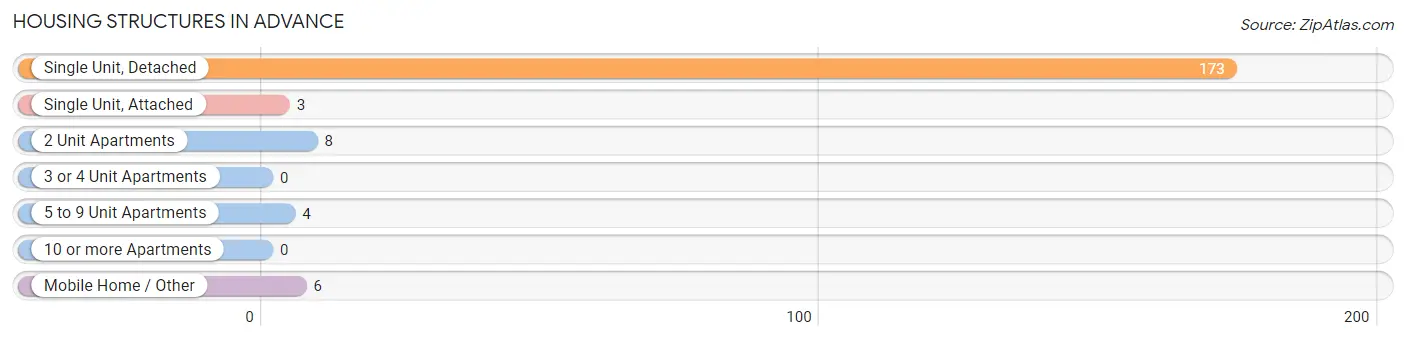
| Structure Type | # Housing Units | % Housing Units |
| Single Unit, Detached | 173 | 89.2% |
| Single Unit, Attached | 3 | 1.5% |
| 2 Unit Apartments | 8 | 4.1% |
| 3 or 4 Unit Apartments | 0 | 0.0% |
| 5 to 9 Unit Apartments | 4 | 2.1% |
| 10 or more Apartments | 0 | 0.0% |
| Mobile Home / Other | 6 | 3.1% |
| Total | 194 | 100.0% |
Housing Structures by Occupancy in Advance
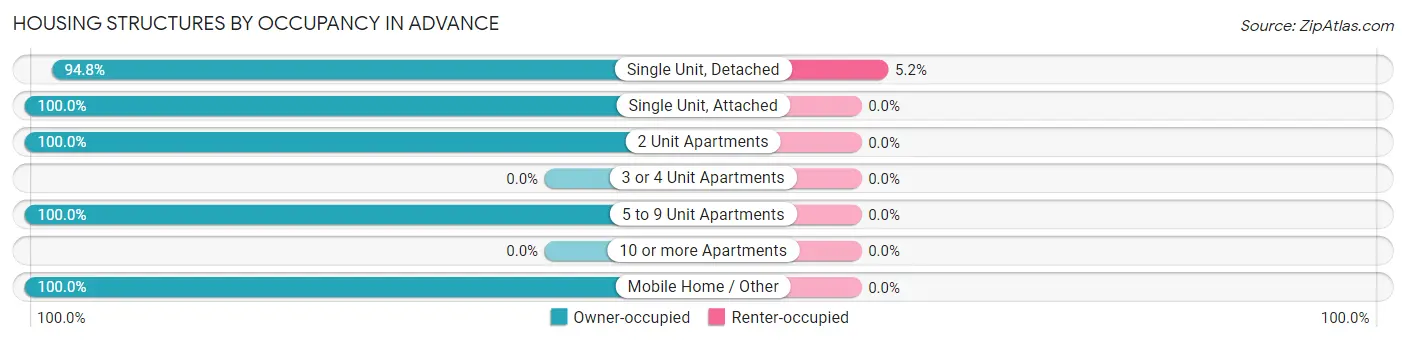
| Structure Type | Owner-occupied | Renter-occupied |
| Single Unit, Detached | 164 (94.8%) | 9 (5.2%) |
| Single Unit, Attached | 3 (100.0%) | 0 (0.0%) |
| 2 Unit Apartments | 8 (100.0%) | 0 (0.0%) |
| 3 or 4 Unit Apartments | 0 (0.0%) | 0 (0.0%) |
| 5 to 9 Unit Apartments | 4 (100.0%) | 0 (0.0%) |
| 10 or more Apartments | 0 (0.0%) | 0 (0.0%) |
| Mobile Home / Other | 6 (100.0%) | 0 (0.0%) |
| Total | 185 (95.4%) | 9 (4.6%) |
Housing Structures by Number of Rooms in Advance
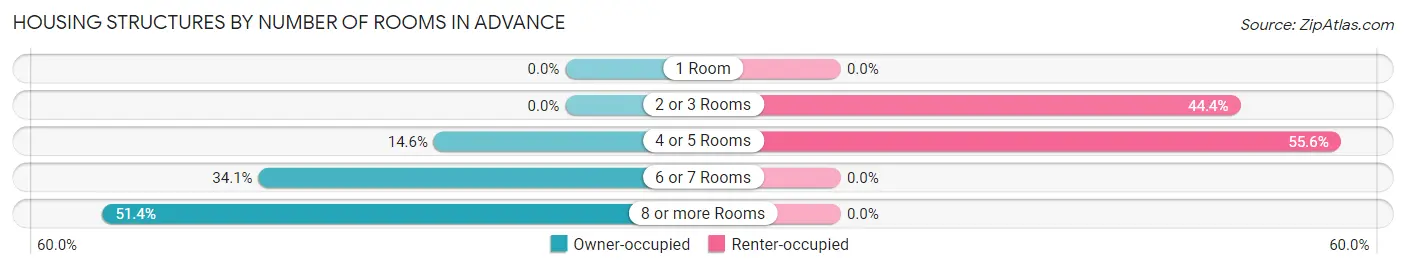
| Number of Rooms | Owner-occupied | Renter-occupied |
| 1 Room | 0 (0.0%) | 0 (0.0%) |
| 2 or 3 Rooms | 0 (0.0%) | 4 (44.4%) |
| 4 or 5 Rooms | 27 (14.6%) | 5 (55.6%) |
| 6 or 7 Rooms | 63 (34.1%) | 0 (0.0%) |
| 8 or more Rooms | 95 (51.3%) | 0 (0.0%) |
| Total | 185 (100.0%) | 9 (100.0%) |
Housing Structure by Heating Type in Advance
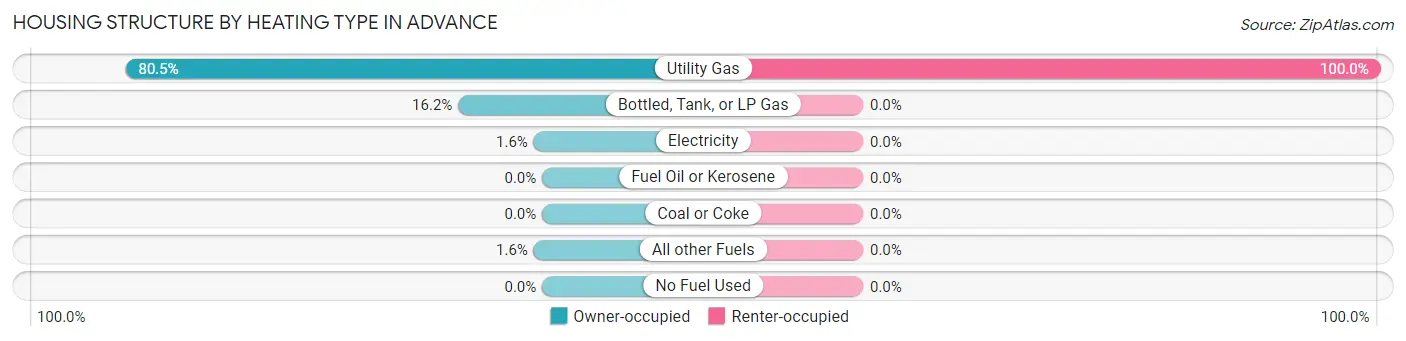
| Heating Type | Owner-occupied | Renter-occupied |
| Utility Gas | 149 (80.5%) | 9 (100.0%) |
| Bottled, Tank, or LP Gas | 30 (16.2%) | 0 (0.0%) |
| Electricity | 3 (1.6%) | 0 (0.0%) |
| Fuel Oil or Kerosene | 0 (0.0%) | 0 (0.0%) |
| Coal or Coke | 0 (0.0%) | 0 (0.0%) |
| All other Fuels | 3 (1.6%) | 0 (0.0%) |
| No Fuel Used | 0 (0.0%) | 0 (0.0%) |
| Total | 185 (100.0%) | 9 (100.0%) |
Household Vehicle Usage in Advance
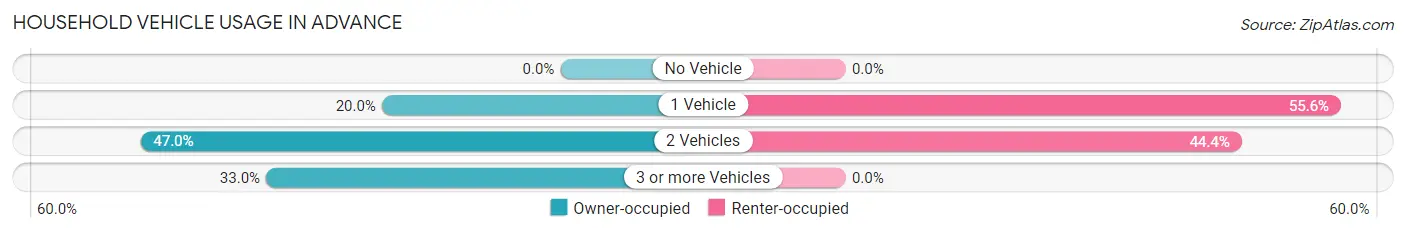
| Vehicles per Household | Owner-occupied | Renter-occupied |
| No Vehicle | 0 (0.0%) | 0 (0.0%) |
| 1 Vehicle | 37 (20.0%) | 5 (55.6%) |
| 2 Vehicles | 87 (47.0%) | 4 (44.4%) |
| 3 or more Vehicles | 61 (33.0%) | 0 (0.0%) |
| Total | 185 (100.0%) | 9 (100.0%) |
Real Estate & Mortgages in Advance
Real Estate and Mortgage Overview in Advance
| Characteristic | Without Mortgage | With Mortgage |
| Housing Units | 95 | 90 |
| Median Property Value | $564,400 | $514,300 |
| Median Household Income | $77,917 | $34 |
| Monthly Housing Costs | $588 | $9 |
| Real Estate Taxes | $3,271 | $0 |
Property Value by Mortgage Status in Advance
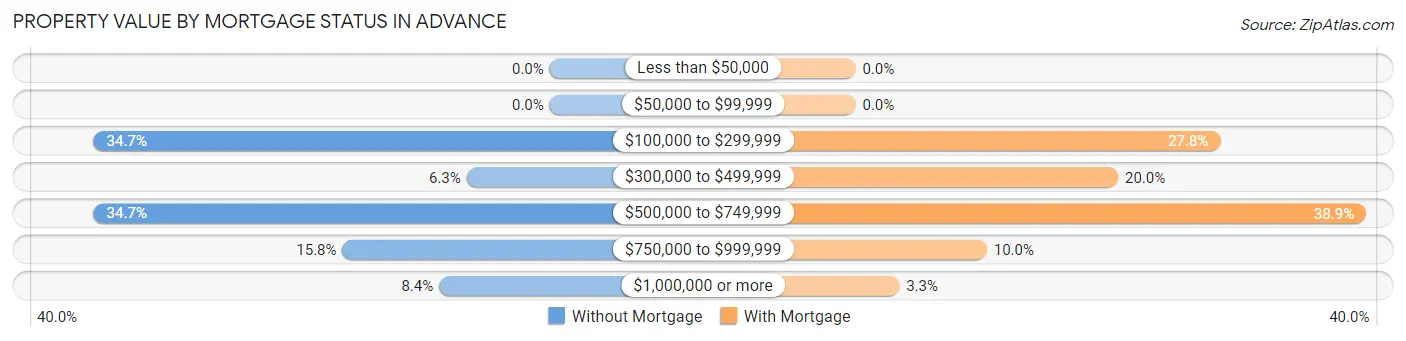
| Property Value | Without Mortgage | With Mortgage |
| Less than $50,000 | 0 (0.0%) | 0 (0.0%) |
| $50,000 to $99,999 | 0 (0.0%) | 0 (0.0%) |
| $100,000 to $299,999 | 33 (34.7%) | 25 (27.8%) |
| $300,000 to $499,999 | 6 (6.3%) | 18 (20.0%) |
| $500,000 to $749,999 | 33 (34.7%) | 35 (38.9%) |
| $750,000 to $999,999 | 15 (15.8%) | 9 (10.0%) |
| $1,000,000 or more | 8 (8.4%) | 3 (3.3%) |
| Total | 95 (100.0%) | 90 (100.0%) |
Household Income by Mortgage Status in Advance
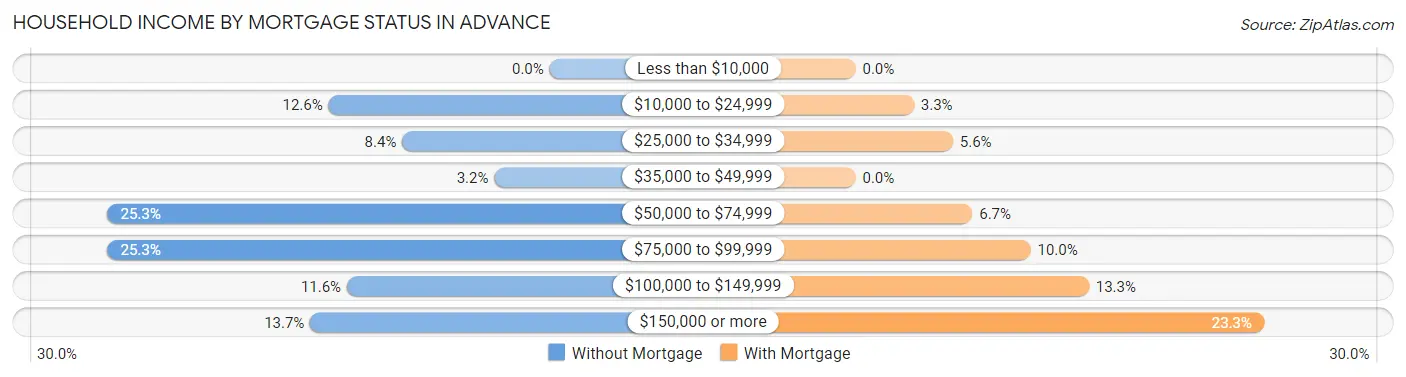
| Household Income | Without Mortgage | With Mortgage |
| Less than $10,000 | 0 (0.0%) | 0 (0.0%) |
| $10,000 to $24,999 | 12 (12.6%) | 3 (3.3%) |
| $25,000 to $34,999 | 8 (8.4%) | 5 (5.6%) |
| $35,000 to $49,999 | 3 (3.2%) | 0 (0.0%) |
| $50,000 to $74,999 | 24 (25.3%) | 6 (6.7%) |
| $75,000 to $99,999 | 24 (25.3%) | 9 (10.0%) |
| $100,000 to $149,999 | 11 (11.6%) | 12 (13.3%) |
| $150,000 or more | 13 (13.7%) | 21 (23.3%) |
| Total | 95 (100.0%) | 90 (100.0%) |
Property Value to Household Income Ratio in Advance
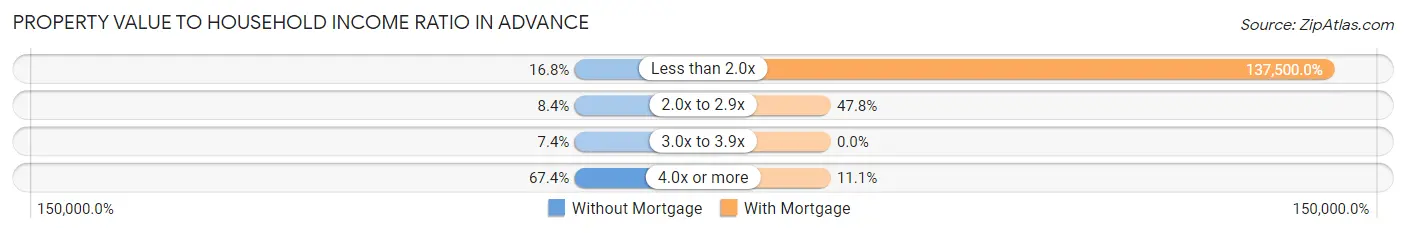
| Value-to-Income Ratio | Without Mortgage | With Mortgage |
| Less than 2.0x | 16 (16.8%) | 123,750 (137,500.0%) |
| 2.0x to 2.9x | 8 (8.4%) | 43 (47.8%) |
| 3.0x to 3.9x | 7 (7.4%) | 0 (0.0%) |
| 4.0x or more | 64 (67.4%) | 10 (11.1%) |
| Total | 95 (100.0%) | 90 (100.0%) |
Real Estate Taxes by Mortgage Status in Advance
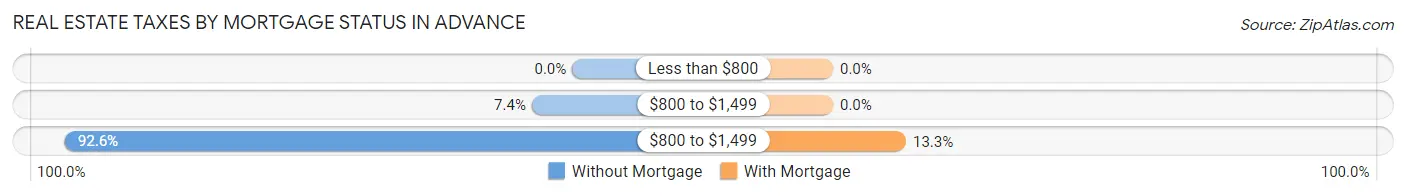
| Property Taxes | Without Mortgage | With Mortgage |
| Less than $800 | 0 (0.0%) | 0 (0.0%) |
| $800 to $1,499 | 7 (7.4%) | 0 (0.0%) |
| $800 to $1,499 | 88 (92.6%) | 12 (13.3%) |
| Total | 95 (100.0%) | 90 (100.0%) |
Health & Disability in Advance
Health Insurance Coverage by Age in Advance
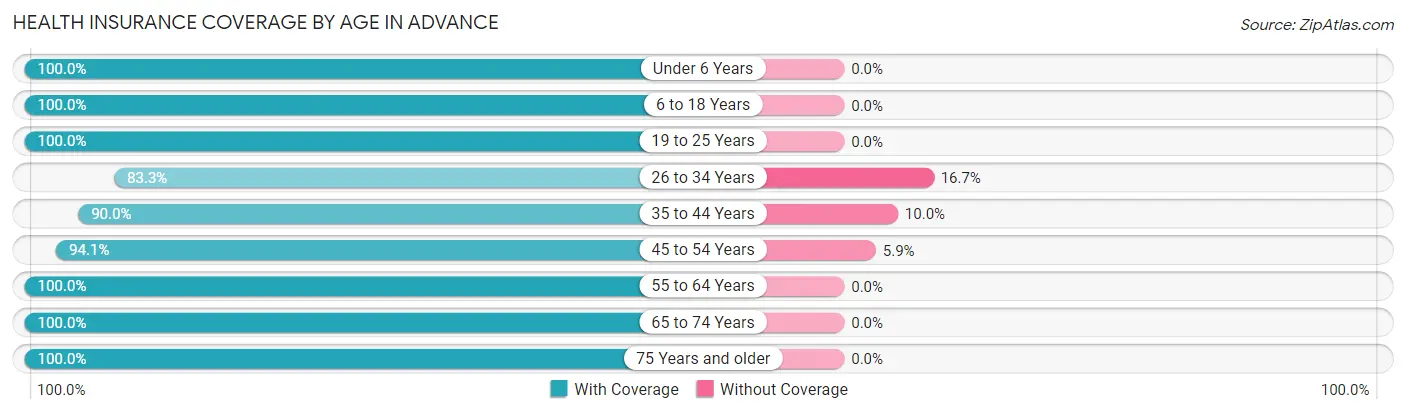
| Age Bracket | With Coverage | Without Coverage |
| Under 6 Years | 9 (100.0%) | 0 (0.0%) |
| 6 to 18 Years | 3 (100.0%) | 0 (0.0%) |
| 19 to 25 Years | 23 (100.0%) | 0 (0.0%) |
| 26 to 34 Years | 20 (83.3%) | 4 (16.7%) |
| 35 to 44 Years | 9 (90.0%) | 1 (10.0%) |
| 45 to 54 Years | 32 (94.1%) | 2 (5.9%) |
| 55 to 64 Years | 126 (100.0%) | 0 (0.0%) |
| 65 to 74 Years | 97 (100.0%) | 0 (0.0%) |
| 75 Years and older | 45 (100.0%) | 0 (0.0%) |
| Total | 364 (98.1%) | 7 (1.9%) |
Health Insurance Coverage by Citizenship Status in Advance
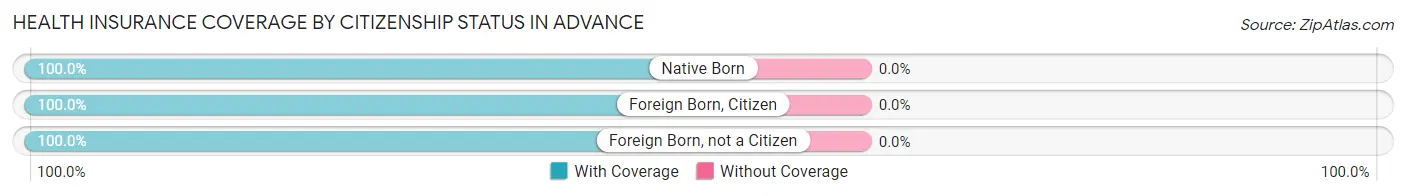
| Citizenship Status | With Coverage | Without Coverage |
| Native Born | 9 (100.0%) | 0 (0.0%) |
| Foreign Born, Citizen | 3 (100.0%) | 0 (0.0%) |
| Foreign Born, not a Citizen | 23 (100.0%) | 0 (0.0%) |
Health Insurance Coverage by Household Income in Advance
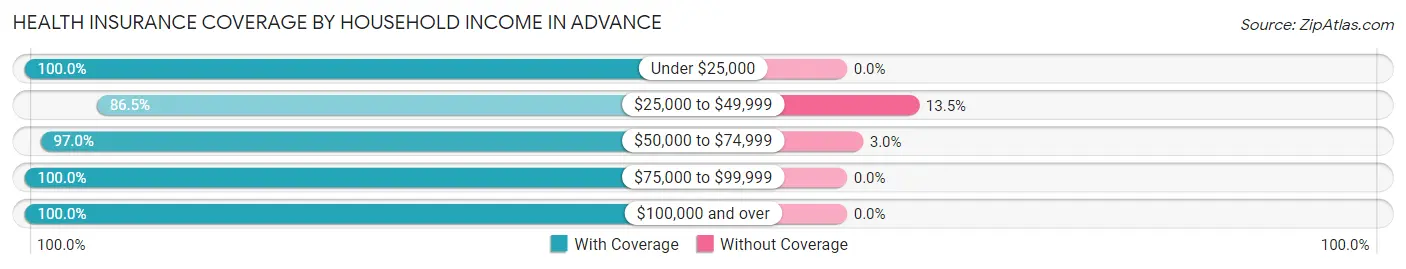
| Household Income | With Coverage | Without Coverage |
| Under $25,000 | 31 (100.0%) | 0 (0.0%) |
| $25,000 to $49,999 | 32 (86.5%) | 5 (13.5%) |
| $50,000 to $74,999 | 65 (97.0%) | 2 (3.0%) |
| $75,000 to $99,999 | 58 (100.0%) | 0 (0.0%) |
| $100,000 and over | 178 (100.0%) | 0 (0.0%) |
Public vs Private Health Insurance Coverage by Age in Advance
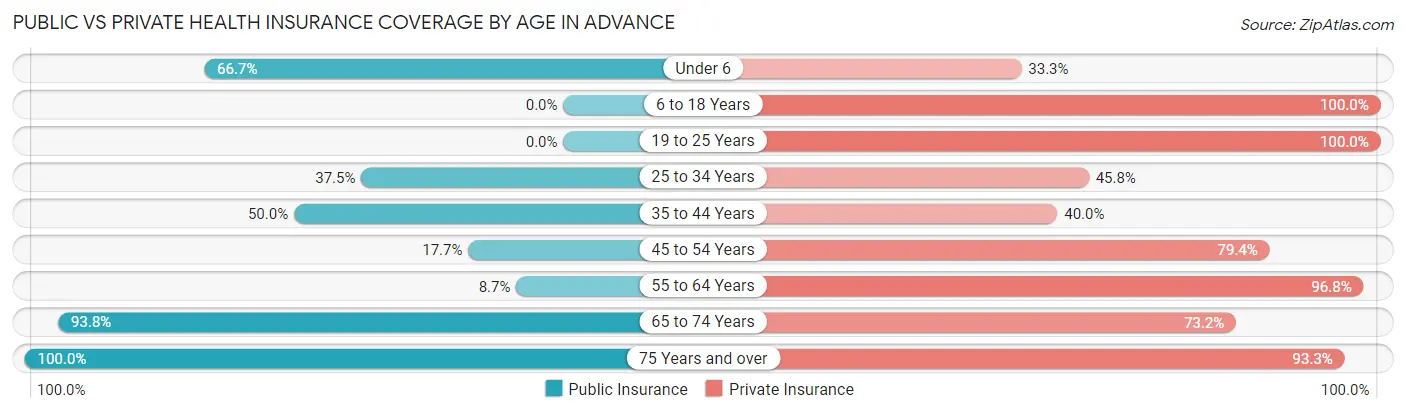
| Age Bracket | Public Insurance | Private Insurance |
| Under 6 | 6 (66.7%) | 3 (33.3%) |
| 6 to 18 Years | 0 (0.0%) | 3 (100.0%) |
| 19 to 25 Years | 0 (0.0%) | 23 (100.0%) |
| 25 to 34 Years | 9 (37.5%) | 11 (45.8%) |
| 35 to 44 Years | 5 (50.0%) | 4 (40.0%) |
| 45 to 54 Years | 6 (17.6%) | 27 (79.4%) |
| 55 to 64 Years | 11 (8.7%) | 122 (96.8%) |
| 65 to 74 Years | 91 (93.8%) | 71 (73.2%) |
| 75 Years and over | 45 (100.0%) | 42 (93.3%) |
| Total | 173 (46.6%) | 306 (82.5%) |
Disability Status by Sex by Age in Advance
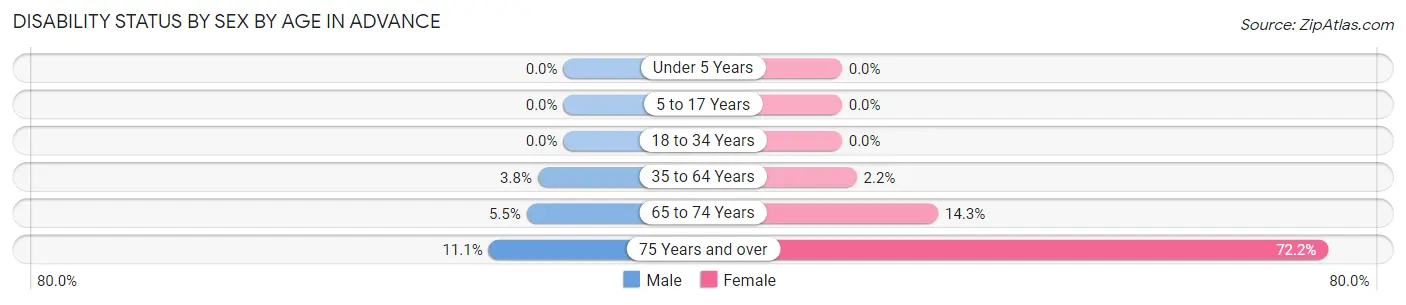
| Age Bracket | Male | Female |
| Under 5 Years | 0 (0.0%) | 0 (0.0%) |
| 5 to 17 Years | 0 (0.0%) | 0 (0.0%) |
| 18 to 34 Years | 0 (0.0%) | 0 (0.0%) |
| 35 to 64 Years | 3 (3.8%) | 2 (2.2%) |
| 65 to 74 Years | 3 (5.4%) | 6 (14.3%) |
| 75 Years and over | 3 (11.1%) | 13 (72.2%) |
Disability Class by Sex by Age in Advance
Disability Class: Hearing Difficulty
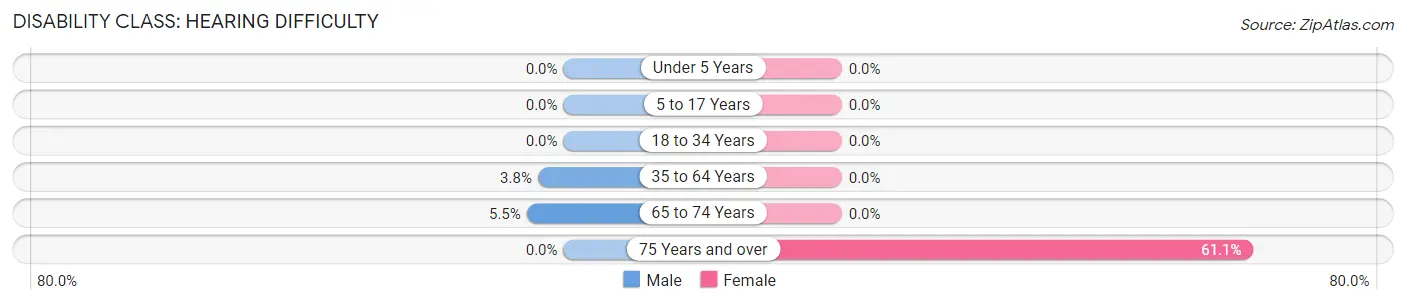
| Age Bracket | Male | Female |
| Under 5 Years | 0 (0.0%) | 0 (0.0%) |
| 5 to 17 Years | 0 (0.0%) | 0 (0.0%) |
| 18 to 34 Years | 0 (0.0%) | 0 (0.0%) |
| 35 to 64 Years | 3 (3.8%) | 0 (0.0%) |
| 65 to 74 Years | 3 (5.4%) | 0 (0.0%) |
| 75 Years and over | 0 (0.0%) | 11 (61.1%) |
Disability Class: Vision Difficulty
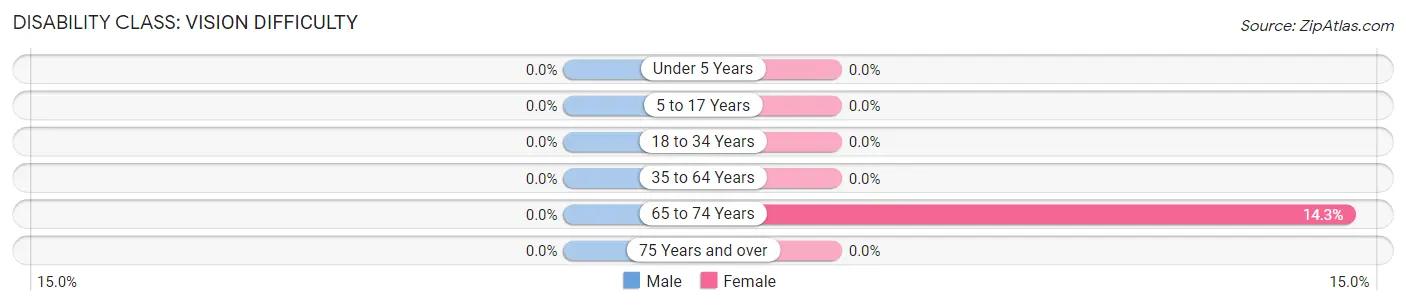
| Age Bracket | Male | Female |
| Under 5 Years | 0 (0.0%) | 0 (0.0%) |
| 5 to 17 Years | 0 (0.0%) | 0 (0.0%) |
| 18 to 34 Years | 0 (0.0%) | 0 (0.0%) |
| 35 to 64 Years | 0 (0.0%) | 0 (0.0%) |
| 65 to 74 Years | 0 (0.0%) | 6 (14.3%) |
| 75 Years and over | 0 (0.0%) | 0 (0.0%) |
Disability Class: Cognitive Difficulty

| Age Bracket | Male | Female |
| 5 to 17 Years | 0 (0.0%) | 0 (0.0%) |
| 18 to 34 Years | 0 (0.0%) | 0 (0.0%) |
| 35 to 64 Years | 0 (0.0%) | 2 (2.2%) |
| 65 to 74 Years | 0 (0.0%) | 0 (0.0%) |
| 75 Years and over | 0 (0.0%) | 3 (16.7%) |
Disability Class: Ambulatory Difficulty
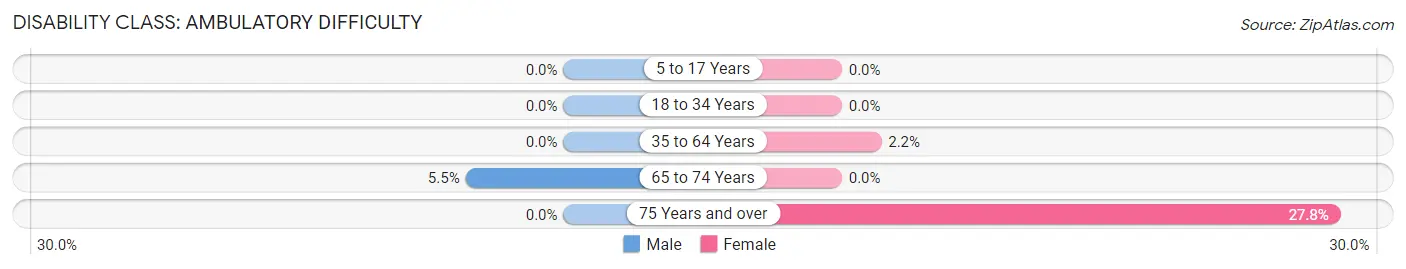
| Age Bracket | Male | Female |
| 5 to 17 Years | 0 (0.0%) | 0 (0.0%) |
| 18 to 34 Years | 0 (0.0%) | 0 (0.0%) |
| 35 to 64 Years | 0 (0.0%) | 2 (2.2%) |
| 65 to 74 Years | 3 (5.4%) | 0 (0.0%) |
| 75 Years and over | 0 (0.0%) | 5 (27.8%) |
Disability Class: Self-Care Difficulty
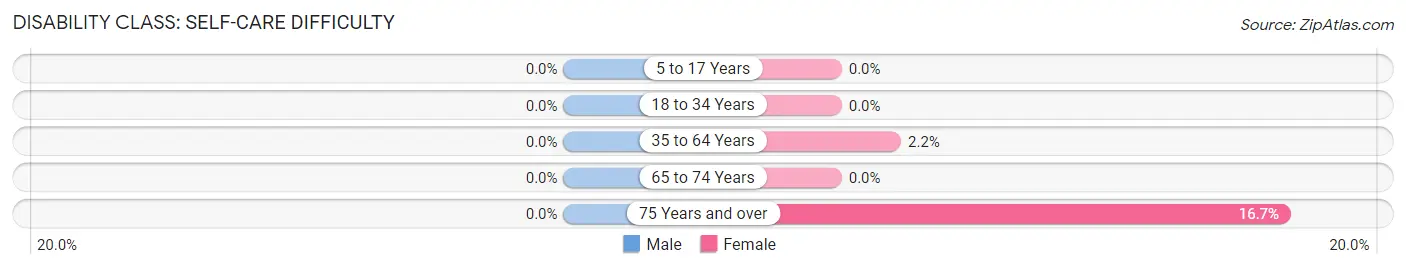
| Age Bracket | Male | Female |
| 5 to 17 Years | 0 (0.0%) | 0 (0.0%) |
| 18 to 34 Years | 0 (0.0%) | 0 (0.0%) |
| 35 to 64 Years | 0 (0.0%) | 2 (2.2%) |
| 65 to 74 Years | 0 (0.0%) | 0 (0.0%) |
| 75 Years and over | 0 (0.0%) | 3 (16.7%) |
Technology Access in Advance
Computing Device Access in Advance
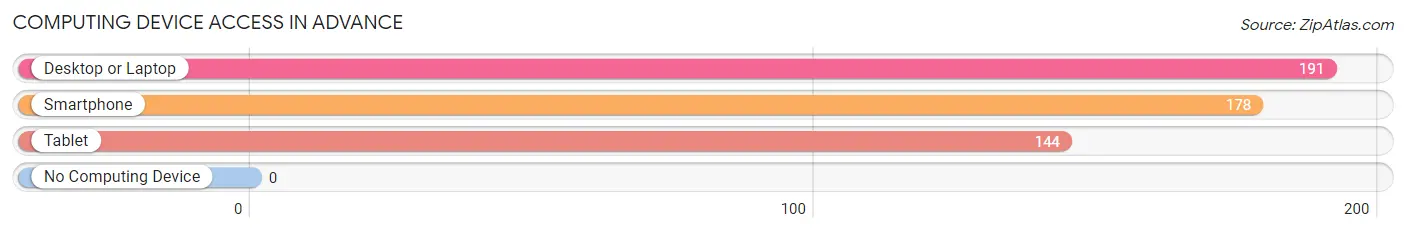
| Device Type | # Households | % Households |
| Desktop or Laptop | 191 | 98.5% |
| Smartphone | 178 | 91.7% |
| Tablet | 144 | 74.2% |
| No Computing Device | 0 | 0.0% |
| Total | 194 | 100.0% |
Internet Access in Advance
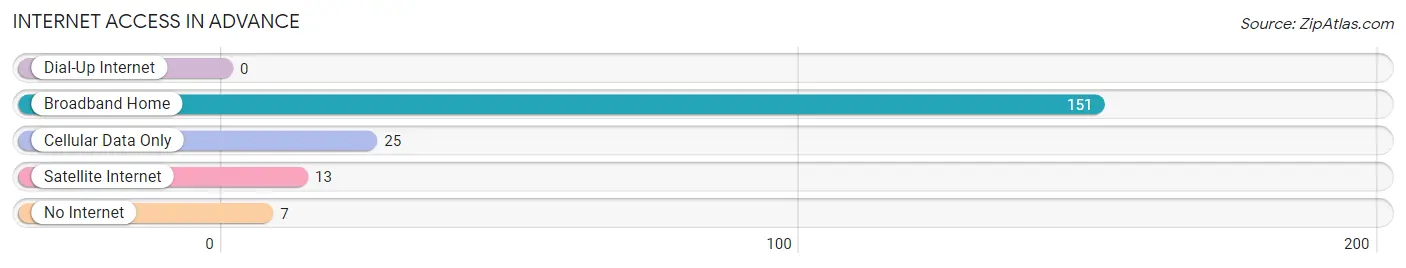
| Internet Type | # Households | % Households |
| Dial-Up Internet | 0 | 0.0% |
| Broadband Home | 151 | 77.8% |
| Cellular Data Only | 25 | 12.9% |
| Satellite Internet | 13 | 6.7% |
| No Internet | 7 | 3.6% |
| Total | 194 | 100.0% |
Advance Summary
Advance is a small unincorporated community located in the northeast corner of Barry County, Michigan. It is situated on the banks of the Thornapple River, approximately 10 miles south of Hastings and 25 miles northeast of Kalamazoo. The population of Advance was estimated to be 1,092 in the 2010 census.
History
Advance was first settled in 1836 by a group of settlers from New York. The settlement was originally known as “New York Settlement”, but was later changed to “Advance” in 1845. The name was chosen to reflect the settlers’ optimism for the future of the area.
The first post office in Advance was established in 1845, and the first school was built in 1848. The first church was built in 1851, and the first newspaper, the Advance Herald, was established in 1853.
The first railroad line to pass through Advance was the Grand Rapids and Indiana Railroad, which was completed in 1871. This line connected Advance to Grand Rapids and other cities in Michigan.
Geography
Advance is located in the northeast corner of Barry County, Michigan. It is situated on the banks of the Thornapple River, approximately 10 miles south of Hastings and 25 miles northeast of Kalamazoo.
The terrain of Advance is mostly flat, with some rolling hills. The soil is mostly sandy loam, with some clay and gravel. The climate is humid continental, with hot summers and cold winters.
Economy
The economy of Advance is largely based on agriculture. The main crops grown in the area are corn, soybeans, wheat, and hay. There are also several small businesses in the area, including a grocery store, a hardware store, and a few restaurants.
The nearest major city is Grand Rapids, which is approximately 40 miles away. Grand Rapids is home to several large companies, including Amway, Steelcase, and Meijer.
Demographics
As of the 2010 census, the population of Advance was estimated to be 1,092. The racial makeup of the town was 97.3% White, 0.7% African American, 0.3% Native American, 0.2% Asian, 0.2% from other races, and 1.3% from two or more races.
The median household income in Advance was $45,938, and the median family income was $50,625. The per capita income was $20,945. About 8.3% of families and 10.2% of the population were below the poverty line.
Conclusion
Advance is a small unincorporated community located in the northeast corner of Barry County, Michigan. It is situated on the banks of the Thornapple River, approximately 10 miles south of Hastings and 25 miles northeast of Kalamazoo. The population of Advance was estimated to be 1,092 in the 2010 census. The economy of Advance is largely based on agriculture, and there are also several small businesses in the area. The racial makeup of the town was 97.3% White, 0.7% African American, 0.3% Native American, 0.2% Asian, 0.2% from other races, and 1.3% from two or more races. The median household income in Advance was $45,938, and the median family income was $50,625. The per capita income was $20,945.
Common Questions
What is Per Capita Income in Advance?
Per Capita income in Advance is $88,156.
What is the Median Family Income in Advance?
Median Family Income in Advance is $120,833.
What is the Median Household income in Advance?
Median Household Income in Advance is $90,833.
What is Income or Wage Gap in Advance?
Income or Wage Gap in Advance is 8.7%.
Women in Advance earn 91.3 cents for every dollar earned by a man.
What is Inequality or Gini Index in Advance?
Inequality or Gini Index in Advance is 0.54.
What is the Total Population of Advance?
Total Population of Advance is 371.
What is the Total Male Population of Advance?
Total Male Population of Advance is 185.
What is the Total Female Population of Advance?
Total Female Population of Advance is 186.
What is the Ratio of Males per 100 Females in Advance?
There are 99.46 Males per 100 Females in Advance.
What is the Ratio of Females per 100 Males in Advance?
There are 100.54 Females per 100 Males in Advance.
What is the Median Population Age in Advance?
Median Population Age in Advance is 63.1 Years.
What is the Average Family Size in Advance
Average Family Size in Advance is 2.1 People.
What is the Average Household Size in Advance
Average Household Size in Advance is 1.9 People.
How Large is the Labor Force in Advance?
There are 161 People in the Labor Forcein in Advance.
What is the Percentage of People in the Labor Force in Advance?
44.8% of People are in the Labor Force in Advance.
What is the Unemployment Rate in Advance?
Unemployment Rate in Advance is 1.9%.