Cities with the Highest Percentage of Households with Income Above $200,000 in Rhode Island
RELATED REPORTS & OPTIONS
Household Income | $200k+
Rhode Island
Compare Cities
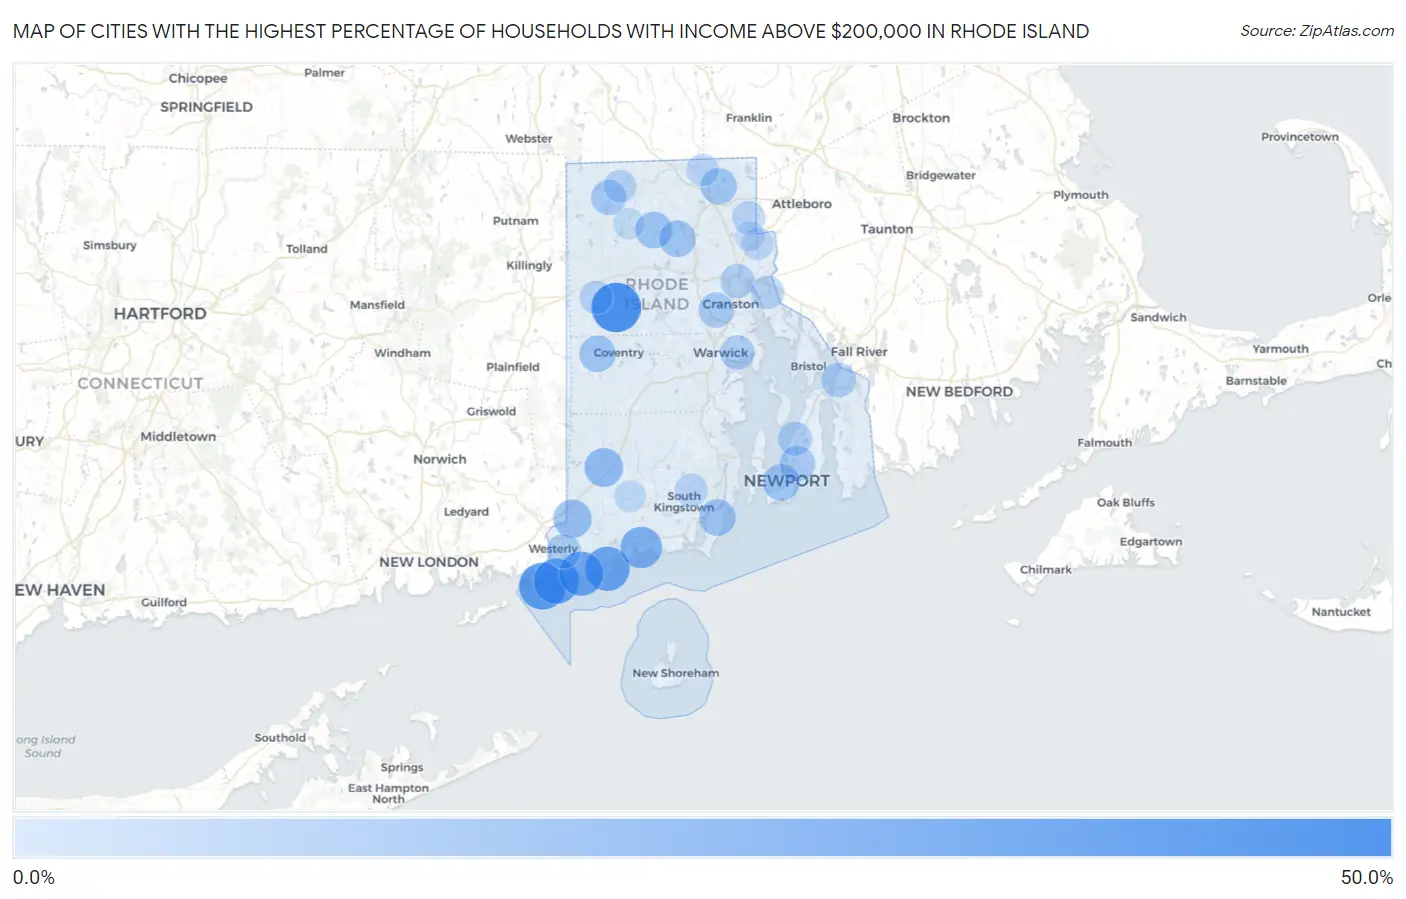
Map of Cities with the Highest Percentage of Households with Income Above $200,000 in Rhode Island
0.0%
50.0%
Cities with the Highest Percentage of Households with Income Above $200,000 in Rhode Island
| City | Households with Income > $200k | vs State | vs National | |
| 1. | Clayville | 40.8% | 11.3%(+29.5)#1 | 11.4%(+29.4)#787 |
| 2. | Watch Hill | 35.0% | 11.3%(+23.7)#2 | 11.4%(+23.6)#1,177 |
| 3. | Misquamicut | 31.8% | 11.3%(+20.5)#3 | 11.4%(+20.4)#1,453 |
| 4. | Quonochontaug | 30.0% | 11.3%(+18.7)#4 | 11.4%(+18.6)#1,621 |
| 5. | Weekapaug | 29.8% | 11.3%(+18.5)#5 | 11.4%(+18.4)#1,644 |
| 6. | Charlestown | 23.8% | 11.3%(+12.5)#6 | 11.4%(+12.4)#2,356 |
| 7. | Hope Valley | 18.0% | 11.3%(+6.70)#7 | 11.4%(+6.60)#3,496 |
| 8. | Ashaway | 16.6% | 11.3%(+5.30)#8 | 11.4%(+5.20)#3,837 |
| 9. | Narragansett Pier | 13.9% | 11.3%(+2.60)#9 | 11.4%(+2.50)#4,701 |
| 10. | Harmony | 13.7% | 11.3%(+2.40)#10 | 11.4%(+2.30)#4,797 |
| 11. | Greenville | 13.5% | 11.3%(+2.20)#11 | 11.4%(+2.10)#4,862 |
| 12. | Newport | 13.4% | 11.3%(+2.10)#12 | 11.4%(+2.00)#4,891 |
| 13. | Greene | 13.0% | 11.3%(+1.70)#13 | 11.4%(+1.60)#5,079 |
| 14. | Wakefield-Peace Dale | 12.7% | 11.3%(+1.40)#14 | 11.4%(+1.30)#5,196 |
| 15. | Cumberland Hill | 12.5% | 11.3%(+1.20)#15 | 11.4%(+1.10)#5,274 |
| 16. | Newport East | 11.3% | 11.3%(=0.000)#16 | 11.4%(-0.100)#5,836 |
| 17. | Cranston | 10.8% | 11.3%(-0.500)#17 | 11.4%(-0.600)#6,059 |
| 18. | Pascoag | 10.8% | 11.3%(-0.500)#18 | 11.4%(-0.600)#6,080 |
| 19. | Westerly | 9.4% | 11.3%(-1.90)#19 | 11.4%(-2.00)#6,898 |
| 20. | Tiverton | 9.3% | 11.3%(-2.00)#20 | 11.4%(-2.10)#6,984 |
| 21. | Providence | 8.8% | 11.3%(-2.50)#21 | 11.4%(-2.60)#7,282 |
| 22. | Warwick | 8.7% | 11.3%(-2.60)#22 | 11.4%(-2.70)#7,355 |
| 23. | Melville | 8.2% | 11.3%(-3.10)#23 | 11.4%(-3.20)#7,779 |
| 24. | East Providence | 7.1% | 11.3%(-4.20)#24 | 11.4%(-4.30)#8,675 |
| 25. | Foster Center | 6.3% | 11.3%(-5.00)#25 | 11.4%(-5.10)#9,642 |
| 26. | Valley Falls | 6.1% | 11.3%(-5.20)#26 | 11.4%(-5.30)#9,801 |
| 27. | Harrisville | 5.8% | 11.3%(-5.50)#27 | 11.4%(-5.60)#10,236 |
| 28. | Kingston | 5.7% | 11.3%(-5.60)#28 | 11.4%(-5.70)#10,337 |
| 29. | Woonsocket | 5.0% | 11.3%(-6.30)#29 | 11.4%(-6.40)#11,343 |
| 30. | Pawtucket | 4.4% | 11.3%(-6.90)#30 | 11.4%(-7.00)#12,331 |
| 31. | Carolina | 3.4% | 11.3%(-7.90)#31 | 11.4%(-8.00)#14,389 |
| 32. | Chepachet | 2.4% | 11.3%(-8.90)#32 | 11.4%(-9.00)#16,907 |
| 33. | Central Falls | 0.40% | 11.3%(-10.9)#33 | 11.4%(-11.0)#22,044 |
1
Common Questions
What are the Top 10 Cities with the Highest Percentage of Households with Income Above $200,000 in Rhode Island?
Top 10 Cities with the Highest Percentage of Households with Income Above $200,000 in Rhode Island are:
#1
40.8%
#2
35.0%
#3
31.8%
#4
30.0%
#5
29.8%
#6
23.8%
#7
18.0%
#8
16.6%
#9
13.9%
#10
13.7%
What city has the Highest Percentage of Households with Income Above $200,000 in Rhode Island?
Clayville has the Highest Percentage of Households with Income Above $200,000 in Rhode Island with 40.8%.
What is the Percentage of Households with Income Above $200,000 in the State of Rhode Island?
Percentage of Households with Income Above $200,000 in Rhode Island is 11.3%.
What is the Percentage of Households with Income Above $200,000 in the United States?
Percentage of Households with Income Above $200,000 in the United States is 11.4%.