Zip Codes with the Highest Percentage of Households with Income Above $200,000 in Sterling Heights, MI
RELATED REPORTS & OPTIONS
Household Income | $200k+
Sterling Heights
Compare Zip Codes
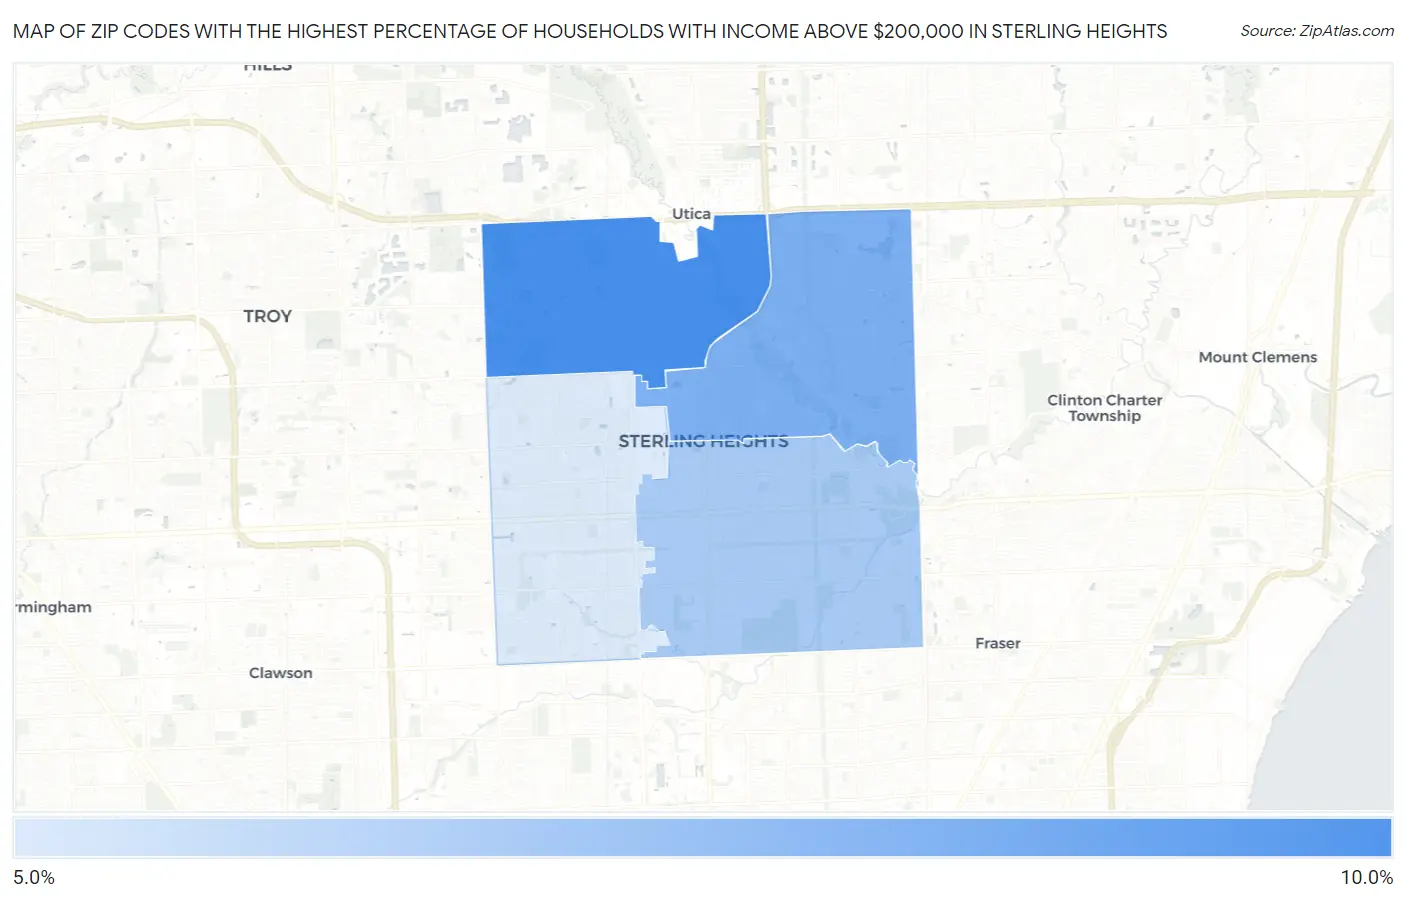
Map of Zip Codes with the Highest Percentage of Households with Income Above $200,000 in Sterling Heights
5.3%
9.0%
Zip Codes with the Highest Percentage of Households with Income Above $200,000 in Sterling Heights, MI
| Zip Code | Households with Income > $200k | vs State | vs National | |
| 1. | 48314 | 9.0% | 8.2%(+0.800)#204 | 11.4%(-2.40)#9,225 |
| 2. | 48313 | 7.7% | 8.2%(-0.500)#250 | 11.4%(-3.70)#10,756 |
| 3. | 48312 | 6.6% | 8.2%(-1.60)#296 | 11.4%(-4.80)#12,399 |
| 4. | 48310 | 5.3% | 8.2%(-2.90)#370 | 11.4%(-6.10)#14,872 |
1
Common Questions
What are the Top 3 Zip Codes with the Highest Percentage of Households with Income Above $200,000 in Sterling Heights, MI?
Top 3 Zip Codes with the Highest Percentage of Households with Income Above $200,000 in Sterling Heights, MI are:
What zip code has the Highest Percentage of Households with Income Above $200,000 in Sterling Heights, MI?
48314 has the Highest Percentage of Households with Income Above $200,000 in Sterling Heights, MI with 9.0%.
What is the Percentage of Households with Income Above $200,000 in Sterling Heights, MI?
Percentage of Households with Income Above $200,000 in Sterling Heights is 6.9%.
What is the Percentage of Households with Income Above $200,000 in Michigan?
Percentage of Households with Income Above $200,000 in Michigan is 8.2%.
What is the Percentage of Households with Income Above $200,000 in the United States?
Percentage of Households with Income Above $200,000 in the United States is 11.4%.