Goodrich, MI Map & Demographics
Goodrich Map
Goodrich Overview
$47,152
PER CAPITA INCOME
$121,615
AVG FAMILY INCOME
$103,438
AVG HOUSEHOLD INCOME
20.5%
WAGE / INCOME GAP [ % ]
79.5¢/ $1
WAGE / INCOME GAP [ $ ]
0.42
INEQUALITY / GINI INDEX
1,991
TOTAL POPULATION
965
MALE POPULATION
1,026
FEMALE POPULATION
94.05
MALES / 100 FEMALES
106.32
FEMALES / 100 MALES
42.1
MEDIAN AGE
3.1
AVG FAMILY SIZE
2.7
AVG HOUSEHOLD SIZE
1,005
LABOR FORCE [ PEOPLE ]
66.8%
PERCENT IN LABOR FORCE
9.0%
UNEMPLOYMENT RATE
Goodrich Zip Codes
Goodrich Area Codes
Income in Goodrich
Income Overview in Goodrich
Per Capita Income in Goodrich is $47,152, while median incomes of families and households are $121,615 and $103,438 respectively.
| Characteristic | Number | Measure |
| Per Capita Income | 1,991 | $47,152 |
| Median Family Income | 531 | $121,615 |
| Mean Family Income | 531 | $138,440 |
| Median Household Income | 728 | $103,438 |
| Mean Household Income | 728 | $125,541 |
| Income Deficit | 531 | $0 |
| Wage / Income Gap (%) | 1,991 | 20.46% |
| Wage / Income Gap ($) | 1,991 | 79.54¢ per $1 |
| Gini / Inequality Index | 1,991 | 0.42 |
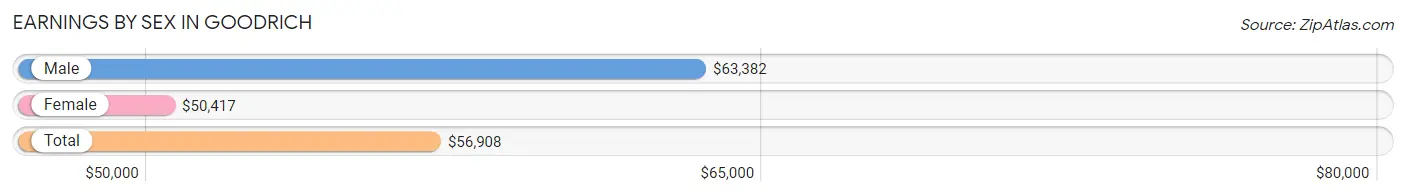
Earnings by Sex in Goodrich
Average Earnings in Goodrich are $56,908, $63,382 for men and $50,417 for women, a difference of 20.5%.
| Sex | Number | Average Earnings |
| Male | 576 (55.0%) | $63,382 |
| Female | 471 (45.0%) | $50,417 |
| Total | 1,047 (100.0%) | $56,908 |
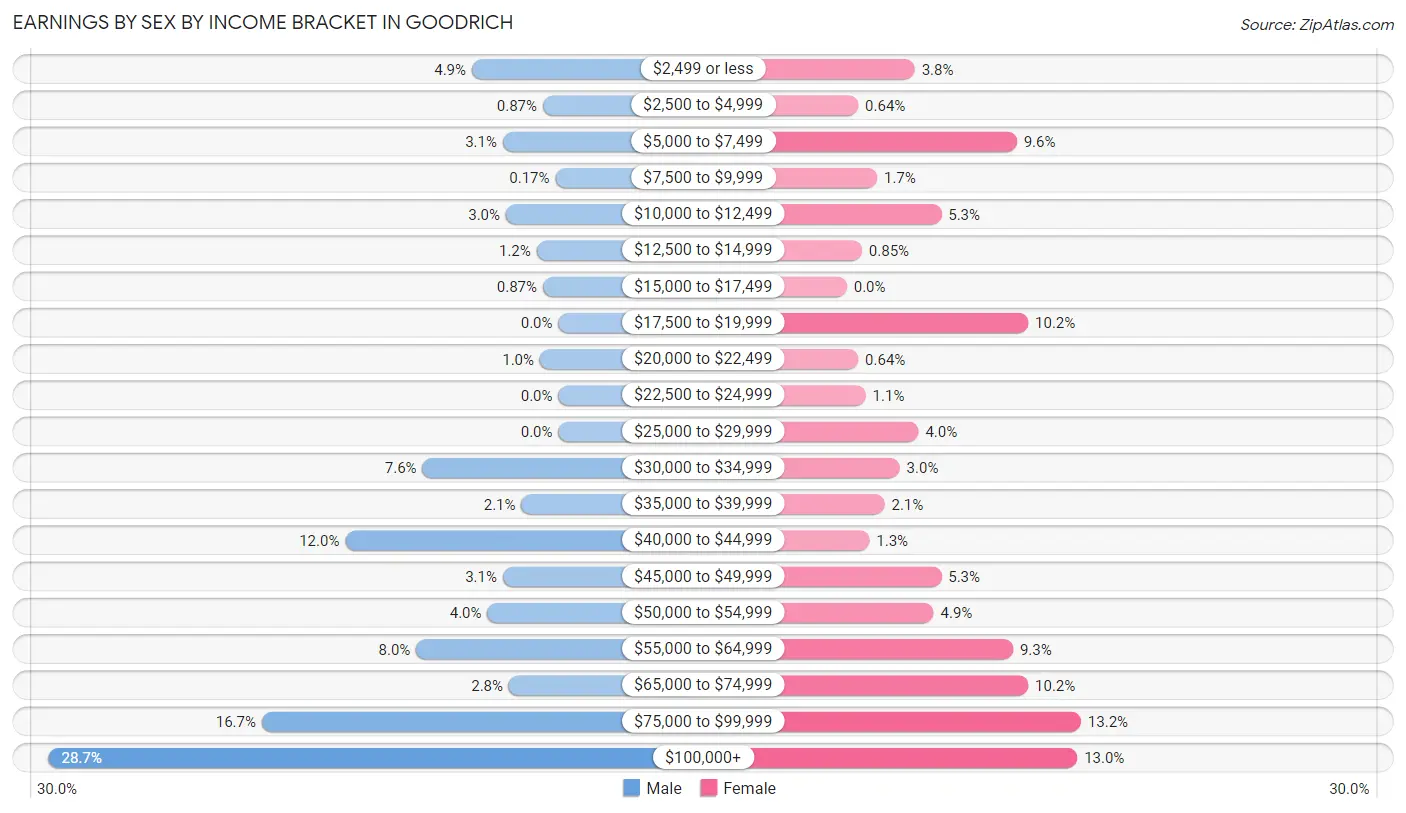
Earnings by Sex by Income Bracket in Goodrich
The most common earnings brackets in Goodrich are $100,000+ for men (165 | 28.6%) and $75,000 to $99,999 for women (62 | 13.2%).
| Income | Male | Female |
| $2,499 or less | 28 (4.9%) | 18 (3.8%) |
| $2,500 to $4,999 | 5 (0.9%) | 3 (0.6%) |
| $5,000 to $7,499 | 18 (3.1%) | 45 (9.6%) |
| $7,500 to $9,999 | 1 (0.2%) | 8 (1.7%) |
| $10,000 to $12,499 | 17 (2.9%) | 25 (5.3%) |
| $12,500 to $14,999 | 7 (1.2%) | 4 (0.9%) |
| $15,000 to $17,499 | 5 (0.9%) | 0 (0.0%) |
| $17,500 to $19,999 | 0 (0.0%) | 48 (10.2%) |
| $20,000 to $22,499 | 6 (1.0%) | 3 (0.6%) |
| $22,500 to $24,999 | 0 (0.0%) | 5 (1.1%) |
| $25,000 to $29,999 | 0 (0.0%) | 19 (4.0%) |
| $30,000 to $34,999 | 44 (7.6%) | 14 (3.0%) |
| $35,000 to $39,999 | 12 (2.1%) | 10 (2.1%) |
| $40,000 to $44,999 | 69 (12.0%) | 6 (1.3%) |
| $45,000 to $49,999 | 18 (3.1%) | 25 (5.3%) |
| $50,000 to $54,999 | 23 (4.0%) | 23 (4.9%) |
| $55,000 to $64,999 | 46 (8.0%) | 44 (9.3%) |
| $65,000 to $74,999 | 16 (2.8%) | 48 (10.2%) |
| $75,000 to $99,999 | 96 (16.7%) | 62 (13.2%) |
| $100,000+ | 165 (28.6%) | 61 (13.0%) |
| Total | 576 (100.0%) | 471 (100.0%) |
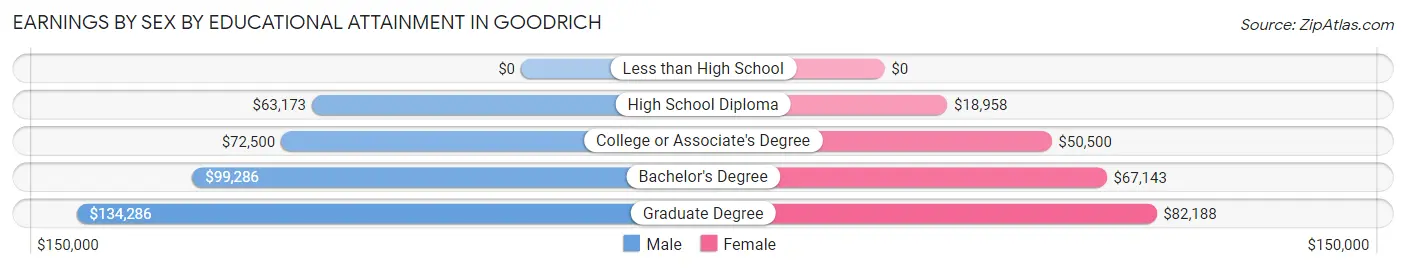
Earnings by Sex by Educational Attainment in Goodrich
Average earnings in Goodrich are $90,114 for men and $57,212 for women, a difference of 36.5%. Men with an educational attainment of graduate degree enjoy the highest average annual earnings of $134,286, while those with high school diploma education earn the least with $63,173. Women with an educational attainment of graduate degree earn the most with the average annual earnings of $82,188, while those with high school diploma education have the smallest earnings of $18,958.
| Educational Attainment | Male Income | Female Income |
| Less than High School | - | - |
| High School Diploma | $63,173 | $18,958 |
| College or Associate's Degree | $72,500 | $50,500 |
| Bachelor's Degree | $99,286 | $67,143 |
| Graduate Degree | $134,286 | $82,188 |
| Total | $90,114 | $57,212 |
Family Income in Goodrich
Family Income Brackets in Goodrich
According to the Goodrich family income data, there are 164 families falling into the $100,000 to $149,999 income range, which is the most common income bracket and makes up 30.9% of all families. Conversely, the less than $10,000 income bracket is the least frequent group with only 4 families (0.7%) belonging to this category.
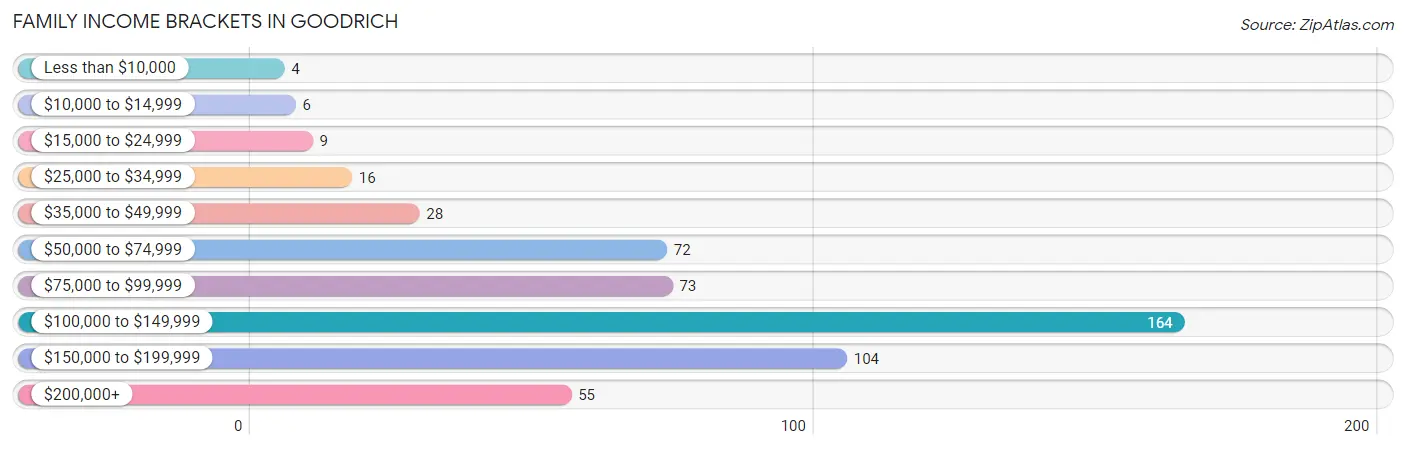
| Income Bracket | # Families | % Families |
| Less than $10,000 | 4 | 0.8% |
| $10,000 to $14,999 | 6 | 1.1% |
| $15,000 to $24,999 | 9 | 1.7% |
| $25,000 to $34,999 | 16 | 3.0% |
| $35,000 to $49,999 | 28 | 5.3% |
| $50,000 to $74,999 | 72 | 13.6% |
| $75,000 to $99,999 | 73 | 13.7% |
| $100,000 to $149,999 | 164 | 30.9% |
| $150,000 to $199,999 | 104 | 19.6% |
| $200,000+ | 55 | 10.4% |
Family Income by Famaliy Size in Goodrich
4-person families (131 | 24.7%) account for the highest median family income in Goodrich with $154,821 per family, while 2-person families (247 | 46.5%) have the highest median income of $57,734 per family member.
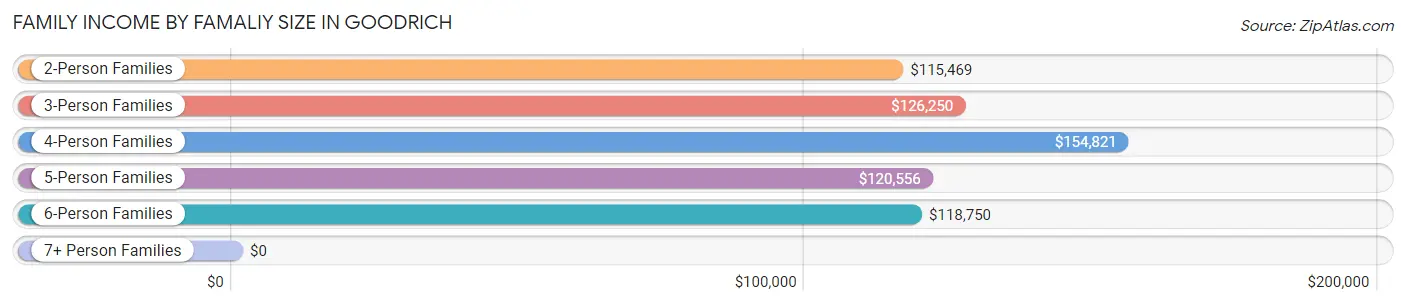
| Income Bracket | # Families | Median Income |
| 2-Person Families | 247 (46.5%) | $115,469 |
| 3-Person Families | 75 (14.1%) | $126,250 |
| 4-Person Families | 131 (24.7%) | $154,821 |
| 5-Person Families | 58 (10.9%) | $120,556 |
| 6-Person Families | 20 (3.8%) | $118,750 |
| 7+ Person Families | 0 (0.0%) | $0 |
| Total | 531 (100.0%) | $121,615 |
Family Income by Number of Earners in Goodrich
The median family income in Goodrich is $121,615, with families comprising 3+ earners (57) having the highest median family income of $147,188, while families with no earners (63) have the lowest median family income of $65,625, accounting for 10.7% and 11.9% of families, respectively.
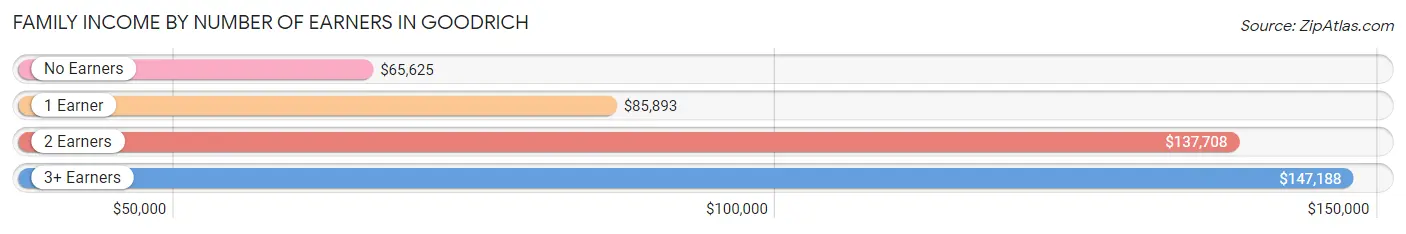
| Number of Earners | # Families | Median Income |
| No Earners | 63 (11.9%) | $65,625 |
| 1 Earner | 175 (33.0%) | $85,893 |
| 2 Earners | 236 (44.4%) | $137,708 |
| 3+ Earners | 57 (10.7%) | $147,188 |
| Total | 531 (100.0%) | $121,615 |
Household Income in Goodrich
Household Income Brackets in Goodrich
With 179 households falling in the category, the $100,000 to $149,999 income range is the most frequent in Goodrich, accounting for 24.6% of all households. In contrast, only 6 households (0.8%) fall into the $10,000 to $14,999 income bracket, making it the least populous group.
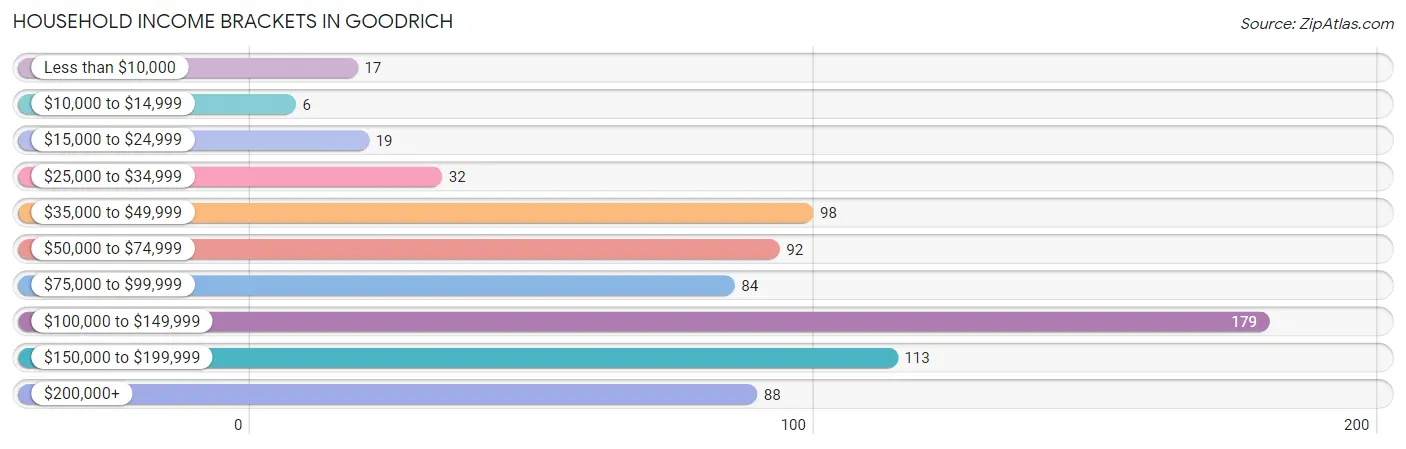
| Income Bracket | # Households | % Households |
| Less than $10,000 | 17 | 2.3% |
| $10,000 to $14,999 | 6 | 0.8% |
| $15,000 to $24,999 | 19 | 2.6% |
| $25,000 to $34,999 | 32 | 4.4% |
| $35,000 to $49,999 | 98 | 13.5% |
| $50,000 to $74,999 | 92 | 12.6% |
| $75,000 to $99,999 | 84 | 11.5% |
| $100,000 to $149,999 | 179 | 24.6% |
| $150,000 to $199,999 | 113 | 15.5% |
| $200,000+ | 88 | 12.1% |
Household Income by Householder Age in Goodrich
The median household income in Goodrich is $103,438, with the highest median household income of $120,139 found in the 25 to 44 years age bracket for the primary householder. A total of 208 households (28.6%) fall into this category. Meanwhile, the 15 to 24 years age bracket for the primary householder has the lowest median household income of $0, with 7 households (1.0%) in this group.
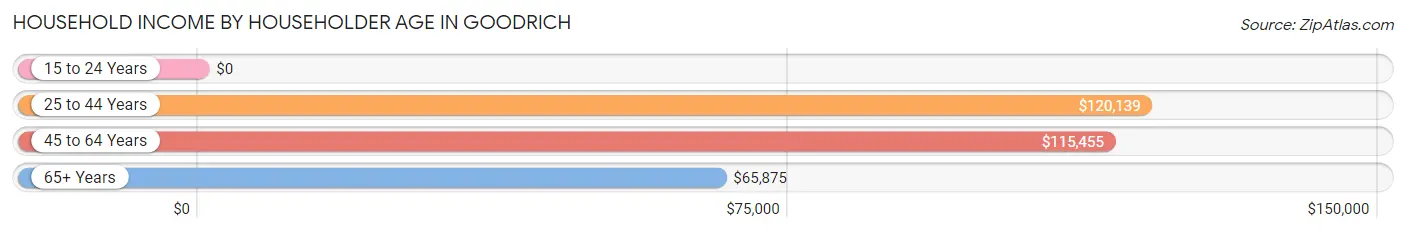
| Income Bracket | # Households | Median Income |
| 15 to 24 Years | 7 (1.0%) | $0 |
| 25 to 44 Years | 208 (28.6%) | $120,139 |
| 45 to 64 Years | 376 (51.6%) | $115,455 |
| 65+ Years | 137 (18.8%) | $65,875 |
| Total | 728 (100.0%) | $103,438 |
Poverty in Goodrich
Income Below Poverty by Sex and Age in Goodrich
With 3.8% poverty level for males and 6.6% for females among the residents of Goodrich, 18 to 24 year old males and under 5 year old females are the most vulnerable to poverty, with 18 males (19.6%) and 17 females (22.1%) in their respective age groups living below the poverty level.
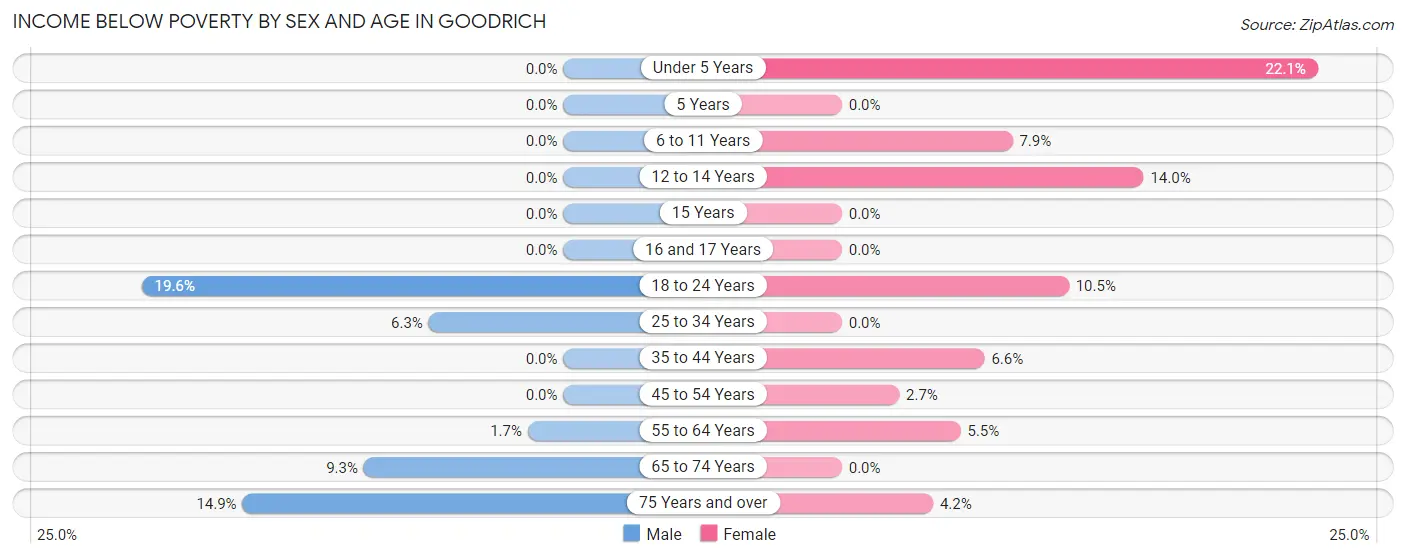
| Age Bracket | Male | Female |
| Under 5 Years | 0 (0.0%) | 17 (22.1%) |
| 5 Years | 0 (0.0%) | 0 (0.0%) |
| 6 to 11 Years | 0 (0.0%) | 8 (7.9%) |
| 12 to 14 Years | 0 (0.0%) | 7 (14.0%) |
| 15 Years | 0 (0.0%) | 0 (0.0%) |
| 16 and 17 Years | 0 (0.0%) | 0 (0.0%) |
| 18 to 24 Years | 18 (19.6%) | 8 (10.5%) |
| 25 to 34 Years | 4 (6.2%) | 0 (0.0%) |
| 35 to 44 Years | 0 (0.0%) | 10 (6.6%) |
| 45 to 54 Years | 0 (0.0%) | 5 (2.7%) |
| 55 to 64 Years | 3 (1.7%) | 7 (5.5%) |
| 65 to 74 Years | 5 (9.3%) | 0 (0.0%) |
| 75 Years and over | 7 (14.9%) | 3 (4.2%) |
| Total | 37 (3.8%) | 65 (6.6%) |
Income Above Poverty by Sex and Age in Goodrich
According to the poverty statistics in Goodrich, males aged under 5 years and females aged 5 years are the age groups that are most secure financially, with 100.0% of males and 100.0% of females in these age groups living above the poverty line.
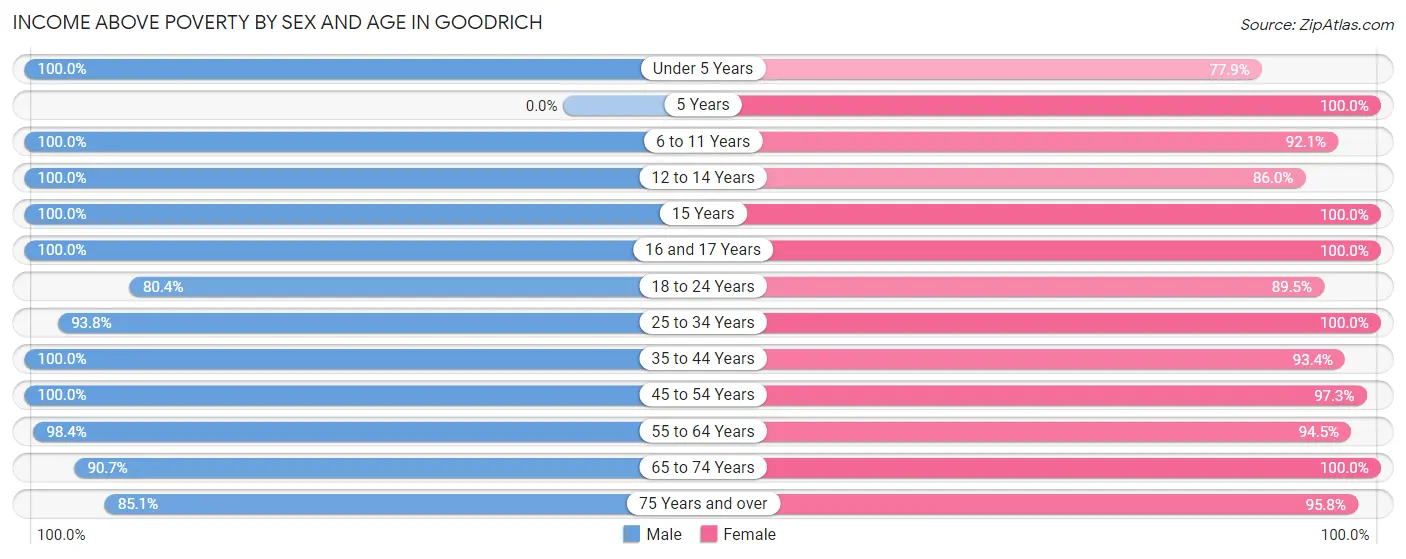
| Age Bracket | Male | Female |
| Under 5 Years | 46 (100.0%) | 60 (77.9%) |
| 5 Years | 0 (0.0%) | 22 (100.0%) |
| 6 to 11 Years | 94 (100.0%) | 93 (92.1%) |
| 12 to 14 Years | 68 (100.0%) | 43 (86.0%) |
| 15 Years | 20 (100.0%) | 9 (100.0%) |
| 16 and 17 Years | 16 (100.0%) | 6 (100.0%) |
| 18 to 24 Years | 74 (80.4%) | 68 (89.5%) |
| 25 to 34 Years | 60 (93.8%) | 48 (100.0%) |
| 35 to 44 Years | 120 (100.0%) | 141 (93.4%) |
| 45 to 54 Years | 162 (100.0%) | 183 (97.3%) |
| 55 to 64 Years | 179 (98.4%) | 120 (94.5%) |
| 65 to 74 Years | 49 (90.7%) | 64 (100.0%) |
| 75 Years and over | 40 (85.1%) | 68 (95.8%) |
| Total | 928 (96.2%) | 925 (93.4%) |
Income Below Poverty Among Married-Couple Families in Goodrich
The poverty statistics for married-couple families in Goodrich show that 2.6% or 11 of the total 424 families live below the poverty line. Families with 3 or 4 children have the highest poverty rate of 12.3%, comprising of 7 families. On the other hand, families with 1 or 2 children have the lowest poverty rate of 0.0%, which includes 0 families.
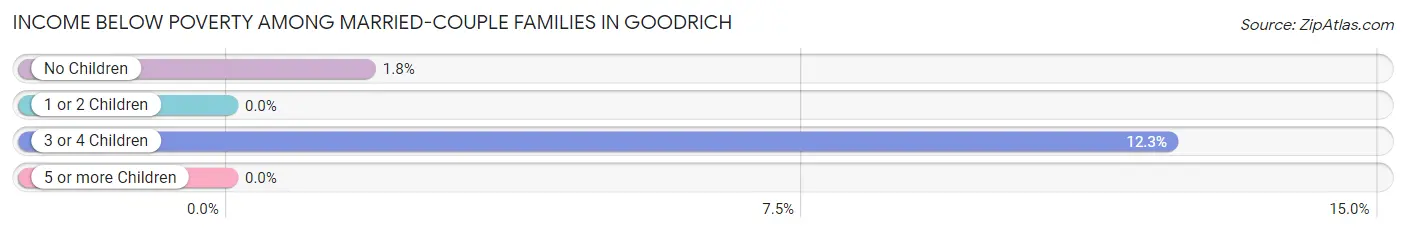
| Children | Above Poverty | Below Poverty |
| No Children | 218 (98.2%) | 4 (1.8%) |
| 1 or 2 Children | 145 (100.0%) | 0 (0.0%) |
| 3 or 4 Children | 50 (87.7%) | 7 (12.3%) |
| 5 or more Children | 0 (0.0%) | 0 (0.0%) |
| Total | 413 (97.4%) | 11 (2.6%) |
Income Below Poverty Among Single-Parent Households in Goodrich
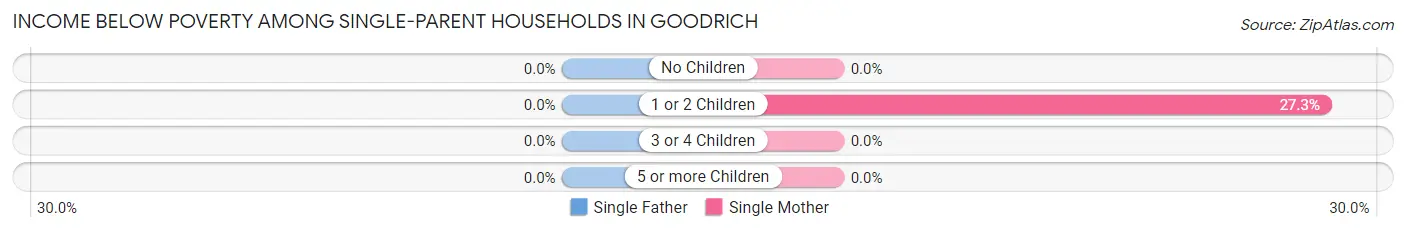
| Children | Single Father | Single Mother |
| No Children | 0 (0.0%) | 0 (0.0%) |
| 1 or 2 Children | 0 (0.0%) | 6 (27.3%) |
| 3 or 4 Children | 0 (0.0%) | 0 (0.0%) |
| 5 or more Children | 0 (0.0%) | 0 (0.0%) |
| Total | 0 (0.0%) | 6 (5.9%) |
Income Below Poverty Among Married-Couple vs Single-Parent Households in Goodrich
The poverty data for Goodrich shows that 11 of the married-couple family households (2.6%) and 6 of the single-parent households (5.6%) are living below the poverty level. Within the married-couple family households, those with 3 or 4 children have the highest poverty rate, with 7 households (12.3%) falling below the poverty line. Among the single-parent households, those with 1 or 2 children have the highest poverty rate, with 6 household (22.2%) living below poverty.
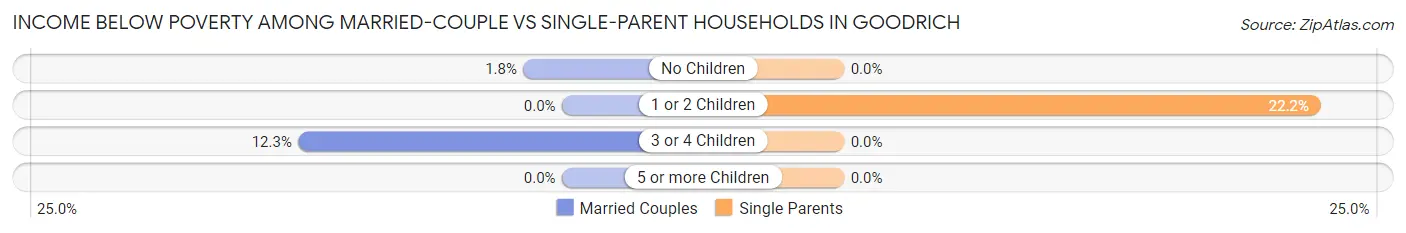
| Children | Married-Couple Families | Single-Parent Households |
| No Children | 4 (1.8%) | 0 (0.0%) |
| 1 or 2 Children | 0 (0.0%) | 6 (22.2%) |
| 3 or 4 Children | 7 (12.3%) | 0 (0.0%) |
| 5 or more Children | 0 (0.0%) | 0 (0.0%) |
| Total | 11 (2.6%) | 6 (5.6%) |
Race in Goodrich
The most populous races in Goodrich are White / Caucasian (1,955 | 98.2%), Hispanic or Latino (27 | 1.4%), and Black / African American (18 | 0.9%).
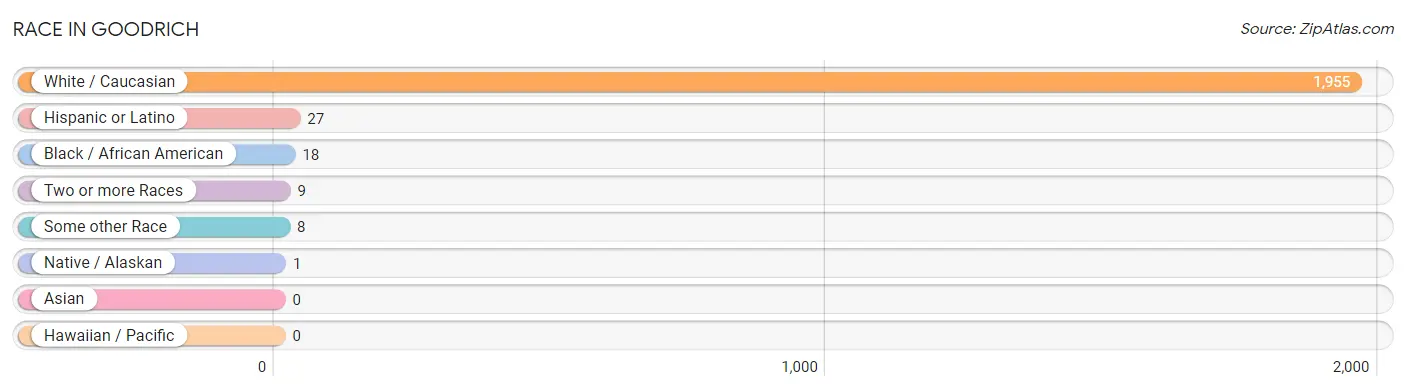
| Race | # Population | % Population |
| Asian | 0 | 0.0% |
| Black / African American | 18 | 0.9% |
| Hawaiian / Pacific | 0 | 0.0% |
| Hispanic or Latino | 27 | 1.4% |
| Native / Alaskan | 1 | 0.1% |
| White / Caucasian | 1,955 | 98.2% |
| Two or more Races | 9 | 0.4% |
| Some other Race | 8 | 0.4% |
| Total | 1,991 | 100.0% |
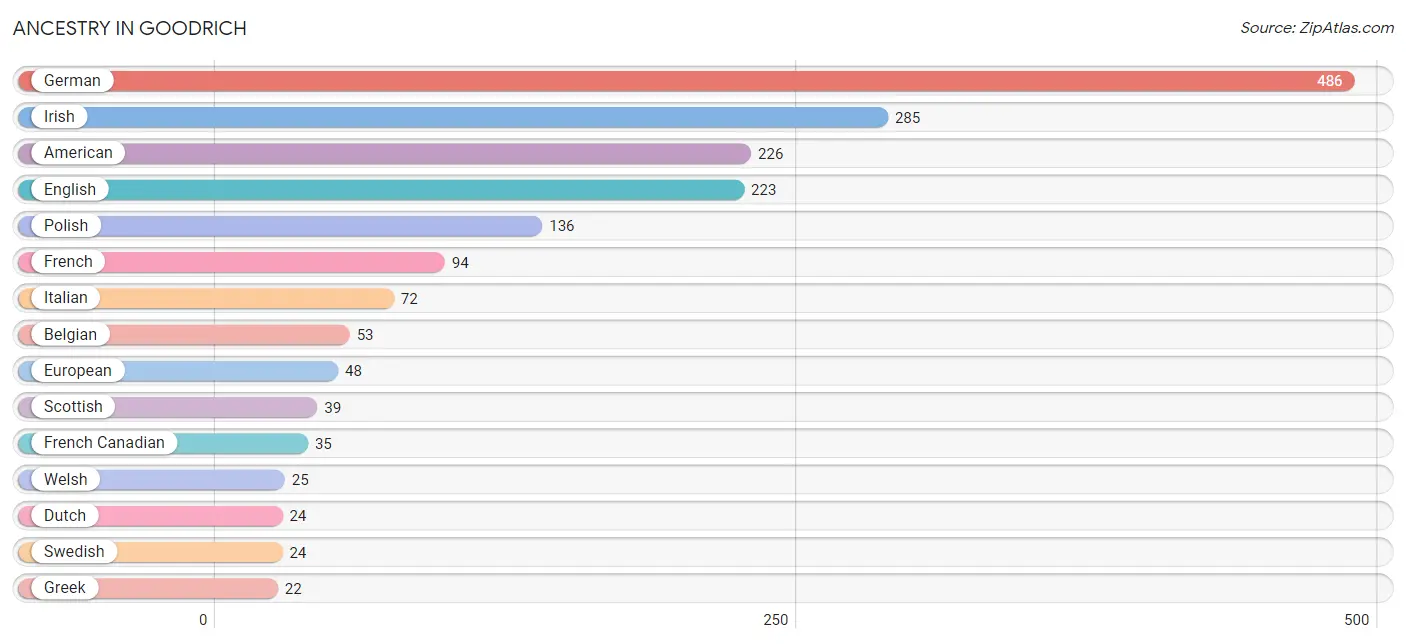
Ancestry in Goodrich
The most populous ancestries reported in Goodrich are German (486 | 24.4%), Irish (285 | 14.3%), American (226 | 11.4%), English (223 | 11.2%), and Polish (136 | 6.8%), together accounting for 68.1% of all Goodrich residents.
| Ancestry | # Population | % Population |
| Albanian | 4 | 0.2% |
| American | 226 | 11.4% |
| Arab | 10 | 0.5% |
| Armenian | 3 | 0.2% |
| Belgian | 53 | 2.7% |
| British | 6 | 0.3% |
| Canadian | 4 | 0.2% |
| Croatian | 3 | 0.2% |
| Cuban | 14 | 0.7% |
| Czech | 2 | 0.1% |
| Dutch | 24 | 1.2% |
| English | 223 | 11.2% |
| European | 48 | 2.4% |
| Finnish | 19 | 0.9% |
| French | 94 | 4.7% |
| French Canadian | 35 | 1.8% |
| German | 486 | 24.4% |
| Greek | 22 | 1.1% |
| Hungarian | 22 | 1.1% |
| Icelander | 4 | 0.2% |
| Iraqi | 7 | 0.4% |
| Irish | 285 | 14.3% |
| Italian | 72 | 3.6% |
| Lebanese | 3 | 0.2% |
| Lithuanian | 4 | 0.2% |
| Mexican | 13 | 0.6% |
| Norwegian | 14 | 0.7% |
| Polish | 136 | 6.8% |
| Portuguese | 4 | 0.2% |
| Russian | 6 | 0.3% |
| Scotch-Irish | 7 | 0.4% |
| Scottish | 39 | 2.0% |
| Serbian | 9 | 0.4% |
| Slavic | 4 | 0.2% |
| Swedish | 24 | 1.2% |
| Syrian | 3 | 0.2% |
| Ukrainian | 3 | 0.2% |
| Welsh | 25 | 1.3% | View All 38 Rows |
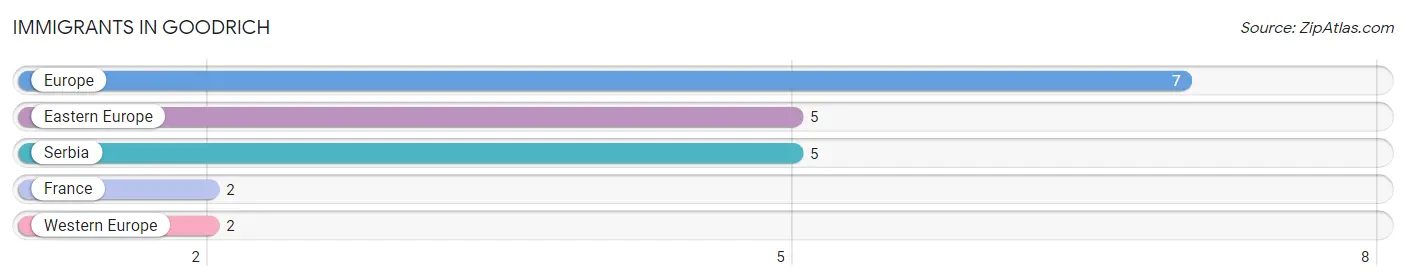
Immigrants in Goodrich
The most numerous immigrant groups reported in Goodrich came from Europe (7 | 0.4%), Eastern Europe (5 | 0.3%), Serbia (5 | 0.3%), France (2 | 0.1%), and Western Europe (2 | 0.1%), together accounting for 1.1% of all Goodrich residents.
| Immigration Origin | # Population | % Population |
| Eastern Europe | 5 | 0.3% |
| Europe | 7 | 0.4% |
| France | 2 | 0.1% |
| Serbia | 5 | 0.3% |
| Western Europe | 2 | 0.1% | View All 5 Rows |
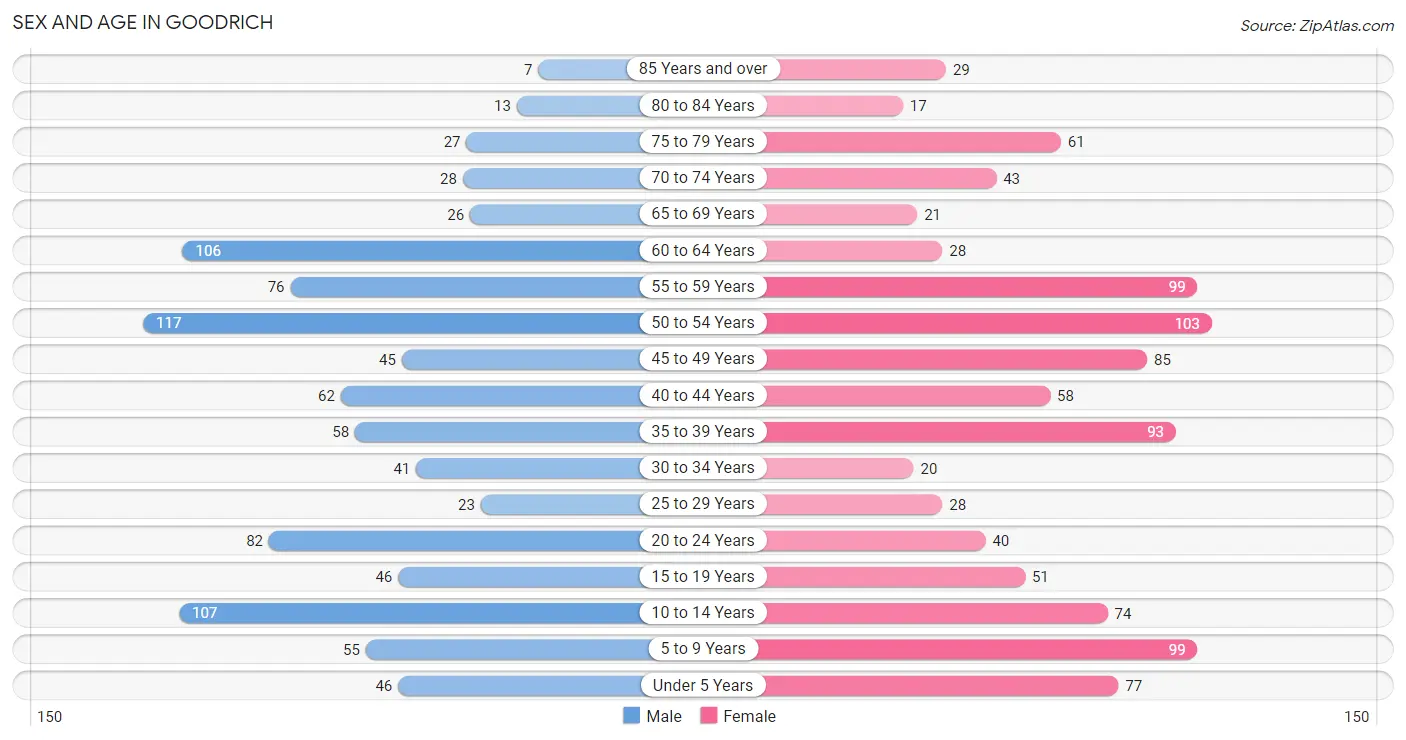
Sex and Age in Goodrich
Sex and Age in Goodrich
The most populous age groups in Goodrich are 50 to 54 Years (117 | 12.1%) for men and 50 to 54 Years (103 | 10.0%) for women.
| Age Bracket | Male | Female |
| Under 5 Years | 46 (4.8%) | 77 (7.5%) |
| 5 to 9 Years | 55 (5.7%) | 99 (9.7%) |
| 10 to 14 Years | 107 (11.1%) | 74 (7.2%) |
| 15 to 19 Years | 46 (4.8%) | 51 (5.0%) |
| 20 to 24 Years | 82 (8.5%) | 40 (3.9%) |
| 25 to 29 Years | 23 (2.4%) | 28 (2.7%) |
| 30 to 34 Years | 41 (4.3%) | 20 (1.9%) |
| 35 to 39 Years | 58 (6.0%) | 93 (9.1%) |
| 40 to 44 Years | 62 (6.4%) | 58 (5.7%) |
| 45 to 49 Years | 45 (4.7%) | 85 (8.3%) |
| 50 to 54 Years | 117 (12.1%) | 103 (10.0%) |
| 55 to 59 Years | 76 (7.9%) | 99 (9.7%) |
| 60 to 64 Years | 106 (11.0%) | 28 (2.7%) |
| 65 to 69 Years | 26 (2.7%) | 21 (2.1%) |
| 70 to 74 Years | 28 (2.9%) | 43 (4.2%) |
| 75 to 79 Years | 27 (2.8%) | 61 (5.9%) |
| 80 to 84 Years | 13 (1.3%) | 17 (1.7%) |
| 85 Years and over | 7 (0.7%) | 29 (2.8%) |
| Total | 965 (100.0%) | 1,026 (100.0%) |
Families and Households in Goodrich
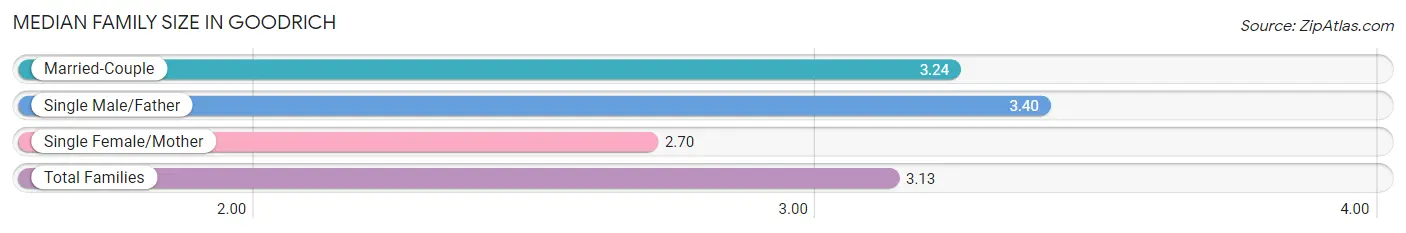
Median Family Size in Goodrich
The median family size in Goodrich is 3.13 persons per family, with single male/father families (5 | 0.9%) accounting for the largest median family size of 3.4 persons per family. On the other hand, single female/mother families (102 | 19.2%) represent the smallest median family size with 2.70 persons per family.
| Family Type | # Families | Family Size |
| Married-Couple | 424 (79.8%) | 3.24 |
| Single Male/Father | 5 (0.9%) | 3.40 |
| Single Female/Mother | 102 (19.2%) | 2.70 |
| Total Families | 531 (100.0%) | 3.13 |
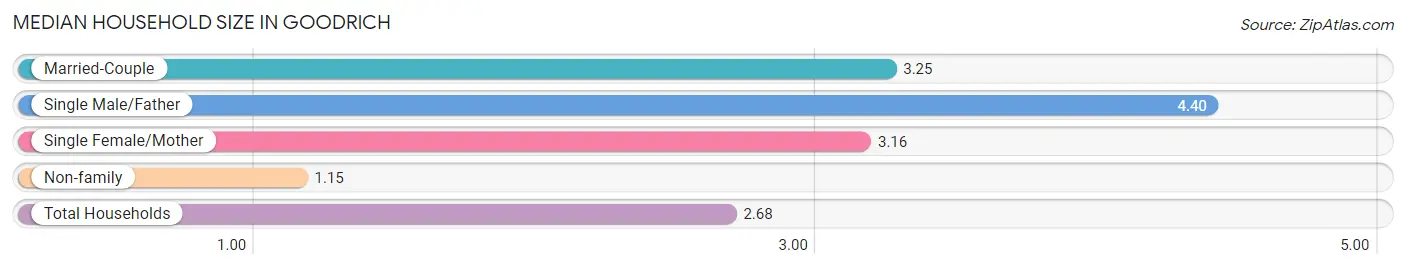
Median Household Size in Goodrich
The median household size in Goodrich is 2.68 persons per household, with single male/father households (5 | 0.7%) accounting for the largest median household size of 4.4 persons per household. non-family households (197 | 27.1%) represent the smallest median household size with 1.15 persons per household.
| Household Type | # Households | Household Size |
| Married-Couple | 424 (58.2%) | 3.25 |
| Single Male/Father | 5 (0.7%) | 4.40 |
| Single Female/Mother | 102 (14.0%) | 3.16 |
| Non-family | 197 (27.1%) | 1.15 |
| Total Households | 728 (100.0%) | 2.68 |
Household Size by Marriage Status in Goodrich
Out of a total of 728 households in Goodrich, 531 (72.9%) are family households, while 197 (27.1%) are nonfamily households. The most numerous type of family households are 2-person households, comprising 214, and the most common type of nonfamily households are 1-person households, comprising 169.
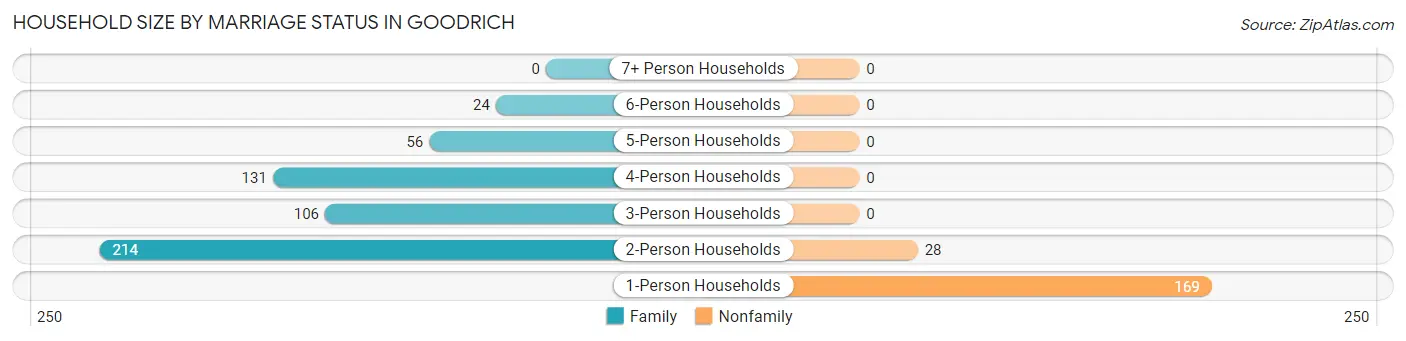
| Household Size | Family Households | Nonfamily Households |
| 1-Person Households | - | 169 (23.2%) |
| 2-Person Households | 214 (29.4%) | 28 (3.8%) |
| 3-Person Households | 106 (14.6%) | 0 (0.0%) |
| 4-Person Households | 131 (18.0%) | 0 (0.0%) |
| 5-Person Households | 56 (7.7%) | 0 (0.0%) |
| 6-Person Households | 24 (3.3%) | 0 (0.0%) |
| 7+ Person Households | 0 (0.0%) | 0 (0.0%) |
| Total | 531 (72.9%) | 197 (27.1%) |
Female Fertility in Goodrich
Fertility by Age in Goodrich
Average fertility rate in Goodrich is 56.0 births per 1,000 women. Women in the age bracket of 20 to 34 years have the highest fertility rate with 91.0 births per 1,000 women. Women in the age bracket of 35 to 50 years acount for 61.9% of all women with births.
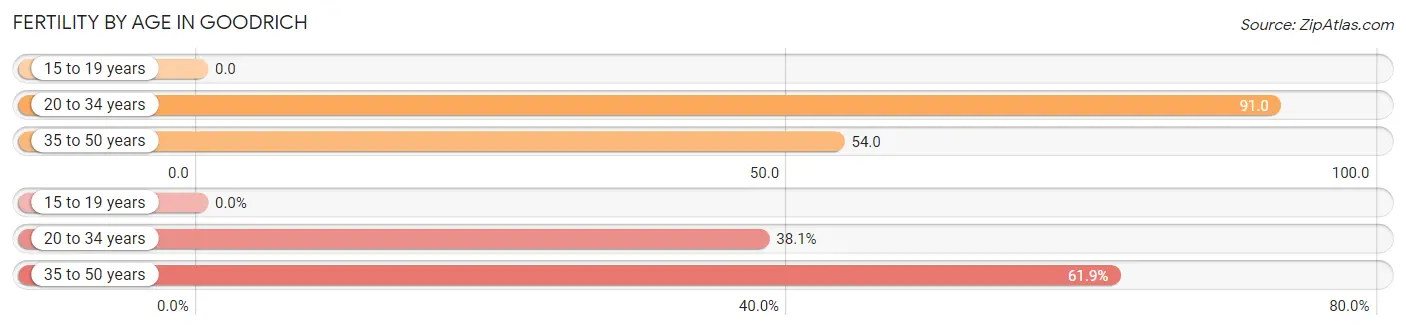
| Age Bracket | Women with Births | Births / 1,000 Women |
| 15 to 19 years | 0 (0.0%) | 0.0 |
| 20 to 34 years | 8 (38.1%) | 91.0 |
| 35 to 50 years | 13 (61.9%) | 54.0 |
| Total | 21 (100.0%) | 56.0 |
Fertility by Age by Marriage Status in Goodrich
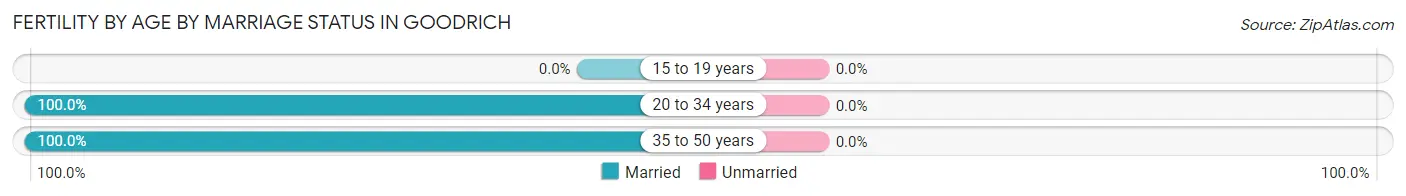
| Age Bracket | Married | Unmarried |
| 15 to 19 years | 0 (0.0%) | 0 (0.0%) |
| 20 to 34 years | 8 (100.0%) | 0 (0.0%) |
| 35 to 50 years | 13 (100.0%) | 0 (0.0%) |
| Total | 21 (100.0%) | 0 (0.0%) |
Fertility by Education in Goodrich
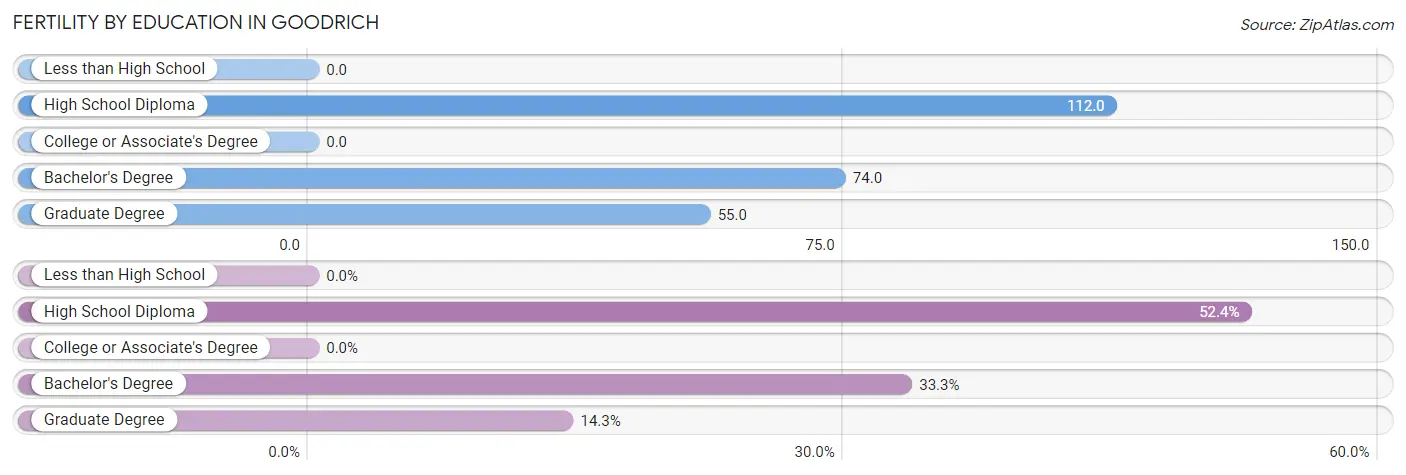
| Educational Attainment | Women with Births | Births / 1,000 Women |
| Less than High School | 0 (0.0%) | 0.0 |
| High School Diploma | 11 (52.4%) | 112.0 |
| College or Associate's Degree | 0 (0.0%) | 0.0 |
| Bachelor's Degree | 7 (33.3%) | 74.0 |
| Graduate Degree | 3 (14.3%) | 55.0 |
| Total | 21 (100.0%) | 56.0 |
Fertility by Education by Marriage Status in Goodrich
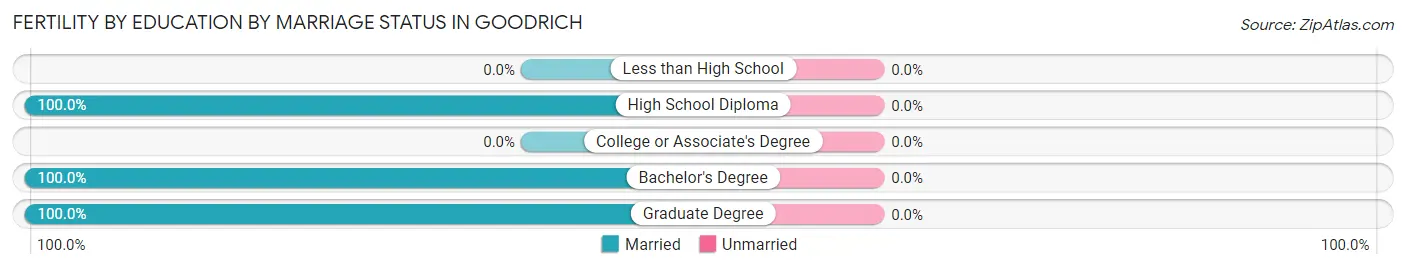
| Educational Attainment | Married | Unmarried |
| Less than High School | 0 (0.0%) | 0 (0.0%) |
| High School Diploma | 11 (100.0%) | 0 (0.0%) |
| College or Associate's Degree | 0 (0.0%) | 0 (0.0%) |
| Bachelor's Degree | 7 (100.0%) | 0 (0.0%) |
| Graduate Degree | 3 (100.0%) | 0 (0.0%) |
| Total | 21 (100.0%) | 0 (0.0%) |
Employment Characteristics in Goodrich
Employment by Class of Employer in Goodrich
Among the 894 employed individuals in Goodrich, private company employees (596 | 66.7%), not-for-profit organizations (96 | 10.7%), and local government employees (90 | 10.1%) make up the most common classes of employment.
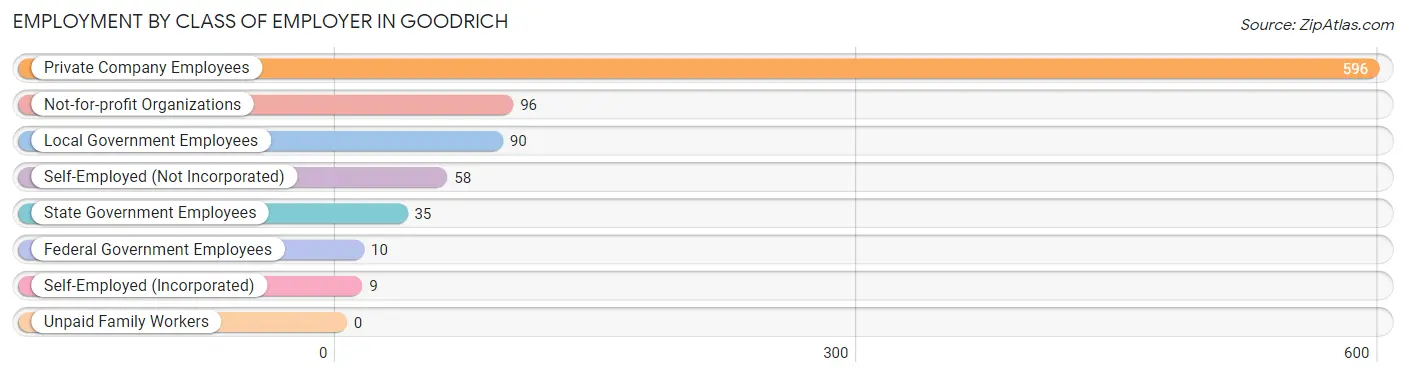
| Employer Class | # Employees | % Employees |
| Private Company Employees | 596 | 66.7% |
| Self-Employed (Incorporated) | 9 | 1.0% |
| Self-Employed (Not Incorporated) | 58 | 6.5% |
| Not-for-profit Organizations | 96 | 10.7% |
| Local Government Employees | 90 | 10.1% |
| State Government Employees | 35 | 3.9% |
| Federal Government Employees | 10 | 1.1% |
| Unpaid Family Workers | 0 | 0.0% |
| Total | 894 | 100.0% |
Employment Status by Age in Goodrich
According to the labor force statistics for Goodrich, out of the total population over 16 years of age (1,504), 66.8% or 1,005 individuals are in the labor force, with 9.0% or 90 of them unemployed. The age group with the highest labor force participation rate is 45 to 54 years, with 89.4% or 313 individuals in the labor force. Within the labor force, the 60 to 64 years age range has the highest percentage of unemployed individuals, with 57.0% or 49 of them being unemployed.
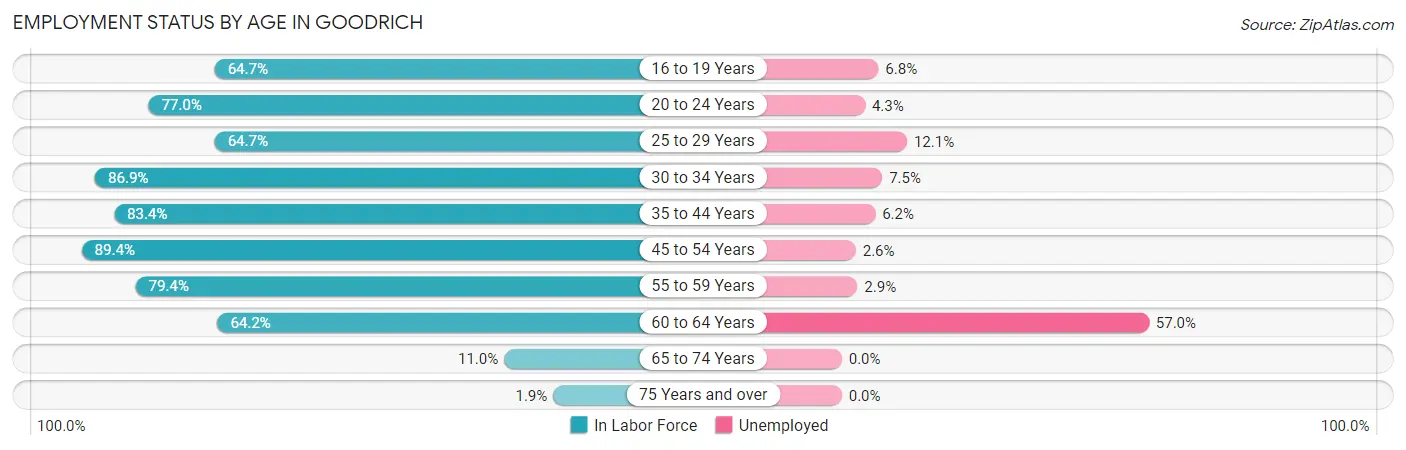
| Age Bracket | In Labor Force | Unemployed |
| 16 to 19 Years | 44 (64.7%) | 3 (6.8%) |
| 20 to 24 Years | 94 (77.0%) | 4 (4.3%) |
| 25 to 29 Years | 33 (64.7%) | 4 (12.1%) |
| 30 to 34 Years | 53 (86.9%) | 4 (7.5%) |
| 35 to 44 Years | 226 (83.4%) | 14 (6.2%) |
| 45 to 54 Years | 313 (89.4%) | 8 (2.6%) |
| 55 to 59 Years | 139 (79.4%) | 4 (2.9%) |
| 60 to 64 Years | 86 (64.2%) | 49 (57.0%) |
| 65 to 74 Years | 13 (11.0%) | 0 (0.0%) |
| 75 Years and over | 3 (1.9%) | 0 (0.0%) |
| Total | 1,005 (66.8%) | 90 (9.0%) |
Employment Status by Educational Attainment in Goodrich
According to labor force statistics for Goodrich, 81.6% of individuals (850) out of the total population between 25 and 64 years of age (1,042) are in the labor force, with 9.8% or 83 of them being unemployed. The group with the highest labor force participation rate are those with the educational attainment of bachelor's degree or higher, with 89.9% or 339 individuals in the labor force. Within the labor force, individuals with college / associate degree education have the highest percentage of unemployment, with 16.1% or 64 of them being unemployed.
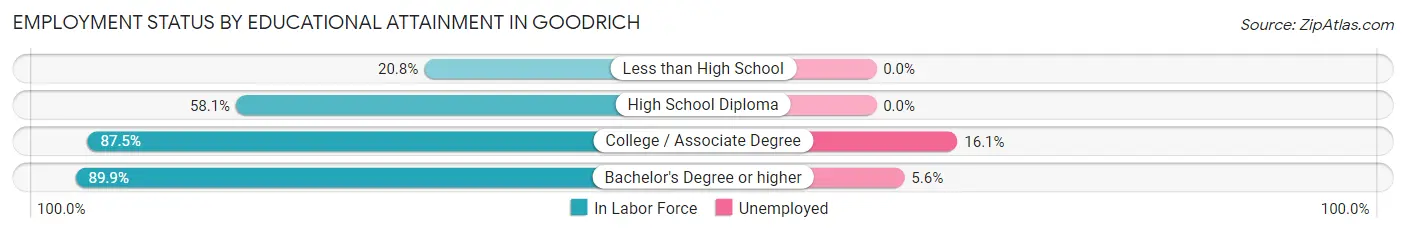
| Educational Attainment | In Labor Force | Unemployed |
| Less than High School | 5 (20.8%) | 0 (0.0%) |
| High School Diploma | 108 (58.1%) | 0 (0.0%) |
| College / Associate Degree | 398 (87.5%) | 73 (16.1%) |
| Bachelor's Degree or higher | 339 (89.9%) | 21 (5.6%) |
| Total | 850 (81.6%) | 102 (9.8%) |
Employment Occupations by Sex in Goodrich
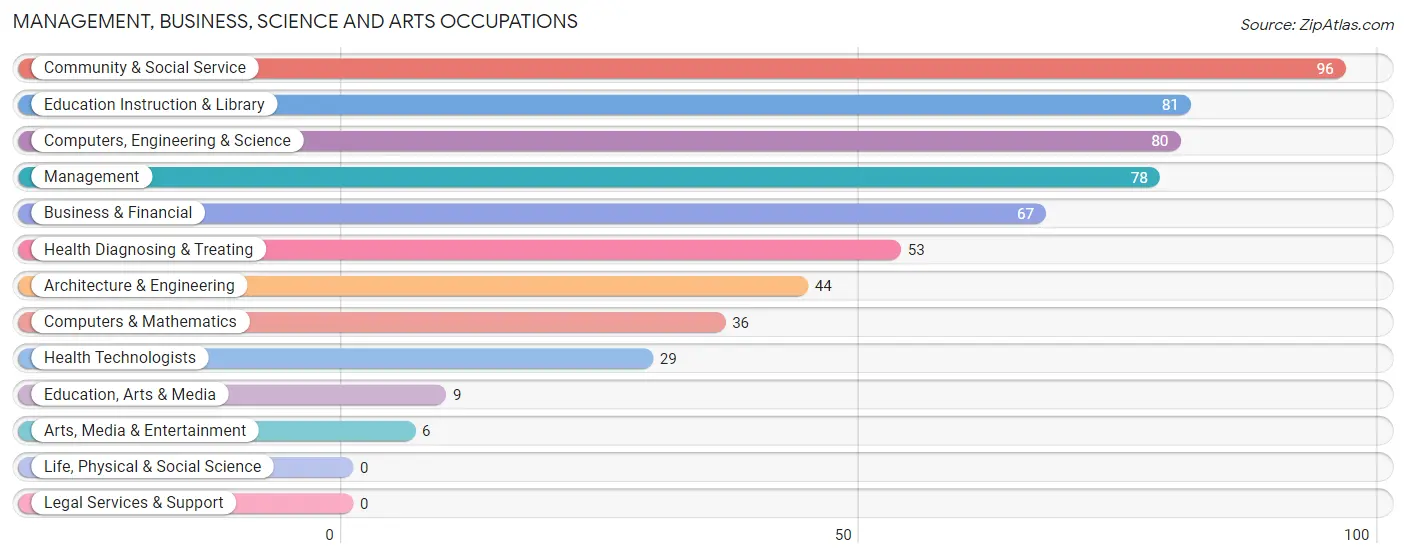
Management, Business, Science and Arts Occupations
The most common Management, Business, Science and Arts occupations in Goodrich are Community & Social Service (96 | 10.5%), Education Instruction & Library (81 | 8.9%), Computers, Engineering & Science (80 | 8.7%), Management (78 | 8.5%), and Business & Financial (67 | 7.3%).
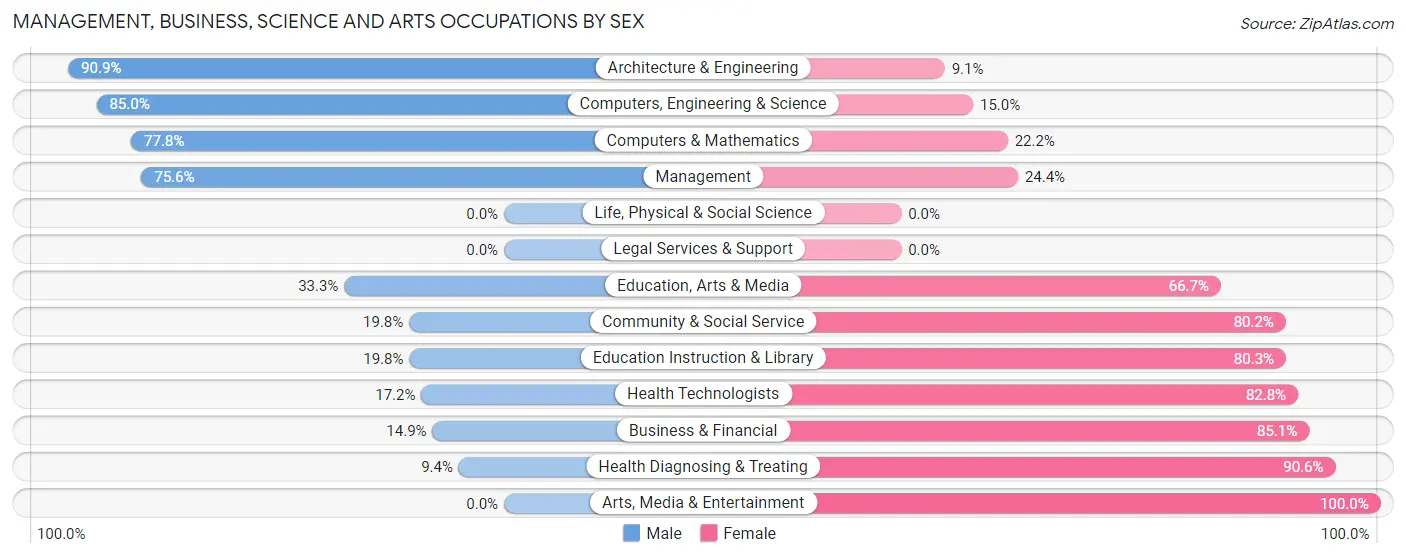
Management, Business, Science and Arts Occupations by Sex
Within the Management, Business, Science and Arts occupations in Goodrich, the most male-oriented occupations are Architecture & Engineering (90.9%), Computers, Engineering & Science (85.0%), and Computers & Mathematics (77.8%), while the most female-oriented occupations are Arts, Media & Entertainment (100.0%), Health Diagnosing & Treating (90.6%), and Business & Financial (85.1%).
| Occupation | Male | Female |
| Management | 59 (75.6%) | 19 (24.4%) |
| Business & Financial | 10 (14.9%) | 57 (85.1%) |
| Computers, Engineering & Science | 68 (85.0%) | 12 (15.0%) |
| Computers & Mathematics | 28 (77.8%) | 8 (22.2%) |
| Architecture & Engineering | 40 (90.9%) | 4 (9.1%) |
| Life, Physical & Social Science | 0 (0.0%) | 0 (0.0%) |
| Community & Social Service | 19 (19.8%) | 77 (80.2%) |
| Education, Arts & Media | 3 (33.3%) | 6 (66.7%) |
| Legal Services & Support | 0 (0.0%) | 0 (0.0%) |
| Education Instruction & Library | 16 (19.8%) | 65 (80.2%) |
| Arts, Media & Entertainment | 0 (0.0%) | 6 (100.0%) |
| Health Diagnosing & Treating | 5 (9.4%) | 48 (90.6%) |
| Health Technologists | 5 (17.2%) | 24 (82.8%) |
| Total (Category) | 161 (43.0%) | 213 (57.0%) |
| Total (Overall) | 479 (52.4%) | 435 (47.6%) |
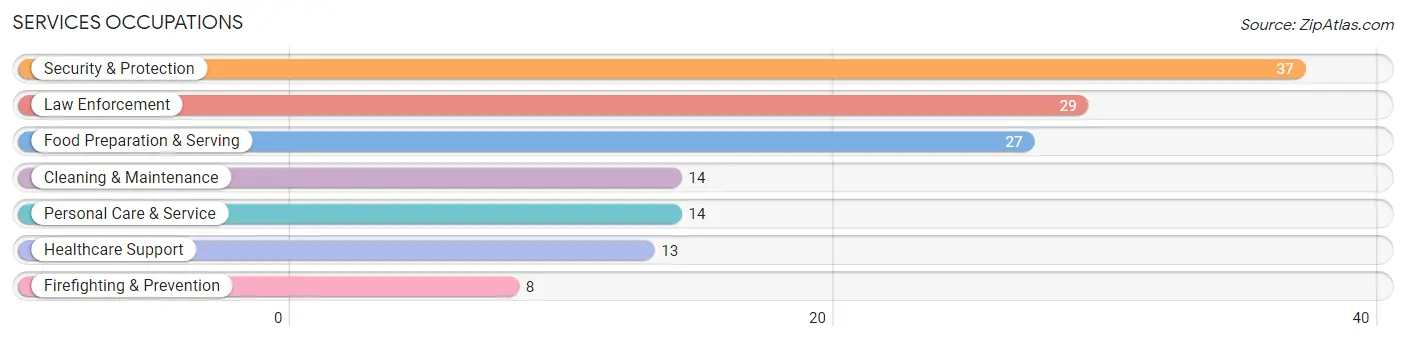
Services Occupations
The most common Services occupations in Goodrich are Security & Protection (37 | 4.1%), Law Enforcement (29 | 3.2%), Food Preparation & Serving (27 | 2.9%), Cleaning & Maintenance (14 | 1.5%), and Personal Care & Service (14 | 1.5%).
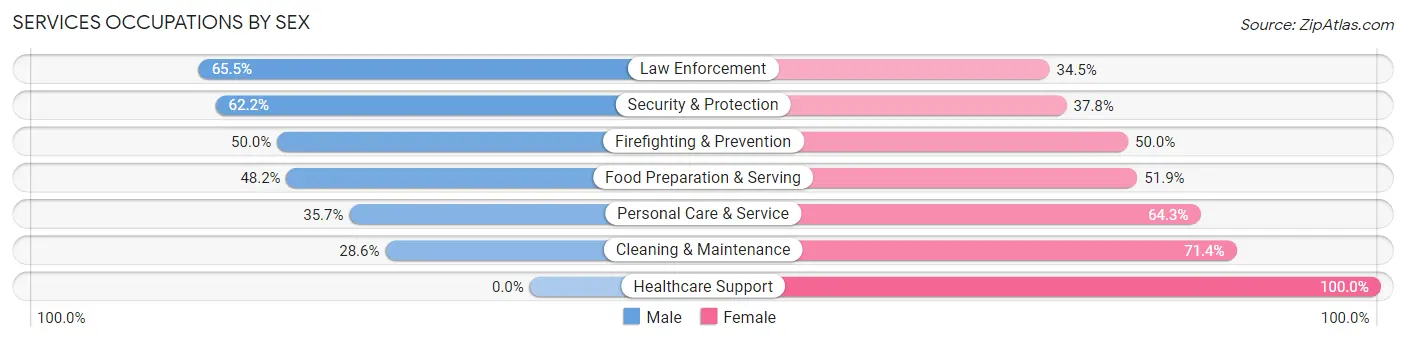
Services Occupations by Sex
Within the Services occupations in Goodrich, the most male-oriented occupations are Law Enforcement (65.5%), Security & Protection (62.2%), and Firefighting & Prevention (50.0%), while the most female-oriented occupations are Healthcare Support (100.0%), Cleaning & Maintenance (71.4%), and Personal Care & Service (64.3%).
| Occupation | Male | Female |
| Healthcare Support | 0 (0.0%) | 13 (100.0%) |
| Security & Protection | 23 (62.2%) | 14 (37.8%) |
| Firefighting & Prevention | 4 (50.0%) | 4 (50.0%) |
| Law Enforcement | 19 (65.5%) | 10 (34.5%) |
| Food Preparation & Serving | 13 (48.1%) | 14 (51.8%) |
| Cleaning & Maintenance | 4 (28.6%) | 10 (71.4%) |
| Personal Care & Service | 5 (35.7%) | 9 (64.3%) |
| Total (Category) | 45 (42.9%) | 60 (57.1%) |
| Total (Overall) | 479 (52.4%) | 435 (47.6%) |
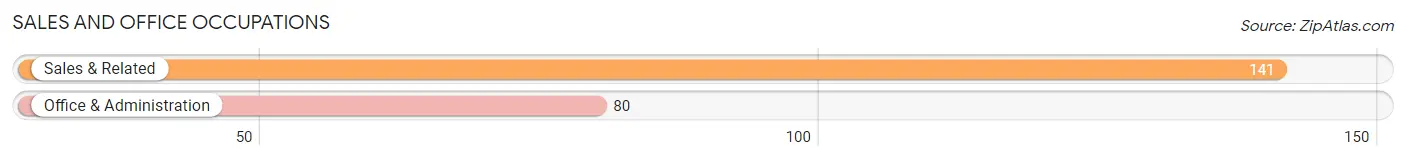
Sales and Office Occupations
The most common Sales and Office occupations in Goodrich are Sales & Related (141 | 15.4%), and Office & Administration (80 | 8.7%).
Sales and Office Occupations by Sex
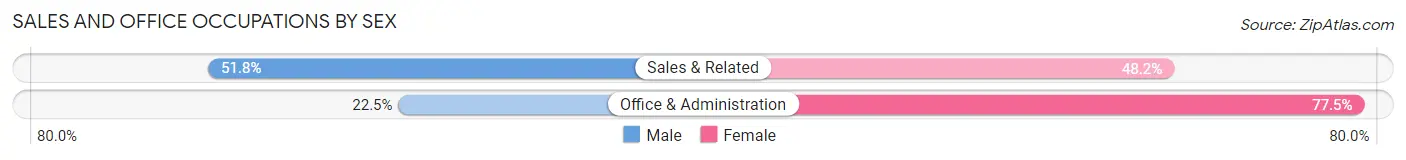
| Occupation | Male | Female |
| Sales & Related | 73 (51.8%) | 68 (48.2%) |
| Office & Administration | 18 (22.5%) | 62 (77.5%) |
| Total (Category) | 91 (41.2%) | 130 (58.8%) |
| Total (Overall) | 479 (52.4%) | 435 (47.6%) |
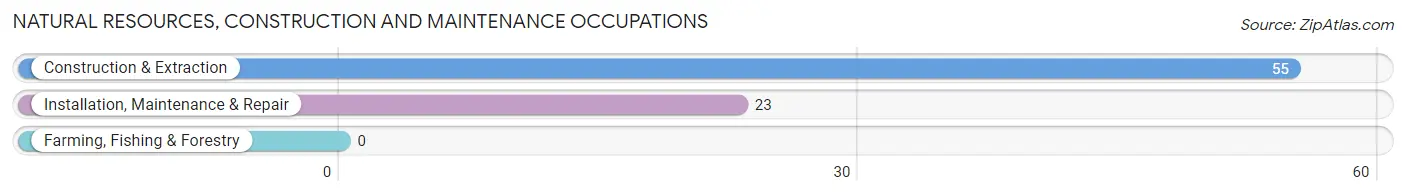
Natural Resources, Construction and Maintenance Occupations
The most common Natural Resources, Construction and Maintenance occupations in Goodrich are Construction & Extraction (55 | 6.0%), and Installation, Maintenance & Repair (23 | 2.5%).
Natural Resources, Construction and Maintenance Occupations by Sex
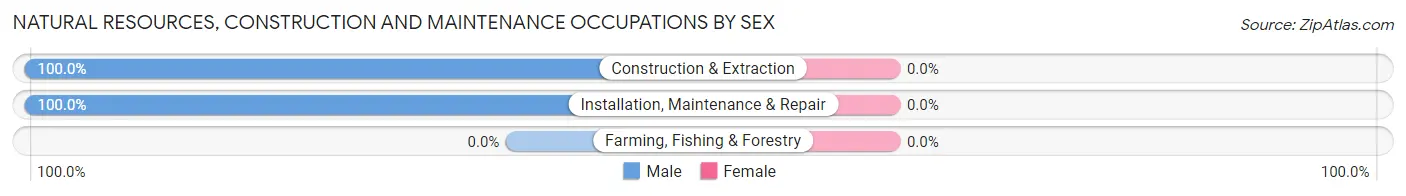
| Occupation | Male | Female |
| Farming, Fishing & Forestry | 0 (0.0%) | 0 (0.0%) |
| Construction & Extraction | 55 (100.0%) | 0 (0.0%) |
| Installation, Maintenance & Repair | 23 (100.0%) | 0 (0.0%) |
| Total (Category) | 78 (100.0%) | 0 (0.0%) |
| Total (Overall) | 479 (52.4%) | 435 (47.6%) |
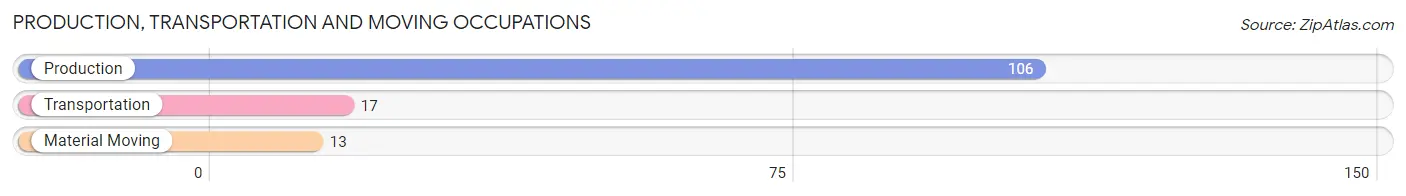
Production, Transportation and Moving Occupations
The most common Production, Transportation and Moving occupations in Goodrich are Production (106 | 11.6%), Transportation (17 | 1.9%), and Material Moving (13 | 1.4%).
Production, Transportation and Moving Occupations by Sex
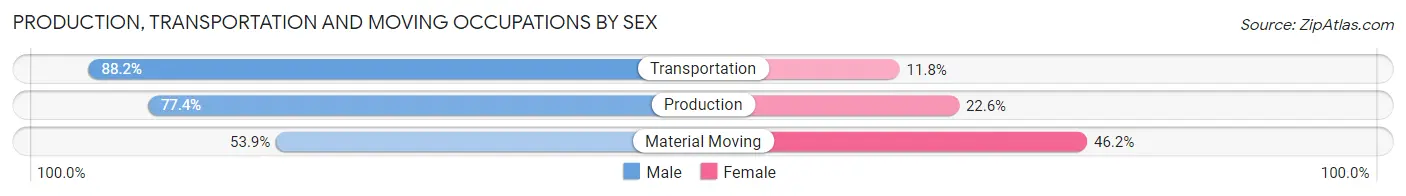
| Occupation | Male | Female |
| Production | 82 (77.4%) | 24 (22.6%) |
| Transportation | 15 (88.2%) | 2 (11.8%) |
| Material Moving | 7 (53.8%) | 6 (46.2%) |
| Total (Category) | 104 (76.5%) | 32 (23.5%) |
| Total (Overall) | 479 (52.4%) | 435 (47.6%) |
Employment Industries by Sex in Goodrich
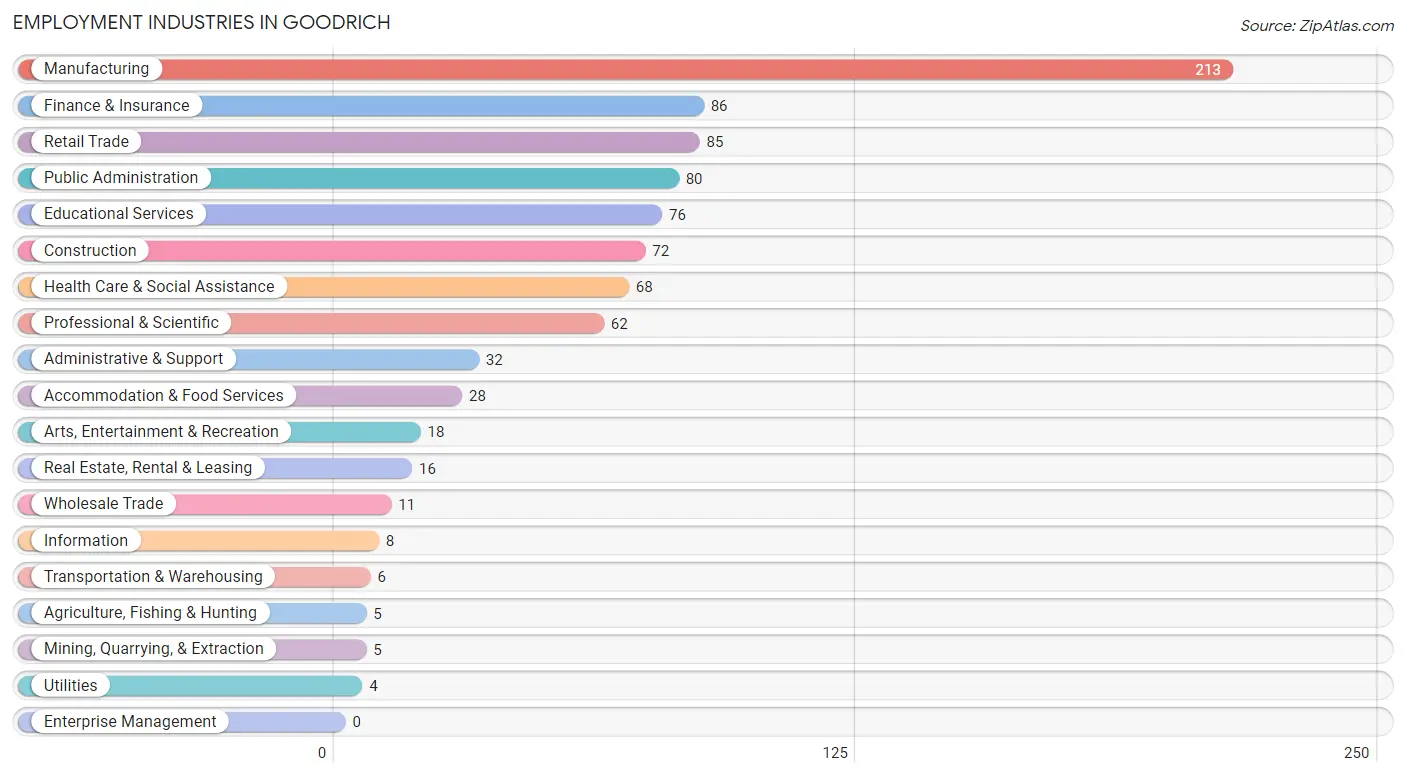
Employment Industries in Goodrich
The major employment industries in Goodrich include Manufacturing (213 | 23.3%), Finance & Insurance (86 | 9.4%), Retail Trade (85 | 9.3%), Public Administration (80 | 8.7%), and Educational Services (76 | 8.3%).
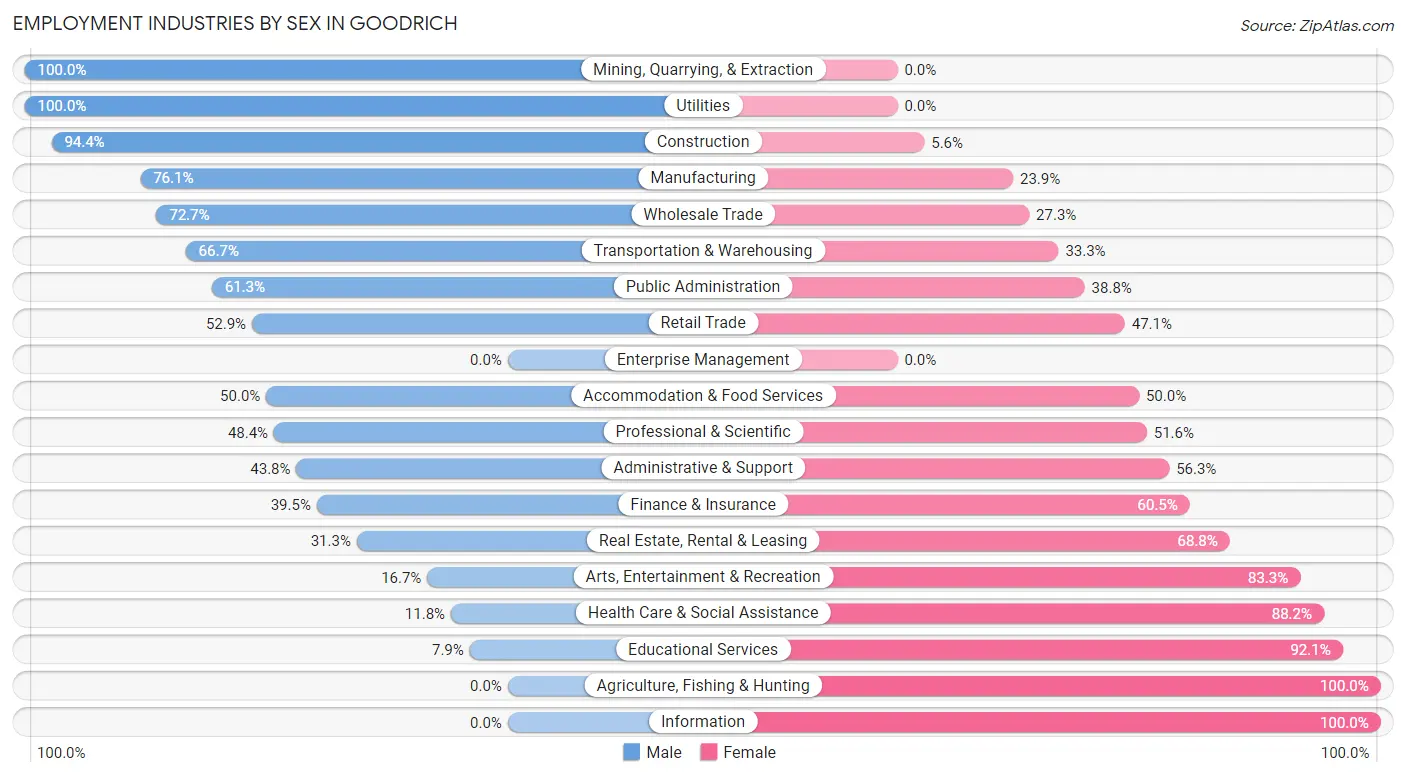
Employment Industries by Sex in Goodrich
The Goodrich industries that see more men than women are Mining, Quarrying, & Extraction (100.0%), Utilities (100.0%), and Construction (94.4%), whereas the industries that tend to have a higher number of women are Agriculture, Fishing & Hunting (100.0%), Information (100.0%), and Educational Services (92.1%).
| Industry | Male | Female |
| Agriculture, Fishing & Hunting | 0 (0.0%) | 5 (100.0%) |
| Mining, Quarrying, & Extraction | 5 (100.0%) | 0 (0.0%) |
| Construction | 68 (94.4%) | 4 (5.6%) |
| Manufacturing | 162 (76.1%) | 51 (23.9%) |
| Wholesale Trade | 8 (72.7%) | 3 (27.3%) |
| Retail Trade | 45 (52.9%) | 40 (47.1%) |
| Transportation & Warehousing | 4 (66.7%) | 2 (33.3%) |
| Utilities | 4 (100.0%) | 0 (0.0%) |
| Information | 0 (0.0%) | 8 (100.0%) |
| Finance & Insurance | 34 (39.5%) | 52 (60.5%) |
| Real Estate, Rental & Leasing | 5 (31.2%) | 11 (68.8%) |
| Professional & Scientific | 30 (48.4%) | 32 (51.6%) |
| Enterprise Management | 0 (0.0%) | 0 (0.0%) |
| Administrative & Support | 14 (43.8%) | 18 (56.2%) |
| Educational Services | 6 (7.9%) | 70 (92.1%) |
| Health Care & Social Assistance | 8 (11.8%) | 60 (88.2%) |
| Arts, Entertainment & Recreation | 3 (16.7%) | 15 (83.3%) |
| Accommodation & Food Services | 14 (50.0%) | 14 (50.0%) |
| Public Administration | 49 (61.3%) | 31 (38.8%) |
| Total | 479 (52.4%) | 435 (47.6%) |
Education in Goodrich
School Enrollment in Goodrich
The most common levels of schooling among the 464 students in Goodrich are middle school (148 | 31.9%), elementary school (88 | 19.0%), and high school (83 | 17.9%).
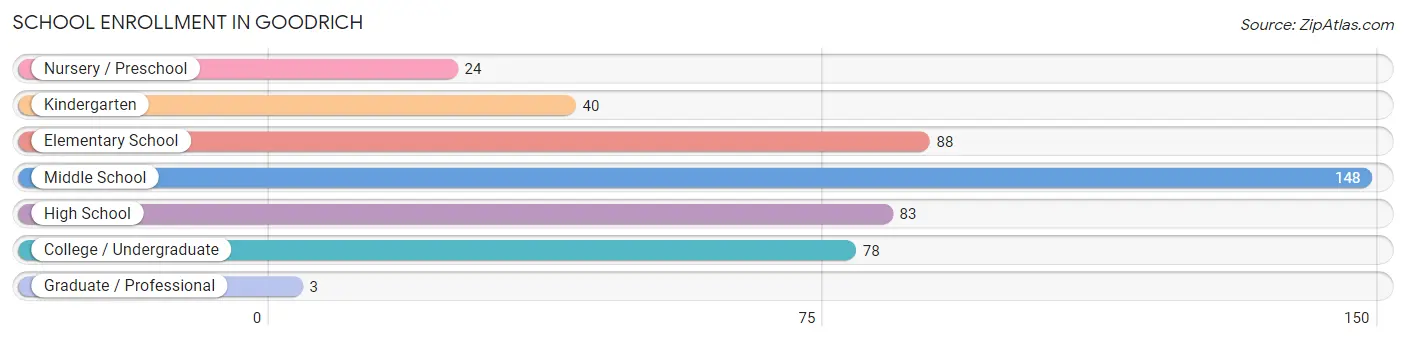
| School Level | # Students | % Students |
| Nursery / Preschool | 24 | 5.2% |
| Kindergarten | 40 | 8.6% |
| Elementary School | 88 | 19.0% |
| Middle School | 148 | 31.9% |
| High School | 83 | 17.9% |
| College / Undergraduate | 78 | 16.8% |
| Graduate / Professional | 3 | 0.6% |
| Total | 464 | 100.0% |
School Enrollment by Age by Funding Source in Goodrich
Out of a total of 464 students who are enrolled in schools in Goodrich, 30 (6.5%) attend a private institution, while the remaining 434 (93.5%) are enrolled in public schools. The age group of 25 to 34 year olds has the highest likelihood of being enrolled in private schools, with 6 (75.0% in the age bracket) enrolled. Conversely, the age group of 3 to 4 year olds has the lowest likelihood of being enrolled in a private school, with 22 (100.0% in the age bracket) attending a public institution.
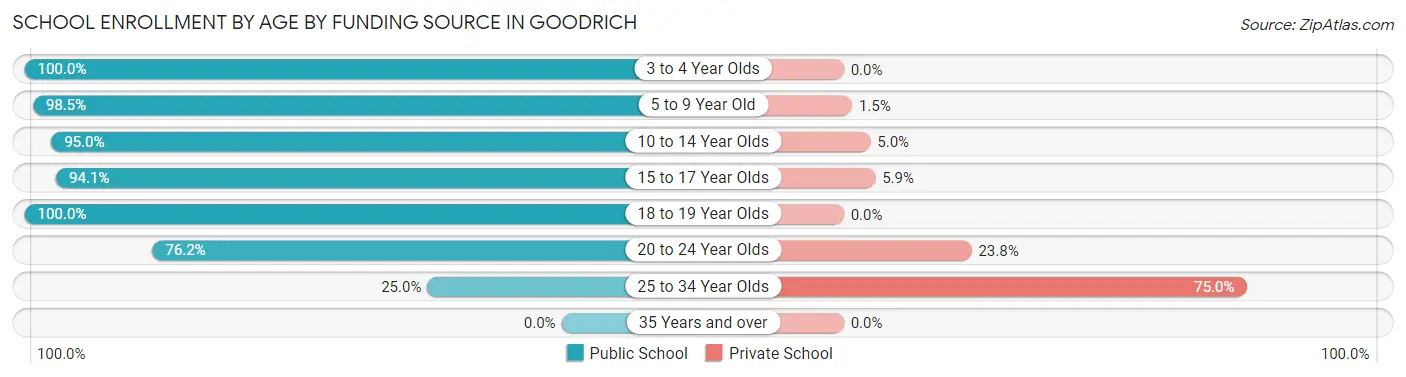
| Age Bracket | Public School | Private School |
| 3 to 4 Year Olds | 22 (100.0%) | 0 (0.0%) |
| 5 to 9 Year Old | 128 (98.5%) | 2 (1.5%) |
| 10 to 14 Year Olds | 172 (95.0%) | 9 (5.0%) |
| 15 to 17 Year Olds | 48 (94.1%) | 3 (5.9%) |
| 18 to 19 Year Olds | 30 (100.0%) | 0 (0.0%) |
| 20 to 24 Year Olds | 32 (76.2%) | 10 (23.8%) |
| 25 to 34 Year Olds | 2 (25.0%) | 6 (75.0%) |
| 35 Years and over | 0 (0.0%) | 0 (0.0%) |
| Total | 434 (93.5%) | 30 (6.5%) |
Educational Attainment by Field of Study in Goodrich
Business (106 | 21.7%), education (69 | 14.1%), engineering (60 | 12.3%), arts & humanities (60 | 12.3%), and science & technology (56 | 11.5%) are the most common fields of study among 489 individuals in Goodrich who have obtained a bachelor's degree or higher.
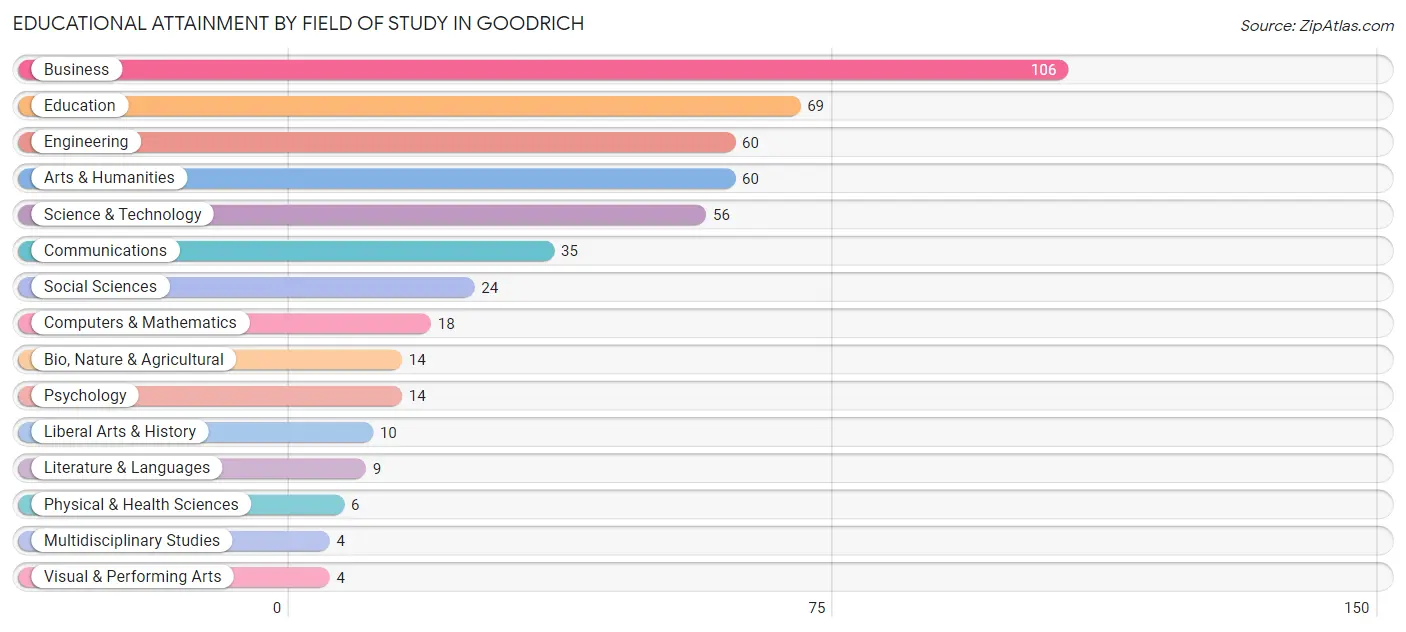
| Field of Study | # Graduates | % Graduates |
| Computers & Mathematics | 18 | 3.7% |
| Bio, Nature & Agricultural | 14 | 2.9% |
| Physical & Health Sciences | 6 | 1.2% |
| Psychology | 14 | 2.9% |
| Social Sciences | 24 | 4.9% |
| Engineering | 60 | 12.3% |
| Multidisciplinary Studies | 4 | 0.8% |
| Science & Technology | 56 | 11.5% |
| Business | 106 | 21.7% |
| Education | 69 | 14.1% |
| Literature & Languages | 9 | 1.8% |
| Liberal Arts & History | 10 | 2.0% |
| Visual & Performing Arts | 4 | 0.8% |
| Communications | 35 | 7.2% |
| Arts & Humanities | 60 | 12.3% |
| Total | 489 | 100.0% |
Transportation & Commute in Goodrich
Vehicle Availability by Sex in Goodrich
The most prevalent vehicle ownership categories in Goodrich are males with 2 vehicles (235, accounting for 50.1%) and females with 2 vehicles (234, making up 55.4%).
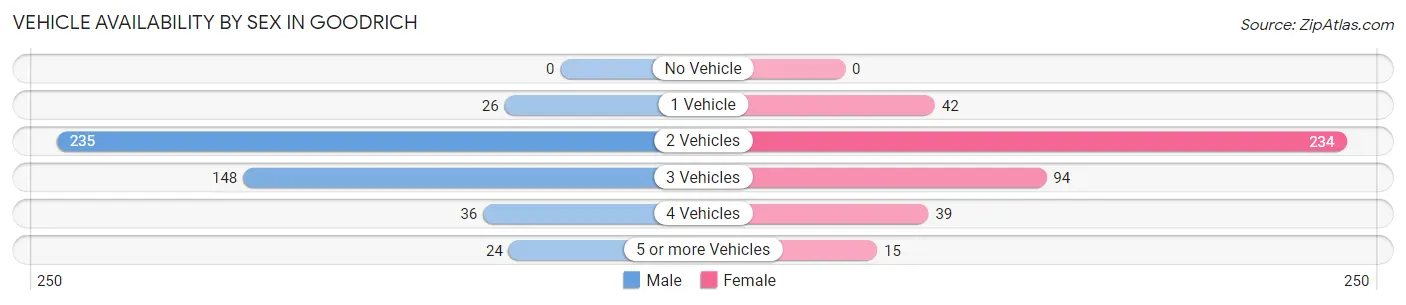
| Vehicles Available | Male | Female |
| No Vehicle | 0 (0.0%) | 0 (0.0%) |
| 1 Vehicle | 26 (5.5%) | 42 (9.9%) |
| 2 Vehicles | 235 (50.1%) | 234 (55.2%) |
| 3 Vehicles | 148 (31.6%) | 94 (22.2%) |
| 4 Vehicles | 36 (7.7%) | 39 (9.2%) |
| 5 or more Vehicles | 24 (5.1%) | 15 (3.5%) |
| Total | 469 (100.0%) | 424 (100.0%) |
Commute Time in Goodrich
The most frequently occuring commute durations in Goodrich are 45 to 59 minutes (111 commuters, 14.7%), 30 to 34 minutes (102 commuters, 13.5%), and 25 to 29 minutes (92 commuters, 12.2%).
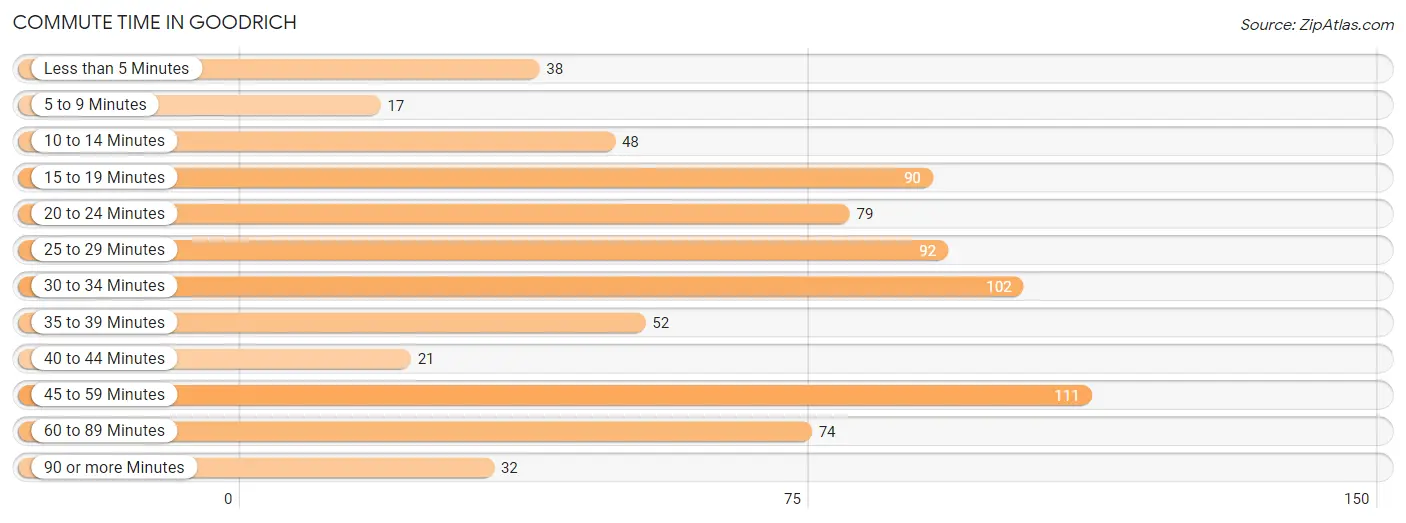
| Commute Time | # Commuters | % Commuters |
| Less than 5 Minutes | 38 | 5.0% |
| 5 to 9 Minutes | 17 | 2.2% |
| 10 to 14 Minutes | 48 | 6.4% |
| 15 to 19 Minutes | 90 | 11.9% |
| 20 to 24 Minutes | 79 | 10.4% |
| 25 to 29 Minutes | 92 | 12.2% |
| 30 to 34 Minutes | 102 | 13.5% |
| 35 to 39 Minutes | 52 | 6.9% |
| 40 to 44 Minutes | 21 | 2.8% |
| 45 to 59 Minutes | 111 | 14.7% |
| 60 to 89 Minutes | 74 | 9.8% |
| 90 or more Minutes | 32 | 4.2% |
Commute Time by Sex in Goodrich
The most common commute times in Goodrich are 45 to 59 minutes (82 commuters, 19.9%) for males and 30 to 34 minutes (62 commuters, 18.0%) for females.
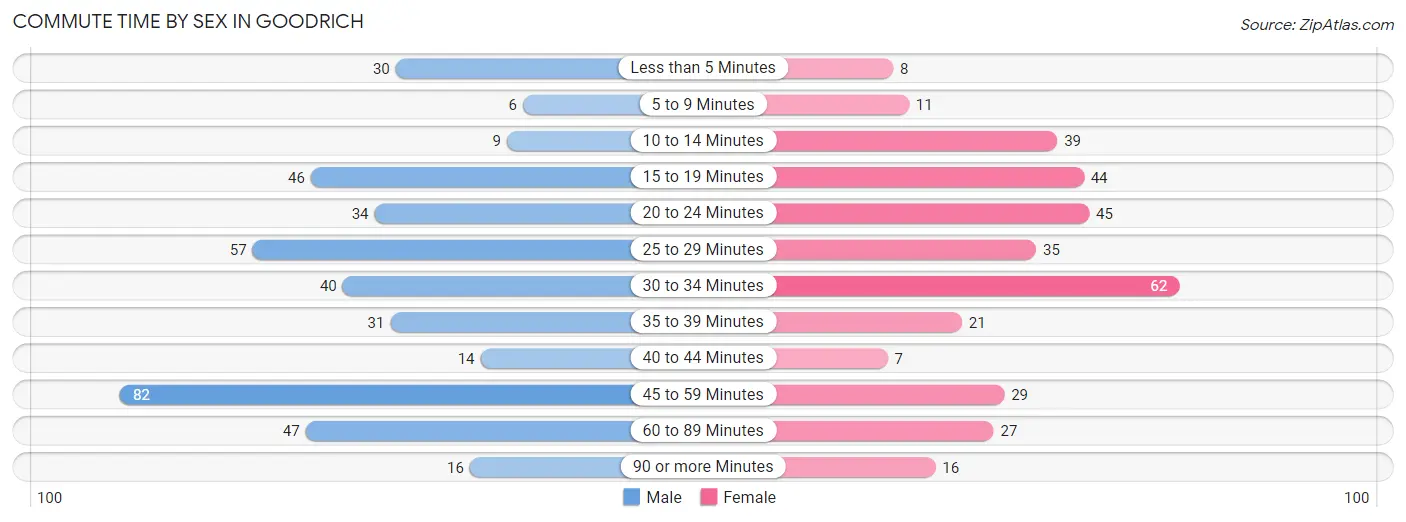
| Commute Time | Male | Female |
| Less than 5 Minutes | 30 (7.3%) | 8 (2.3%) |
| 5 to 9 Minutes | 6 (1.5%) | 11 (3.2%) |
| 10 to 14 Minutes | 9 (2.2%) | 39 (11.3%) |
| 15 to 19 Minutes | 46 (11.2%) | 44 (12.8%) |
| 20 to 24 Minutes | 34 (8.3%) | 45 (13.1%) |
| 25 to 29 Minutes | 57 (13.8%) | 35 (10.2%) |
| 30 to 34 Minutes | 40 (9.7%) | 62 (18.0%) |
| 35 to 39 Minutes | 31 (7.5%) | 21 (6.1%) |
| 40 to 44 Minutes | 14 (3.4%) | 7 (2.0%) |
| 45 to 59 Minutes | 82 (19.9%) | 29 (8.4%) |
| 60 to 89 Minutes | 47 (11.4%) | 27 (7.9%) |
| 90 or more Minutes | 16 (3.9%) | 16 (4.6%) |
Time of Departure to Work by Sex in Goodrich
The most frequent times of departure to work in Goodrich are 6:00 AM to 6:29 AM (85, 20.6%) for males and 8:00 AM to 8:29 AM (70, 20.3%) for females.
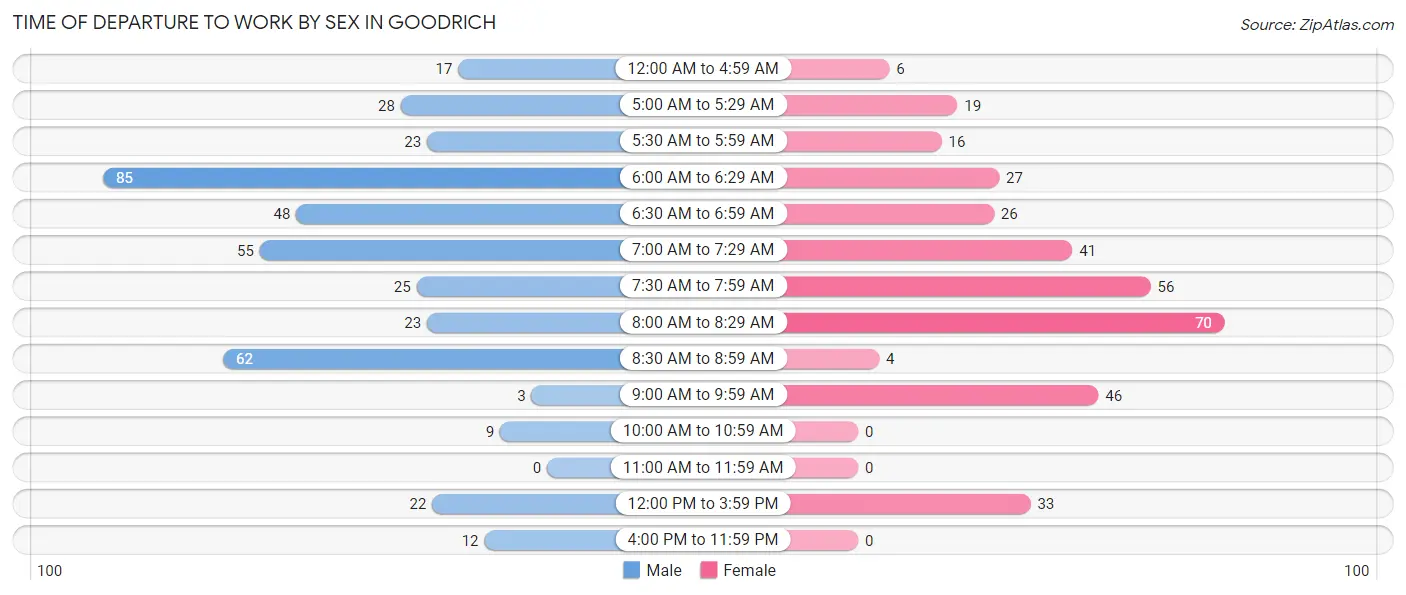
| Time of Departure | Male | Female |
| 12:00 AM to 4:59 AM | 17 (4.1%) | 6 (1.7%) |
| 5:00 AM to 5:29 AM | 28 (6.8%) | 19 (5.5%) |
| 5:30 AM to 5:59 AM | 23 (5.6%) | 16 (4.6%) |
| 6:00 AM to 6:29 AM | 85 (20.6%) | 27 (7.9%) |
| 6:30 AM to 6:59 AM | 48 (11.7%) | 26 (7.6%) |
| 7:00 AM to 7:29 AM | 55 (13.4%) | 41 (11.9%) |
| 7:30 AM to 7:59 AM | 25 (6.1%) | 56 (16.3%) |
| 8:00 AM to 8:29 AM | 23 (5.6%) | 70 (20.3%) |
| 8:30 AM to 8:59 AM | 62 (15.0%) | 4 (1.2%) |
| 9:00 AM to 9:59 AM | 3 (0.7%) | 46 (13.4%) |
| 10:00 AM to 10:59 AM | 9 (2.2%) | 0 (0.0%) |
| 11:00 AM to 11:59 AM | 0 (0.0%) | 0 (0.0%) |
| 12:00 PM to 3:59 PM | 22 (5.3%) | 33 (9.6%) |
| 4:00 PM to 11:59 PM | 12 (2.9%) | 0 (0.0%) |
| Total | 412 (100.0%) | 344 (100.0%) |
Housing Occupancy in Goodrich
Occupancy by Ownership in Goodrich
Of the total 728 dwellings in Goodrich, owner-occupied units account for 685 (94.1%), while renter-occupied units make up 43 (5.9%).
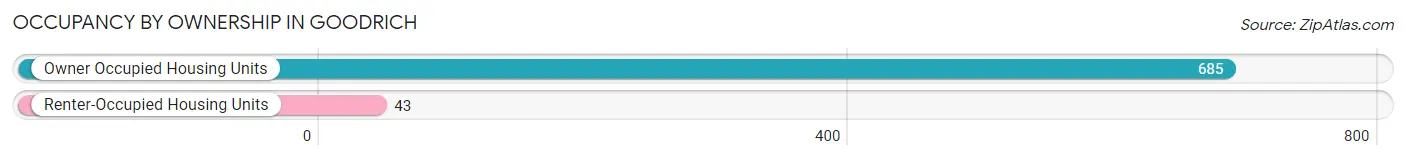
| Occupancy | # Housing Units | % Housing Units |
| Owner Occupied Housing Units | 685 | 94.1% |
| Renter-Occupied Housing Units | 43 | 5.9% |
| Total Occupied Housing Units | 728 | 100.0% |
Occupancy by Household Size in Goodrich
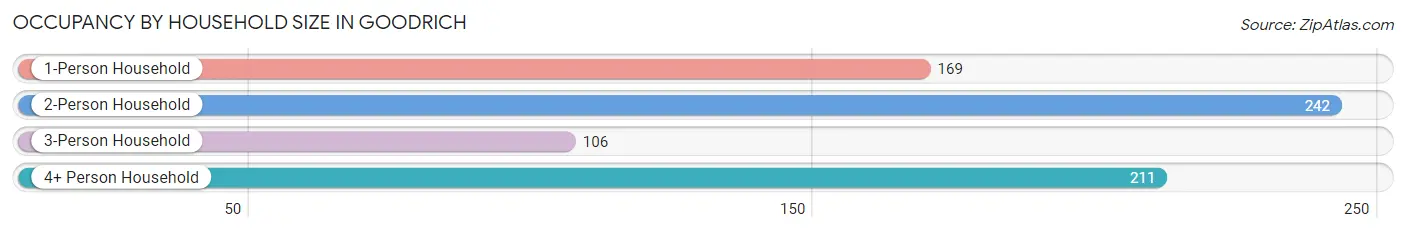
| Household Size | # Housing Units | % Housing Units |
| 1-Person Household | 169 | 23.2% |
| 2-Person Household | 242 | 33.2% |
| 3-Person Household | 106 | 14.6% |
| 4+ Person Household | 211 | 29.0% |
| Total Housing Units | 728 | 100.0% |
Occupancy by Ownership by Household Size in Goodrich
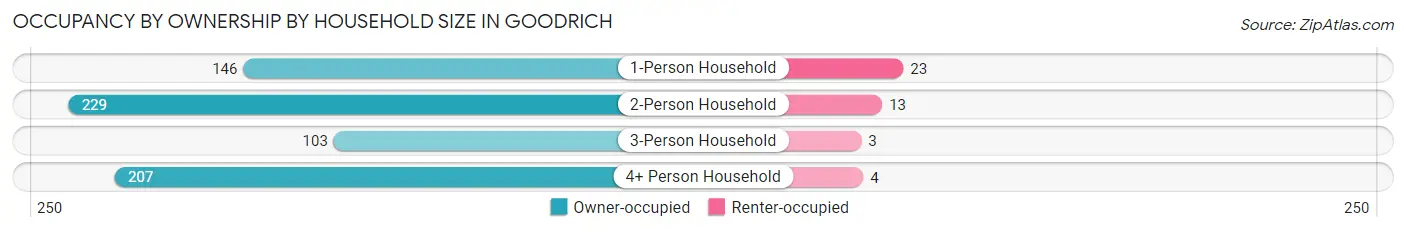
| Household Size | Owner-occupied | Renter-occupied |
| 1-Person Household | 146 (86.4%) | 23 (13.6%) |
| 2-Person Household | 229 (94.6%) | 13 (5.4%) |
| 3-Person Household | 103 (97.2%) | 3 (2.8%) |
| 4+ Person Household | 207 (98.1%) | 4 (1.9%) |
| Total Housing Units | 685 (94.1%) | 43 (5.9%) |
Occupancy by Educational Attainment in Goodrich
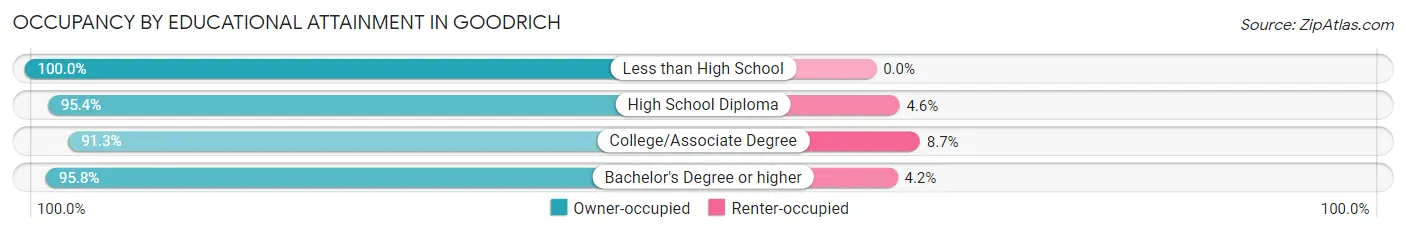
| Household Size | Owner-occupied | Renter-occupied |
| Less than High School | 14 (100.0%) | 0 (0.0%) |
| High School Diploma | 124 (95.4%) | 6 (4.6%) |
| College/Associate Degree | 253 (91.3%) | 24 (8.7%) |
| Bachelor's Degree or higher | 294 (95.8%) | 13 (4.2%) |
Occupancy by Age of Householder in Goodrich
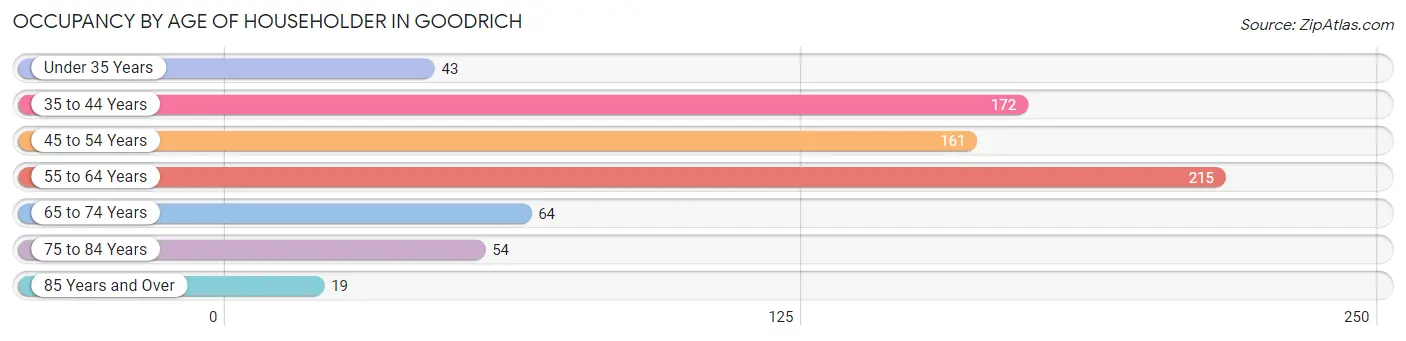
| Age Bracket | # Households | % Households |
| Under 35 Years | 43 | 5.9% |
| 35 to 44 Years | 172 | 23.6% |
| 45 to 54 Years | 161 | 22.1% |
| 55 to 64 Years | 215 | 29.5% |
| 65 to 74 Years | 64 | 8.8% |
| 75 to 84 Years | 54 | 7.4% |
| 85 Years and Over | 19 | 2.6% |
| Total | 728 | 100.0% |
Housing Finances in Goodrich
Median Income by Occupancy in Goodrich
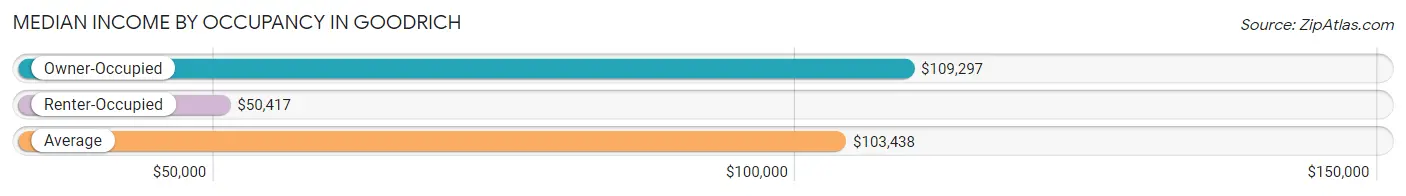
| Occupancy Type | # Households | Median Income |
| Owner-Occupied | 685 (94.1%) | $109,297 |
| Renter-Occupied | 43 (5.9%) | $50,417 |
| Average | 728 (100.0%) | $103,438 |
Occupancy by Householder Income Bracket in Goodrich
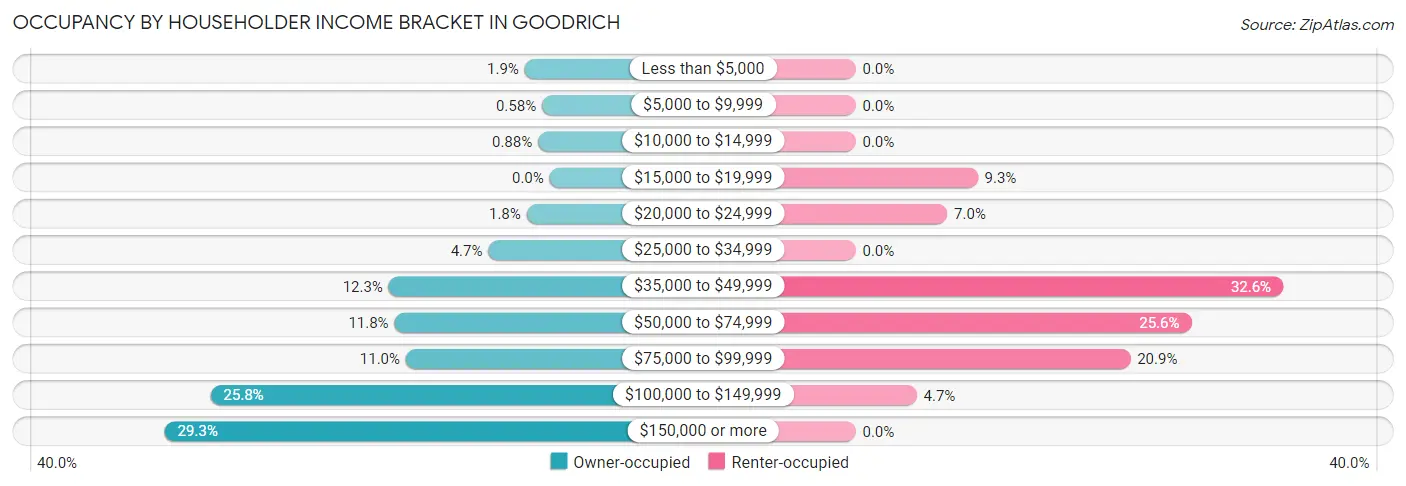
| Income Bracket | Owner-occupied | Renter-occupied |
| Less than $5,000 | 13 (1.9%) | 0 (0.0%) |
| $5,000 to $9,999 | 4 (0.6%) | 0 (0.0%) |
| $10,000 to $14,999 | 6 (0.9%) | 0 (0.0%) |
| $15,000 to $19,999 | 0 (0.0%) | 4 (9.3%) |
| $20,000 to $24,999 | 12 (1.8%) | 3 (7.0%) |
| $25,000 to $34,999 | 32 (4.7%) | 0 (0.0%) |
| $35,000 to $49,999 | 84 (12.3%) | 14 (32.6%) |
| $50,000 to $74,999 | 81 (11.8%) | 11 (25.6%) |
| $75,000 to $99,999 | 75 (11.0%) | 9 (20.9%) |
| $100,000 to $149,999 | 177 (25.8%) | 2 (4.6%) |
| $150,000 or more | 201 (29.3%) | 0 (0.0%) |
| Total | 685 (100.0%) | 43 (100.0%) |
Monthly Housing Cost Tiers in Goodrich
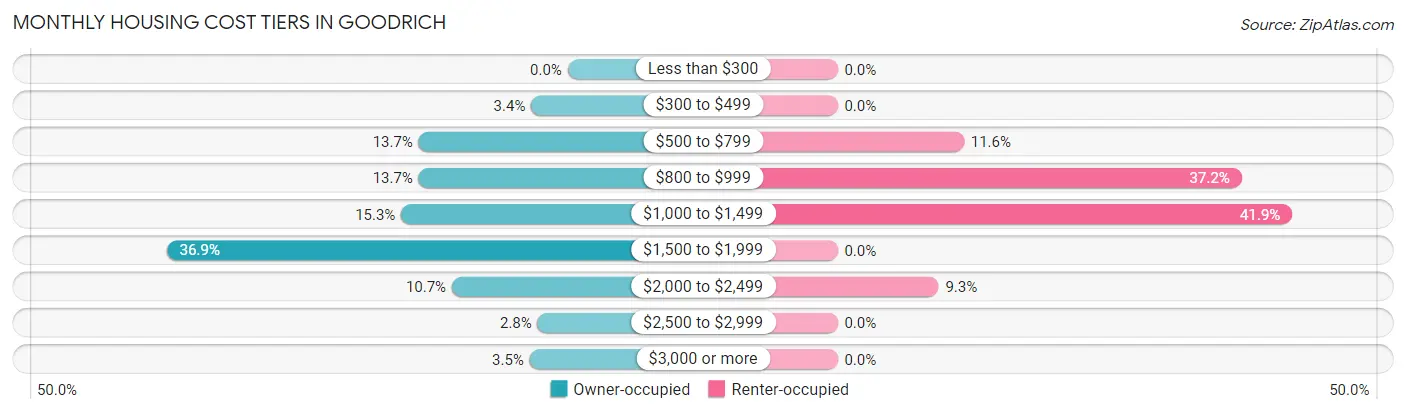
| Monthly Cost | Owner-occupied | Renter-occupied |
| Less than $300 | 0 (0.0%) | 0 (0.0%) |
| $300 to $499 | 23 (3.4%) | 0 (0.0%) |
| $500 to $799 | 94 (13.7%) | 5 (11.6%) |
| $800 to $999 | 94 (13.7%) | 16 (37.2%) |
| $1,000 to $1,499 | 105 (15.3%) | 18 (41.9%) |
| $1,500 to $1,999 | 253 (36.9%) | 0 (0.0%) |
| $2,000 to $2,499 | 73 (10.7%) | 4 (9.3%) |
| $2,500 to $2,999 | 19 (2.8%) | 0 (0.0%) |
| $3,000 or more | 24 (3.5%) | 0 (0.0%) |
| Total | 685 (100.0%) | 43 (100.0%) |
Physical Housing Characteristics in Goodrich
Housing Structures in Goodrich
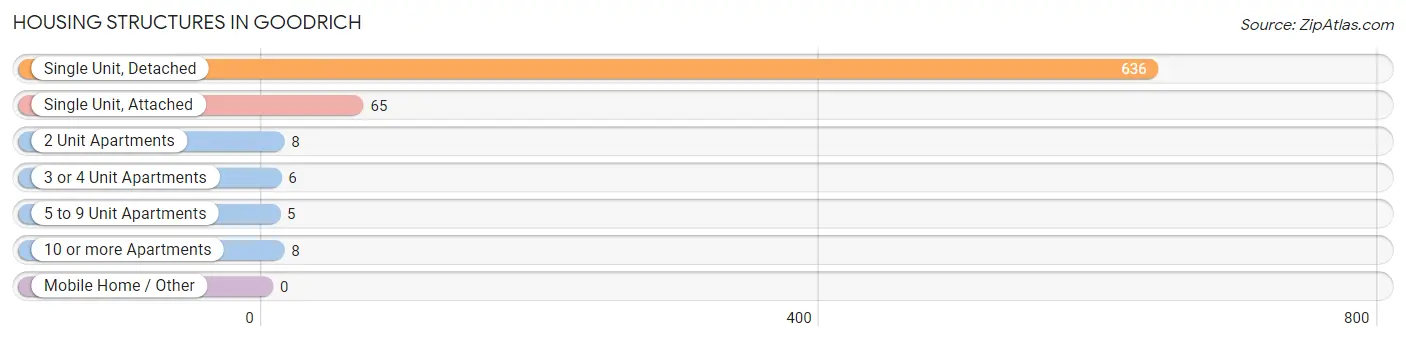
| Structure Type | # Housing Units | % Housing Units |
| Single Unit, Detached | 636 | 87.4% |
| Single Unit, Attached | 65 | 8.9% |
| 2 Unit Apartments | 8 | 1.1% |
| 3 or 4 Unit Apartments | 6 | 0.8% |
| 5 to 9 Unit Apartments | 5 | 0.7% |
| 10 or more Apartments | 8 | 1.1% |
| Mobile Home / Other | 0 | 0.0% |
| Total | 728 | 100.0% |
Housing Structures by Occupancy in Goodrich
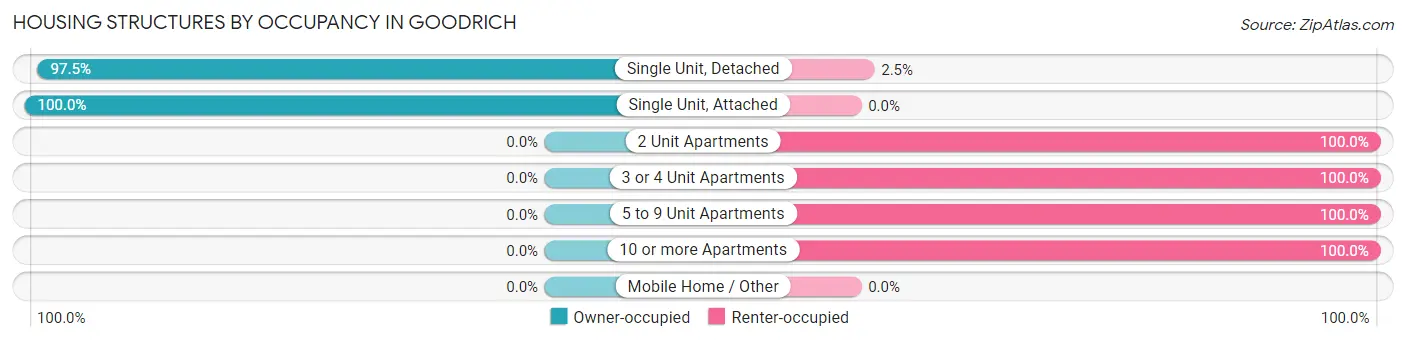
| Structure Type | Owner-occupied | Renter-occupied |
| Single Unit, Detached | 620 (97.5%) | 16 (2.5%) |
| Single Unit, Attached | 65 (100.0%) | 0 (0.0%) |
| 2 Unit Apartments | 0 (0.0%) | 8 (100.0%) |
| 3 or 4 Unit Apartments | 0 (0.0%) | 6 (100.0%) |
| 5 to 9 Unit Apartments | 0 (0.0%) | 5 (100.0%) |
| 10 or more Apartments | 0 (0.0%) | 8 (100.0%) |
| Mobile Home / Other | 0 (0.0%) | 0 (0.0%) |
| Total | 685 (94.1%) | 43 (5.9%) |
Housing Structures by Number of Rooms in Goodrich
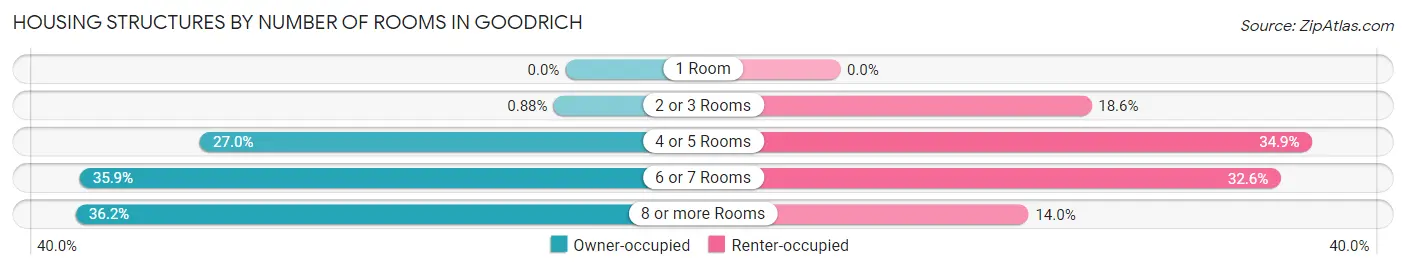
| Number of Rooms | Owner-occupied | Renter-occupied |
| 1 Room | 0 (0.0%) | 0 (0.0%) |
| 2 or 3 Rooms | 6 (0.9%) | 8 (18.6%) |
| 4 or 5 Rooms | 185 (27.0%) | 15 (34.9%) |
| 6 or 7 Rooms | 246 (35.9%) | 14 (32.6%) |
| 8 or more Rooms | 248 (36.2%) | 6 (14.0%) |
| Total | 685 (100.0%) | 43 (100.0%) |
Housing Structure by Heating Type in Goodrich
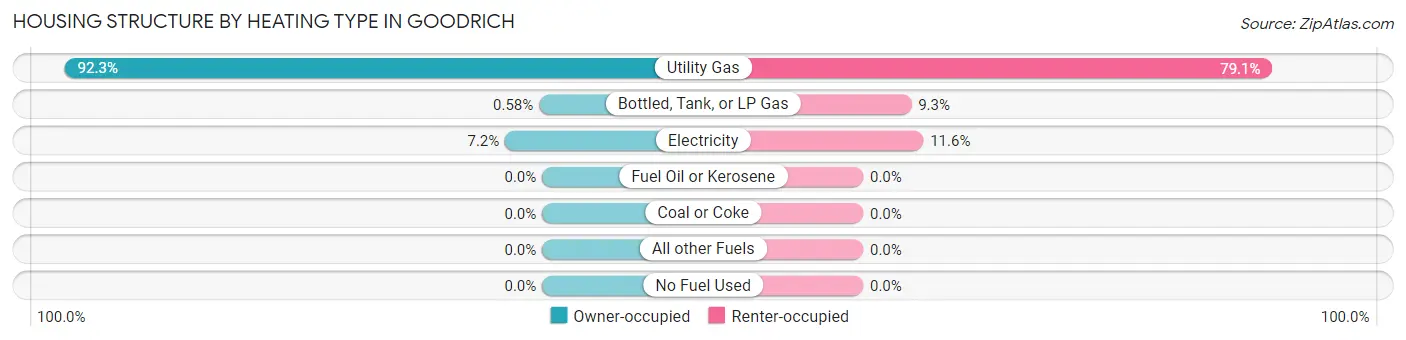
| Heating Type | Owner-occupied | Renter-occupied |
| Utility Gas | 632 (92.3%) | 34 (79.1%) |
| Bottled, Tank, or LP Gas | 4 (0.6%) | 4 (9.3%) |
| Electricity | 49 (7.1%) | 5 (11.6%) |
| Fuel Oil or Kerosene | 0 (0.0%) | 0 (0.0%) |
| Coal or Coke | 0 (0.0%) | 0 (0.0%) |
| All other Fuels | 0 (0.0%) | 0 (0.0%) |
| No Fuel Used | 0 (0.0%) | 0 (0.0%) |
| Total | 685 (100.0%) | 43 (100.0%) |
Household Vehicle Usage in Goodrich
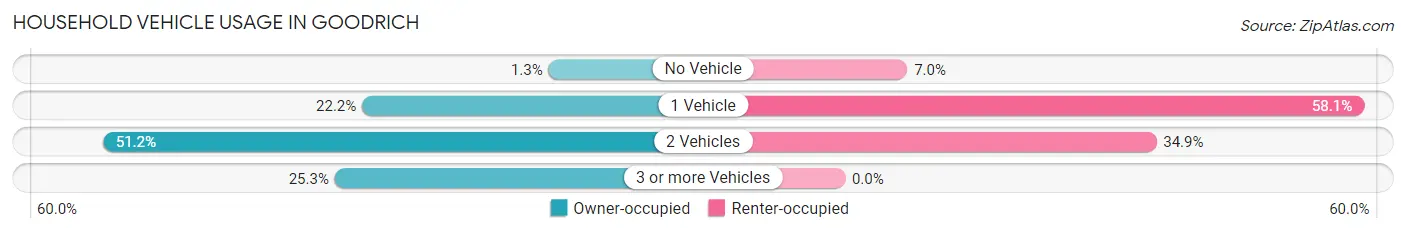
| Vehicles per Household | Owner-occupied | Renter-occupied |
| No Vehicle | 9 (1.3%) | 3 (7.0%) |
| 1 Vehicle | 152 (22.2%) | 25 (58.1%) |
| 2 Vehicles | 351 (51.2%) | 15 (34.9%) |
| 3 or more Vehicles | 173 (25.3%) | 0 (0.0%) |
| Total | 685 (100.0%) | 43 (100.0%) |
Real Estate & Mortgages in Goodrich
Real Estate and Mortgage Overview in Goodrich
| Characteristic | Without Mortgage | With Mortgage |
| Housing Units | 157 | 528 |
| Median Property Value | $222,000 | $247,000 |
| Median Household Income | $92,917 | $181 |
| Monthly Housing Costs | $686 | $24 |
| Real Estate Taxes | $3,671 | $4 |
Property Value by Mortgage Status in Goodrich
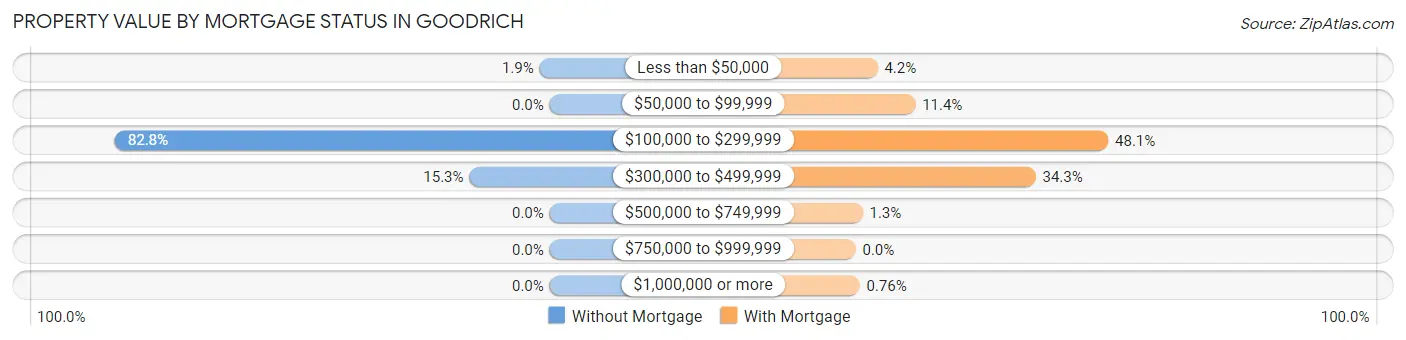
| Property Value | Without Mortgage | With Mortgage |
| Less than $50,000 | 3 (1.9%) | 22 (4.2%) |
| $50,000 to $99,999 | 0 (0.0%) | 60 (11.4%) |
| $100,000 to $299,999 | 130 (82.8%) | 254 (48.1%) |
| $300,000 to $499,999 | 24 (15.3%) | 181 (34.3%) |
| $500,000 to $749,999 | 0 (0.0%) | 7 (1.3%) |
| $750,000 to $999,999 | 0 (0.0%) | 0 (0.0%) |
| $1,000,000 or more | 0 (0.0%) | 4 (0.8%) |
| Total | 157 (100.0%) | 528 (100.0%) |
Household Income by Mortgage Status in Goodrich
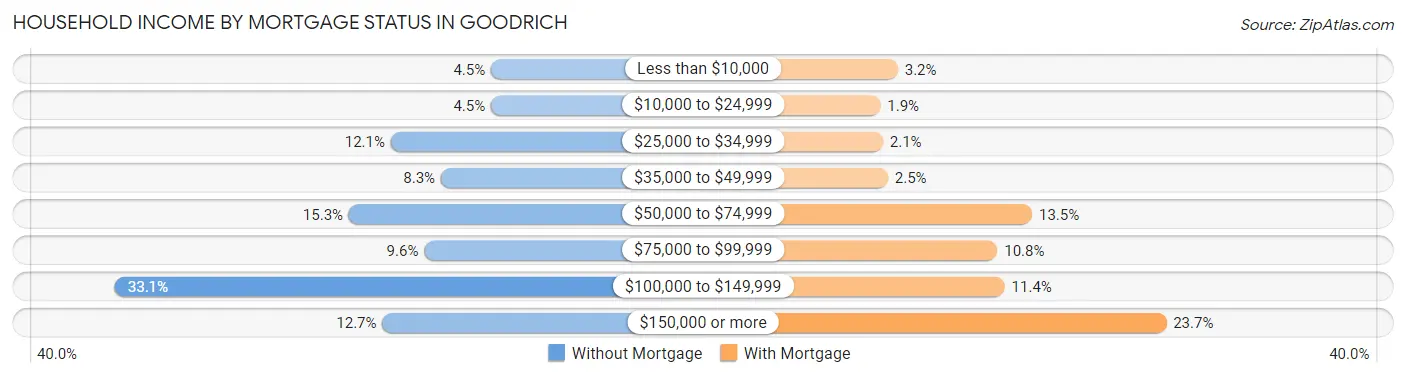
| Household Income | Without Mortgage | With Mortgage |
| Less than $10,000 | 7 (4.5%) | 17 (3.2%) |
| $10,000 to $24,999 | 7 (4.5%) | 10 (1.9%) |
| $25,000 to $34,999 | 19 (12.1%) | 11 (2.1%) |
| $35,000 to $49,999 | 13 (8.3%) | 13 (2.5%) |
| $50,000 to $74,999 | 24 (15.3%) | 71 (13.5%) |
| $75,000 to $99,999 | 15 (9.6%) | 57 (10.8%) |
| $100,000 to $149,999 | 52 (33.1%) | 60 (11.4%) |
| $150,000 or more | 20 (12.7%) | 125 (23.7%) |
| Total | 157 (100.0%) | 528 (100.0%) |
Property Value to Household Income Ratio in Goodrich
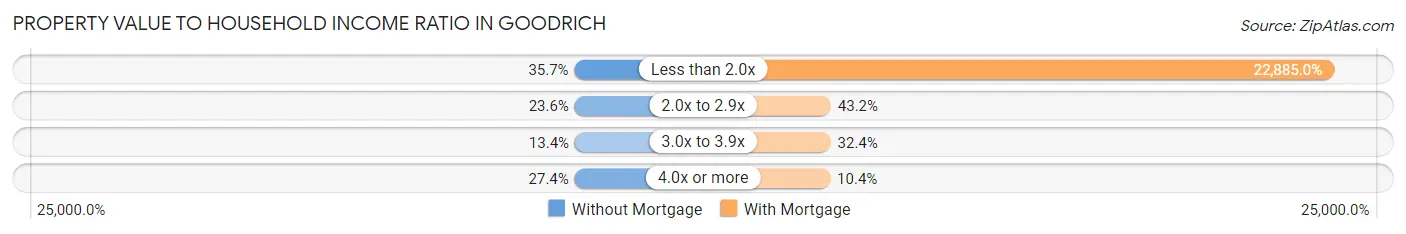
| Value-to-Income Ratio | Without Mortgage | With Mortgage |
| Less than 2.0x | 56 (35.7%) | 120,833 (22,885.0%) |
| 2.0x to 2.9x | 37 (23.6%) | 228 (43.2%) |
| 3.0x to 3.9x | 21 (13.4%) | 171 (32.4%) |
| 4.0x or more | 43 (27.4%) | 55 (10.4%) |
| Total | 157 (100.0%) | 528 (100.0%) |
Real Estate Taxes by Mortgage Status in Goodrich
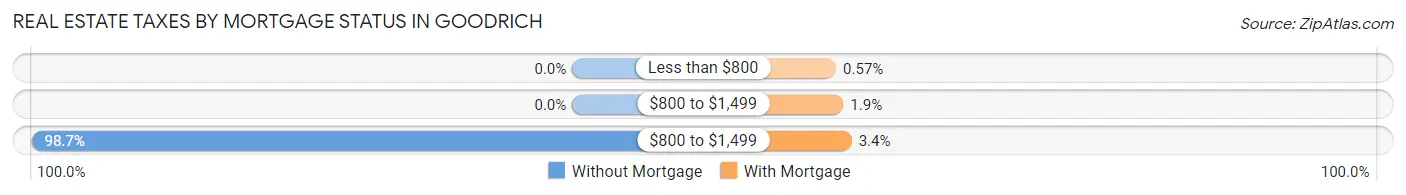
| Property Taxes | Without Mortgage | With Mortgage |
| Less than $800 | 0 (0.0%) | 3 (0.6%) |
| $800 to $1,499 | 0 (0.0%) | 10 (1.9%) |
| $800 to $1,499 | 155 (98.7%) | 18 (3.4%) |
| Total | 157 (100.0%) | 528 (100.0%) |
Health & Disability in Goodrich
Health Insurance Coverage by Age in Goodrich
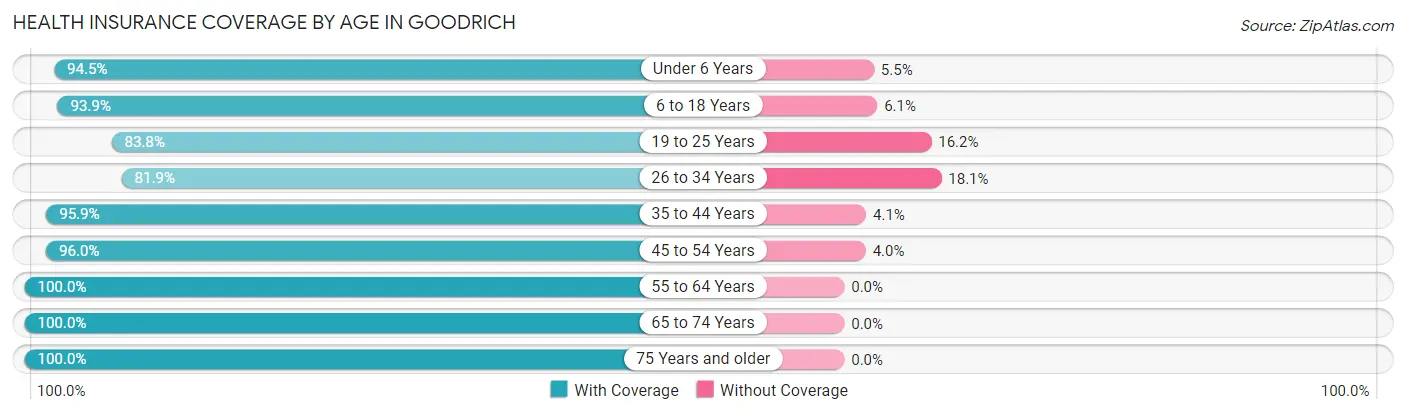
| Age Bracket | With Coverage | Without Coverage |
| Under 6 Years | 137 (94.5%) | 8 (5.5%) |
| 6 to 18 Years | 367 (93.9%) | 24 (6.1%) |
| 19 to 25 Years | 124 (83.8%) | 24 (16.2%) |
| 26 to 34 Years | 86 (81.9%) | 19 (18.1%) |
| 35 to 44 Years | 260 (95.9%) | 11 (4.1%) |
| 45 to 54 Years | 336 (96.0%) | 14 (4.0%) |
| 55 to 64 Years | 309 (100.0%) | 0 (0.0%) |
| 65 to 74 Years | 118 (100.0%) | 0 (0.0%) |
| 75 Years and older | 118 (100.0%) | 0 (0.0%) |
| Total | 1,855 (94.9%) | 100 (5.1%) |
Health Insurance Coverage by Citizenship Status in Goodrich
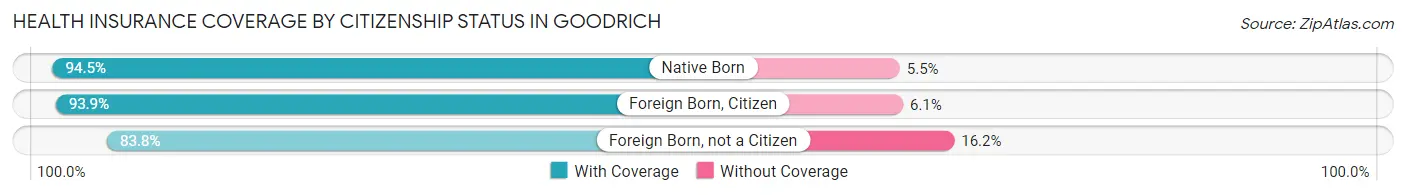
| Citizenship Status | With Coverage | Without Coverage |
| Native Born | 137 (94.5%) | 8 (5.5%) |
| Foreign Born, Citizen | 367 (93.9%) | 24 (6.1%) |
| Foreign Born, not a Citizen | 124 (83.8%) | 24 (16.2%) |
Health Insurance Coverage by Household Income in Goodrich
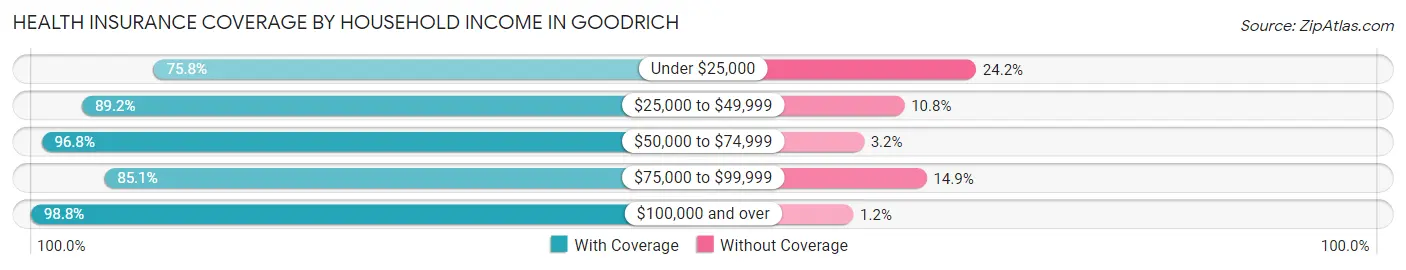
| Household Income | With Coverage | Without Coverage |
| Under $25,000 | 47 (75.8%) | 15 (24.2%) |
| $25,000 to $49,999 | 199 (89.2%) | 24 (10.8%) |
| $50,000 to $74,999 | 214 (96.8%) | 7 (3.2%) |
| $75,000 to $99,999 | 228 (85.1%) | 40 (14.9%) |
| $100,000 and over | 1,160 (98.8%) | 14 (1.2%) |
Public vs Private Health Insurance Coverage by Age in Goodrich
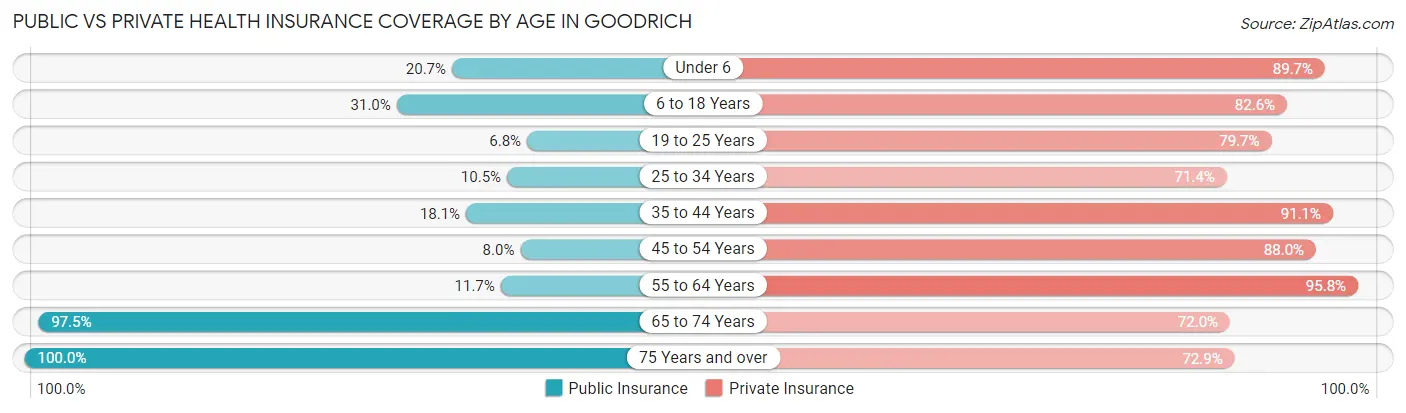
| Age Bracket | Public Insurance | Private Insurance |
| Under 6 | 30 (20.7%) | 130 (89.7%) |
| 6 to 18 Years | 121 (30.9%) | 323 (82.6%) |
| 19 to 25 Years | 10 (6.8%) | 118 (79.7%) |
| 25 to 34 Years | 11 (10.5%) | 75 (71.4%) |
| 35 to 44 Years | 49 (18.1%) | 247 (91.1%) |
| 45 to 54 Years | 28 (8.0%) | 308 (88.0%) |
| 55 to 64 Years | 36 (11.7%) | 296 (95.8%) |
| 65 to 74 Years | 115 (97.5%) | 85 (72.0%) |
| 75 Years and over | 118 (100.0%) | 86 (72.9%) |
| Total | 518 (26.5%) | 1,668 (85.3%) |
Disability Status by Sex by Age in Goodrich
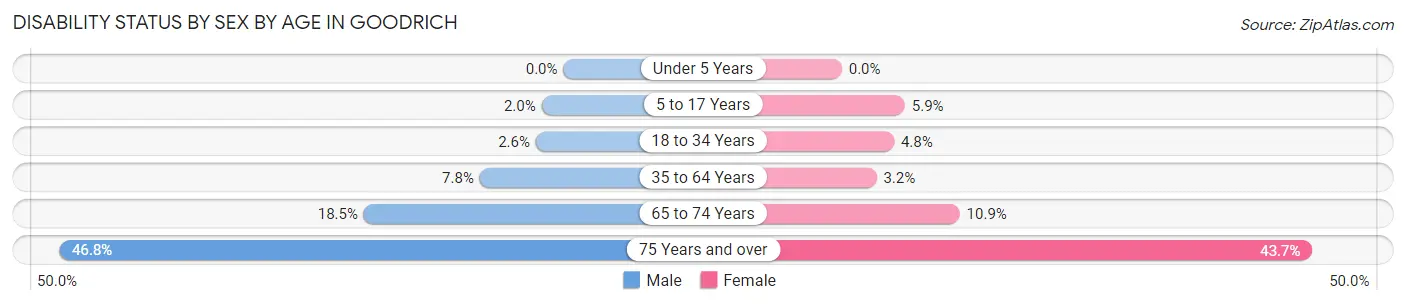
| Age Bracket | Male | Female |
| Under 5 Years | 0 (0.0%) | 0 (0.0%) |
| 5 to 17 Years | 4 (2.0%) | 11 (5.9%) |
| 18 to 34 Years | 4 (2.6%) | 6 (4.8%) |
| 35 to 64 Years | 36 (7.8%) | 15 (3.2%) |
| 65 to 74 Years | 10 (18.5%) | 7 (10.9%) |
| 75 Years and over | 22 (46.8%) | 31 (43.7%) |
Disability Class by Sex by Age in Goodrich
Disability Class: Hearing Difficulty
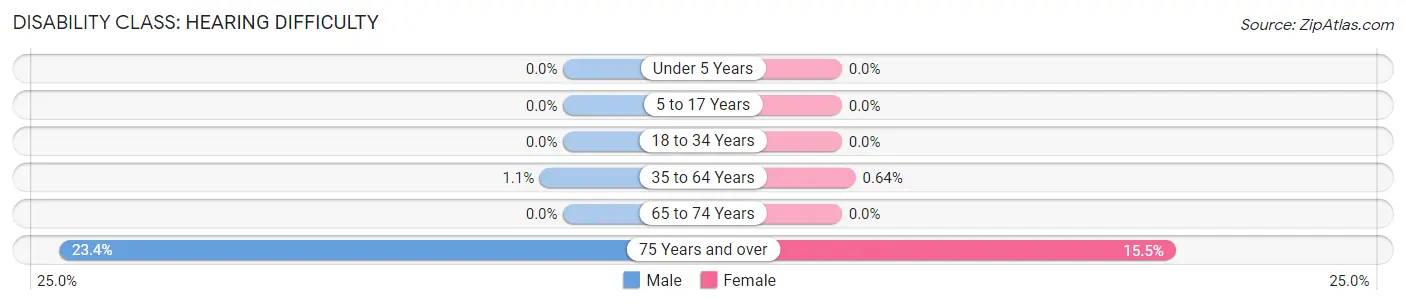
| Age Bracket | Male | Female |
| Under 5 Years | 0 (0.0%) | 0 (0.0%) |
| 5 to 17 Years | 0 (0.0%) | 0 (0.0%) |
| 18 to 34 Years | 0 (0.0%) | 0 (0.0%) |
| 35 to 64 Years | 5 (1.1%) | 3 (0.6%) |
| 65 to 74 Years | 0 (0.0%) | 0 (0.0%) |
| 75 Years and over | 11 (23.4%) | 11 (15.5%) |
Disability Class: Vision Difficulty
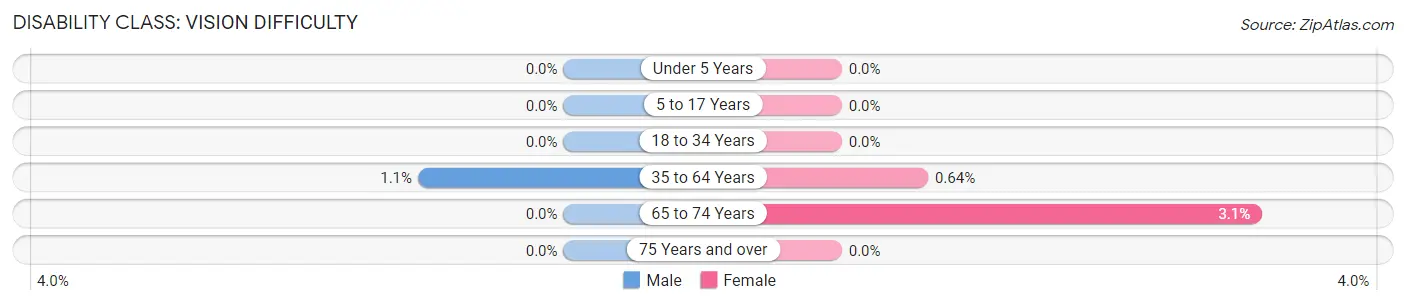
| Age Bracket | Male | Female |
| Under 5 Years | 0 (0.0%) | 0 (0.0%) |
| 5 to 17 Years | 0 (0.0%) | 0 (0.0%) |
| 18 to 34 Years | 0 (0.0%) | 0 (0.0%) |
| 35 to 64 Years | 5 (1.1%) | 3 (0.6%) |
| 65 to 74 Years | 0 (0.0%) | 2 (3.1%) |
| 75 Years and over | 0 (0.0%) | 0 (0.0%) |
Disability Class: Cognitive Difficulty
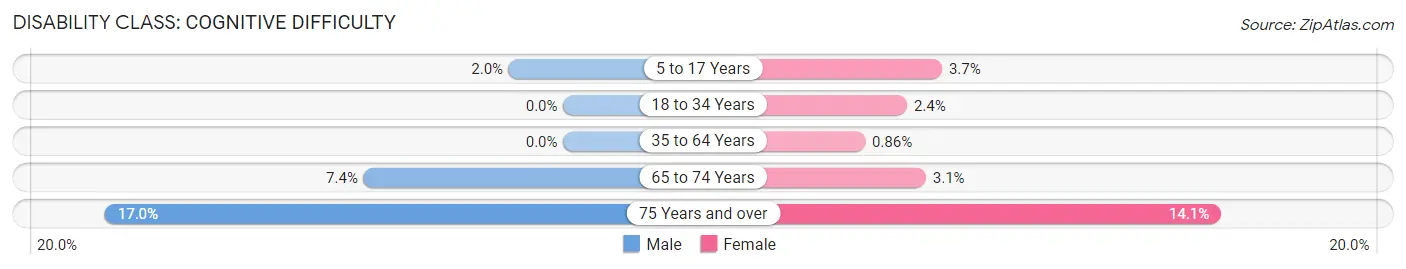
| Age Bracket | Male | Female |
| 5 to 17 Years | 4 (2.0%) | 7 (3.7%) |
| 18 to 34 Years | 0 (0.0%) | 3 (2.4%) |
| 35 to 64 Years | 0 (0.0%) | 4 (0.9%) |
| 65 to 74 Years | 4 (7.4%) | 2 (3.1%) |
| 75 Years and over | 8 (17.0%) | 10 (14.1%) |
Disability Class: Ambulatory Difficulty
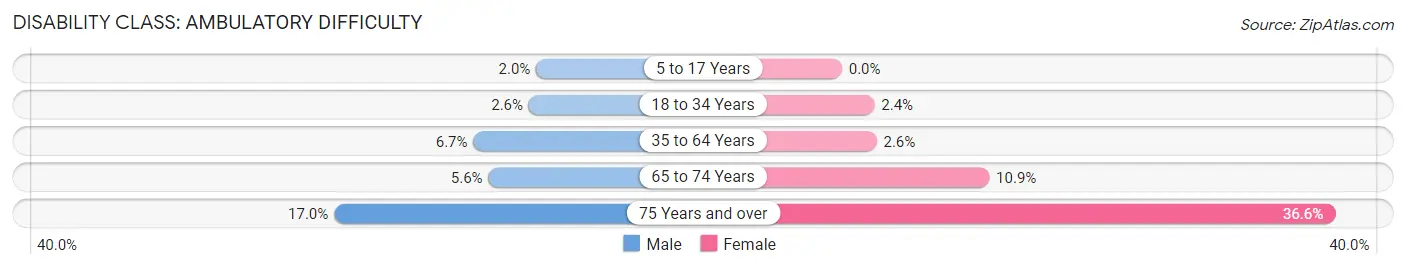
| Age Bracket | Male | Female |
| 5 to 17 Years | 4 (2.0%) | 0 (0.0%) |
| 18 to 34 Years | 4 (2.6%) | 3 (2.4%) |
| 35 to 64 Years | 31 (6.7%) | 12 (2.6%) |
| 65 to 74 Years | 3 (5.6%) | 7 (10.9%) |
| 75 Years and over | 8 (17.0%) | 26 (36.6%) |
Disability Class: Self-Care Difficulty
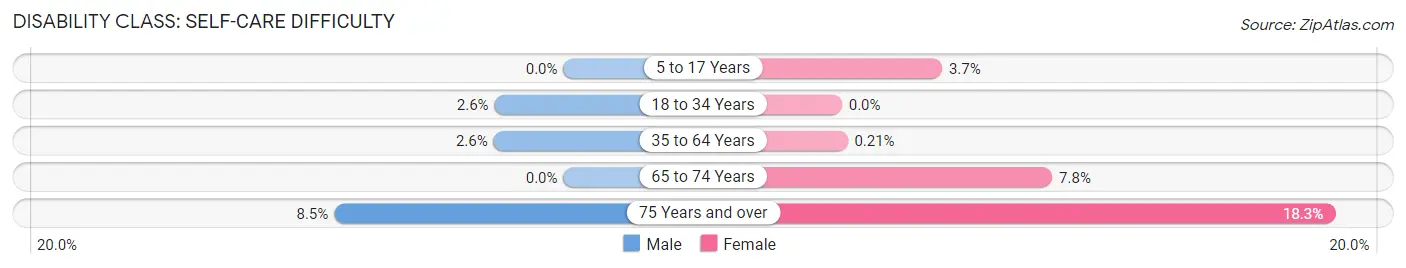
| Age Bracket | Male | Female |
| 5 to 17 Years | 0 (0.0%) | 7 (3.7%) |
| 18 to 34 Years | 4 (2.6%) | 0 (0.0%) |
| 35 to 64 Years | 12 (2.6%) | 1 (0.2%) |
| 65 to 74 Years | 0 (0.0%) | 5 (7.8%) |
| 75 Years and over | 4 (8.5%) | 13 (18.3%) |
Technology Access in Goodrich
Computing Device Access in Goodrich
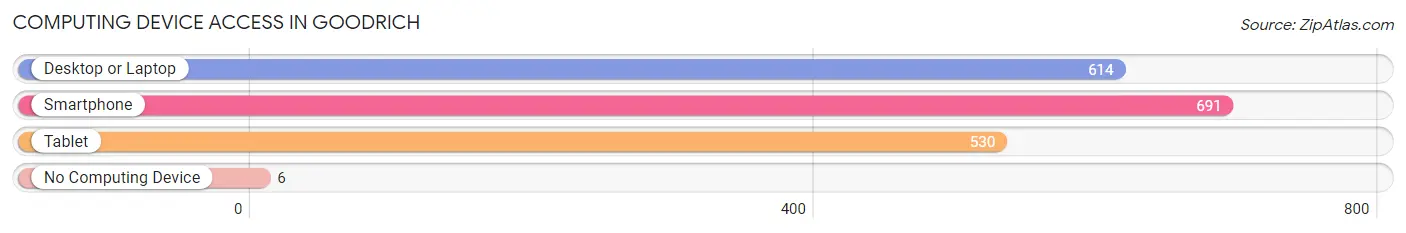
| Device Type | # Households | % Households |
| Desktop or Laptop | 614 | 84.3% |
| Smartphone | 691 | 94.9% |
| Tablet | 530 | 72.8% |
| No Computing Device | 6 | 0.8% |
| Total | 728 | 100.0% |
Internet Access in Goodrich
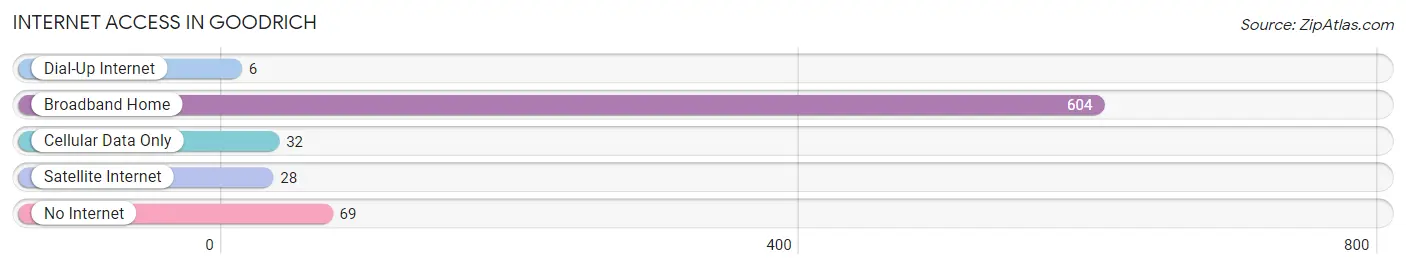
| Internet Type | # Households | % Households |
| Dial-Up Internet | 6 | 0.8% |
| Broadband Home | 604 | 83.0% |
| Cellular Data Only | 32 | 4.4% |
| Satellite Internet | 28 | 3.8% |
| No Internet | 69 | 9.5% |
| Total | 728 | 100.0% |
Goodrich Summary
Goodrich, Michigan is a small village located in Genesee County, Michigan. It is situated on the banks of the Flint River, approximately 30 miles north of Flint. The village has a population of approximately 1,400 people and is part of the larger Goodrich Area School District.
History
Goodrich was founded in 1836 by a group of settlers from New York. The village was named after the Goodrich family, who were among the first settlers. The village was incorporated in 1867 and has remained a small, rural community ever since.
The village was originally a farming community, but in the late 19th century, the lumber industry began to take hold. The village was home to several sawmills and lumber yards, which provided employment for many of the residents. The lumber industry declined in the early 20th century, but the village remained a small, rural community.
Geography
Goodrich is located in Genesee County, Michigan. It is situated on the banks of the Flint River, approximately 30 miles north of Flint. The village is surrounded by rolling hills and farmland, and is home to several small lakes and ponds. The village is located in the Huron-Manistee National Forest, which provides a variety of recreational activities.
Economy
Goodrich is a small, rural community with a limited economy. The village is home to several small businesses, including a grocery store, a hardware store, and a few restaurants. The village is also home to a few manufacturing companies, which provide employment for many of the residents.
The village is also home to a few tourist attractions, including the Goodrich Historical Museum and the Goodrich Country Club. The village is also home to a few wineries, which attract visitors from all over the state.
Demographics
As of the 2010 census, the population of Goodrich was 1,400. The median age of the population was 43.7 years, and the median household income was $50,000. The village is predominantly white, with a small percentage of African American and Hispanic residents.
Goodrich is a small, rural community with a limited economy. The village is home to a few small businesses, manufacturing companies, and tourist attractions. The village is also home to a diverse population, with a median age of 43.7 years and a median household income of $50,000.
Common Questions
What is Per Capita Income in Goodrich?
Per Capita income in Goodrich is $47,152.
What is the Median Family Income in Goodrich?
Median Family Income in Goodrich is $121,615.
What is the Median Household income in Goodrich?
Median Household Income in Goodrich is $103,438.
What is Income or Wage Gap in Goodrich?
Income or Wage Gap in Goodrich is 20.5%.
Women in Goodrich earn 79.5 cents for every dollar earned by a man.
What is Inequality or Gini Index in Goodrich?
Inequality or Gini Index in Goodrich is 0.42.
What is the Total Population of Goodrich?
Total Population of Goodrich is 1,991.
What is the Total Male Population of Goodrich?
Total Male Population of Goodrich is 965.
What is the Total Female Population of Goodrich?
Total Female Population of Goodrich is 1,026.
What is the Ratio of Males per 100 Females in Goodrich?
There are 94.05 Males per 100 Females in Goodrich.
What is the Ratio of Females per 100 Males in Goodrich?
There are 106.32 Females per 100 Males in Goodrich.
What is the Median Population Age in Goodrich?
Median Population Age in Goodrich is 42.1 Years.
What is the Average Family Size in Goodrich
Average Family Size in Goodrich is 3.1 People.
What is the Average Household Size in Goodrich
Average Household Size in Goodrich is 2.7 People.
How Large is the Labor Force in Goodrich?
There are 1,005 People in the Labor Forcein in Goodrich.
What is the Percentage of People in the Labor Force in Goodrich?
66.8% of People are in the Labor Force in Goodrich.
What is the Unemployment Rate in Goodrich?
Unemployment Rate in Goodrich is 9.0%.