Zip Codes with the Highest Percentage of Hispanic or Latino Population in Weatherford, TX
RELATED REPORTS & OPTIONS
Hispanic or Latino
Weatherford
Compare Zip Codes
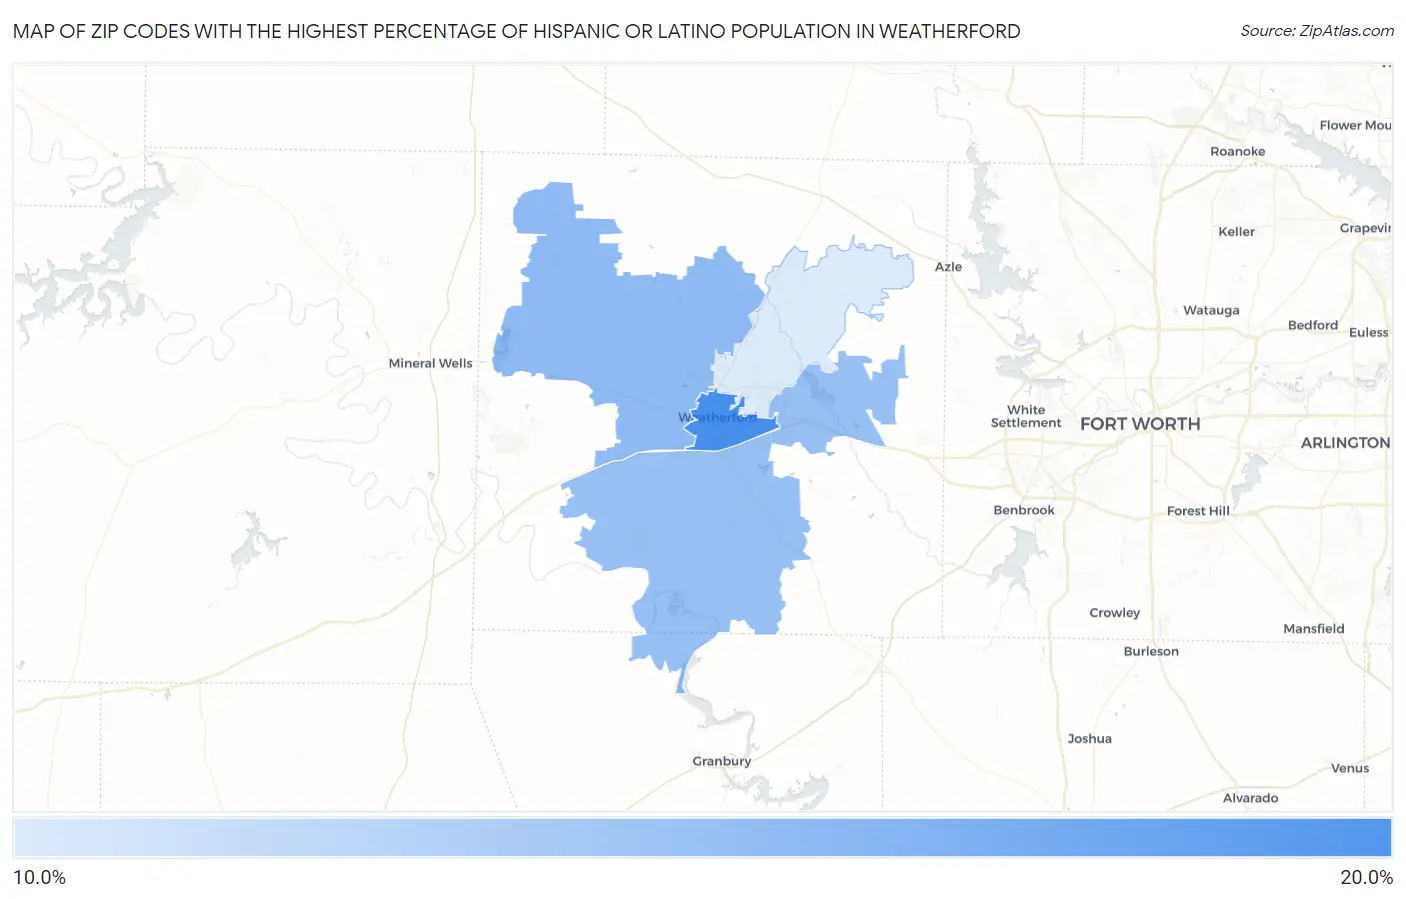
Map of Zip Codes with the Highest Percentage of Hispanic or Latino Population in Weatherford
10.5%
16.3%
Zip Codes with the Highest Percentage of Hispanic or Latino Population in Weatherford, TX
| Zip Code | Hispanic or Latino | vs State | vs National | |
| 1. | 76086 | 16.3% | 39.9%(-23.6)#1,283 | 18.7%(-2.35)#5,870 |
| 2. | 76088 | 13.6% | 39.9%(-26.3)#1,402 | 18.7%(-5.10)#6,989 |
| 3. | 76087 | 13.1% | 39.9%(-26.8)#1,423 | 18.7%(-5.52)#7,188 |
| 4. | 76085 | 10.5% | 39.9%(-29.4)#1,527 | 18.7%(-8.12)#8,547 |
1
Common Questions
What are the Top 3 Zip Codes with the Highest Percentage of Hispanic or Latino Population in Weatherford, TX?
Top 3 Zip Codes with the Highest Percentage of Hispanic or Latino Population in Weatherford, TX are:
What zip code has the Highest Percentage of Hispanic or Latino Population in Weatherford, TX?
76086 has the Highest Percentage of Hispanic or Latino Population in Weatherford, TX with 16.3%.
What is the Percentage of Hispanic or Latino Population in Weatherford, TX?
Percentage of Hispanic or Latino Population in Weatherford is 13.6%.
What is the Percentage of Hispanic or Latino Population in Texas?
Percentage of Hispanic or Latino Population in Texas is 39.9%.
What is the Percentage of Hispanic or Latino Population in the United States?
Percentage of Hispanic or Latino Population in the United States is 18.7%.