Zip Codes with the Highest Percentage of Immigrants from South America in Weatherford, TX
RELATED REPORTS & OPTIONS
South America
Weatherford
Compare Zip Codes
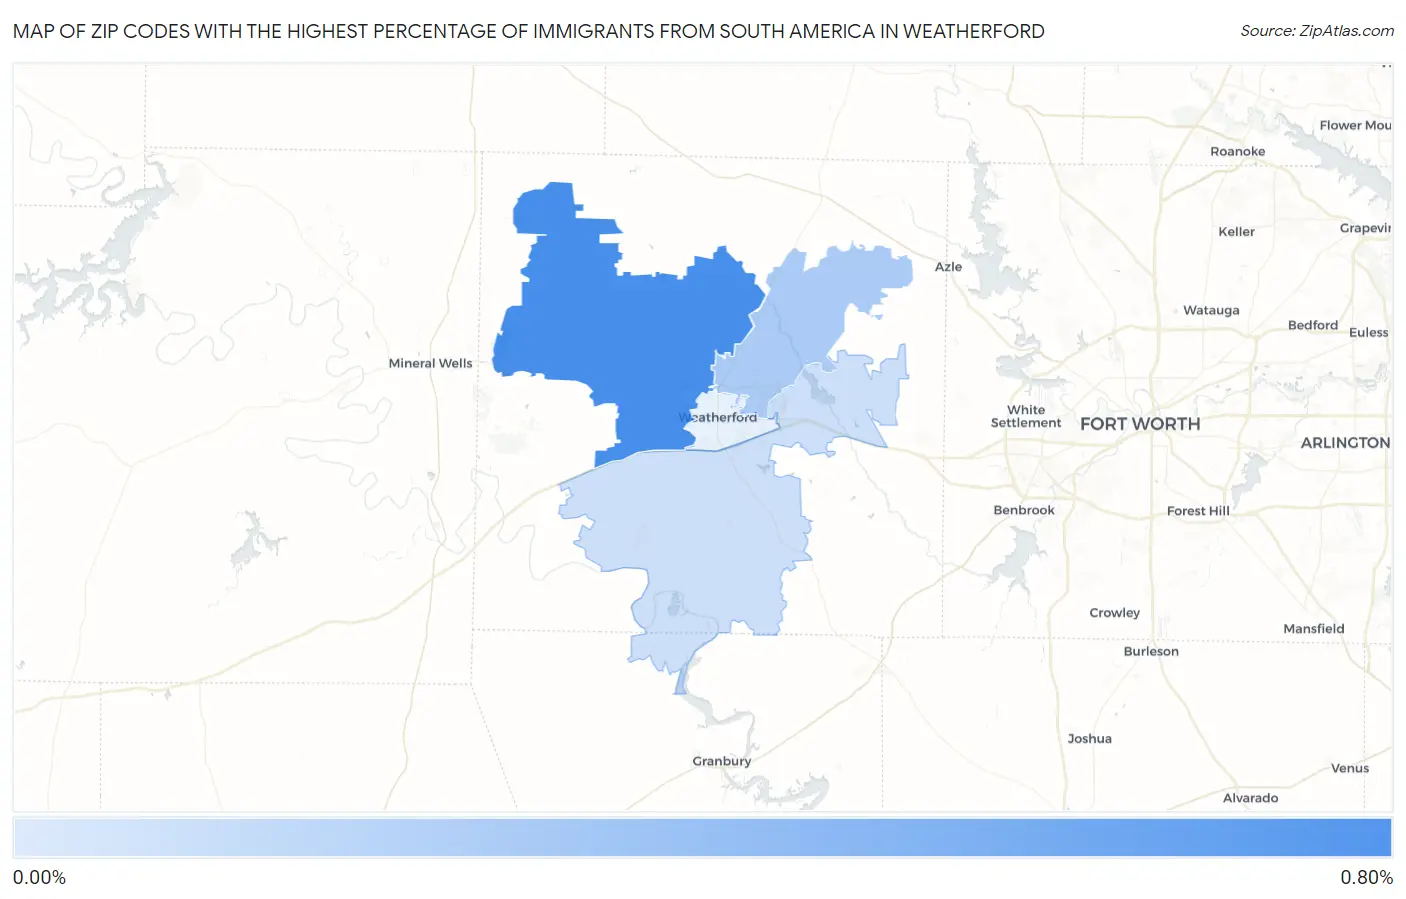
Map of Zip Codes with the Highest Percentage of Immigrants from South America in Weatherford
0.066%
0.65%
Zip Codes with the Highest Percentage of Immigrants from South America in Weatherford, TX
| Zip Code | South America | vs State | vs National | |
| 1. | 76088 | 0.65% | 0.77%(-0.124)#1,367 | 1.10%(-0.452)#8,247 |
| 2. | 76085 | 0.21% | 0.77%(-0.556)#1,537 | 1.10%(-0.885)#11,496 |
| 3. | 76087 | 0.066% | 0.77%(-0.704)#1,538 | 1.10%(-1.03)#11,497 |
1
Common Questions
What are the Top 3 Zip Codes with the Highest Percentage of Immigrants from South America in Weatherford, TX?
Top 3 Zip Codes with the Highest Percentage of Immigrants from South America in Weatherford, TX are:
What zip code has the Highest Percentage of Immigrants from South America in Weatherford, TX?
76088 has the Highest Percentage of Immigrants from South America in Weatherford, TX with 0.65%.
What is the Percentage of Immigrants from South America in Weatherford, TX?
Percentage of Immigrants from South America in Weatherford is 0.053%.
What is the Percentage of Immigrants from South America in Texas?
Percentage of Immigrants from South America in Texas is 0.77%.
What is the Percentage of Immigrants from South America in the United States?
Percentage of Immigrants from South America in the United States is 1.10%.