Zip Codes with the Highest Percentage of Private Company Employees in Weatherford, TX
RELATED REPORTS & OPTIONS
Private Company Employees
Weatherford
Compare Zip Codes
Map of Zip Codes with the Highest Percentage of Private Company Employees in Weatherford
57.9%
73.6%
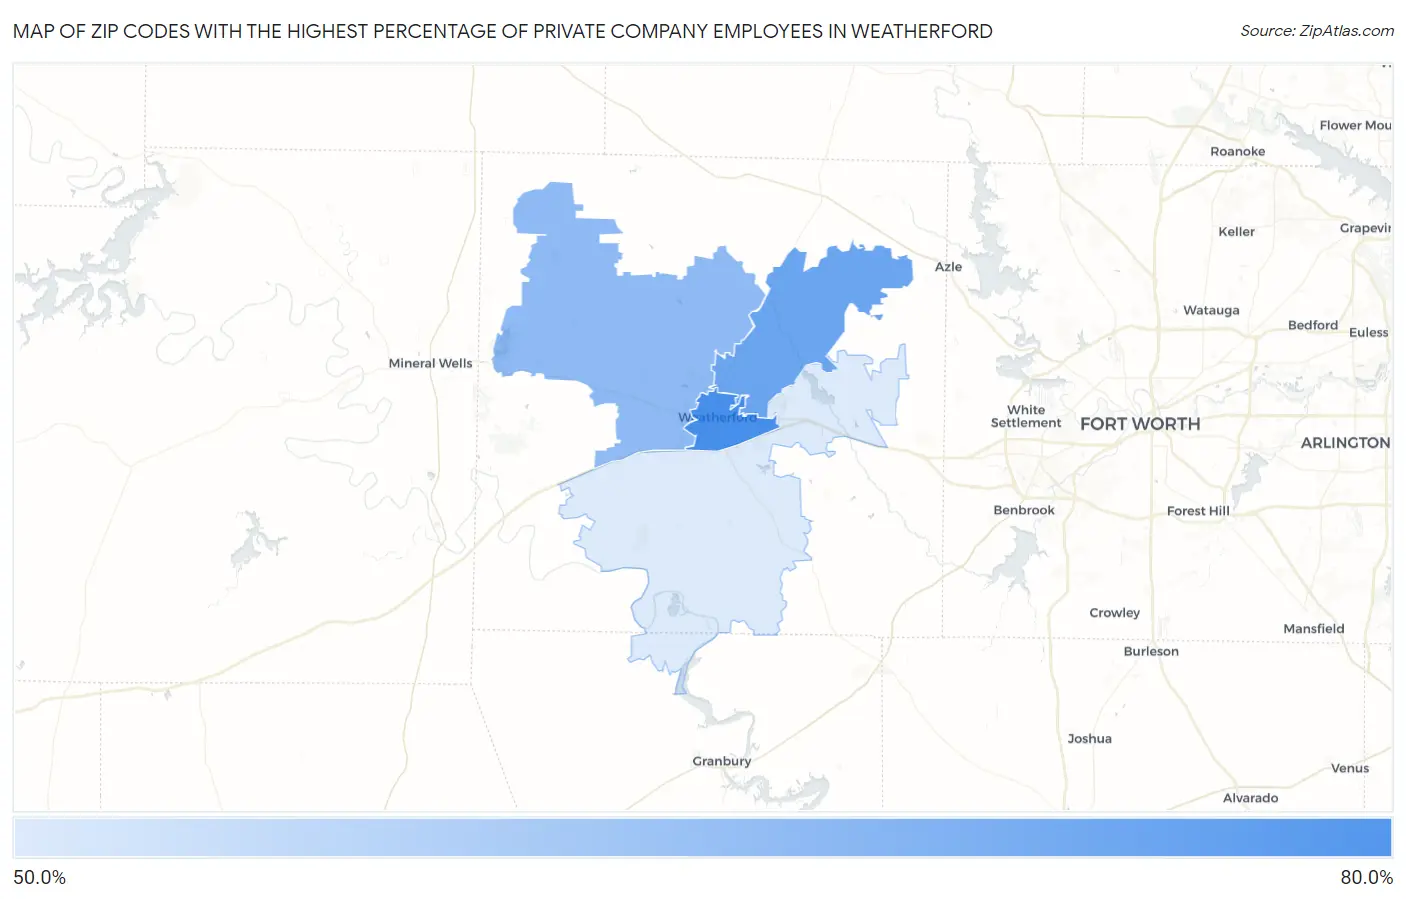
Zip Codes with the Highest Percentage of Private Company Employees in Weatherford, TX
| Zip Code | % Private Company Employees | vs State | vs National | |
| 1. | 76086 | 73.6% | 69.6%(+3.99)#444 | 66.9%(+6.66)#6,185 |
| 2. | 76085 | 69.5% | 69.6%(-0.095)#812 | 66.9%(+2.58)#11,092 |
| 3. | 76088 | 66.0% | 69.6%(-3.59)#1,108 | 66.9%(-0.919)#15,754 |
| 4. | 76087 | 57.9% | 69.6%(-11.6)#1,555 | 66.9%(-8.95)#24,089 |
1
Common Questions
What are the Top 3 Zip Codes with the Highest Percentage of Private Company Employees in Weatherford, TX?
Top 3 Zip Codes with the Highest Percentage of Private Company Employees in Weatherford, TX are:
What zip code has the Highest Percentage of Private Company Employees in Weatherford, TX?
76086 has the Highest Percentage of Private Company Employees in Weatherford, TX with 73.6%.
What is the Percentage of Private Company Employees in Weatherford, TX?
Percentage of Private Company Employees in Weatherford is 67.7%.
What is the Percentage of Private Company Employees in Texas?
Percentage of Private Company Employees in Texas is 69.6%.
What is the Percentage of Private Company Employees in the United States?
Percentage of Private Company Employees in the United States is 66.9%.