Zip Codes with the Highest Percentage of Population with a Degree in Science and Engineering in Darlington, SC
RELATED REPORTS & OPTIONS
Science and Engineering
Darlington
Compare Zip Codes
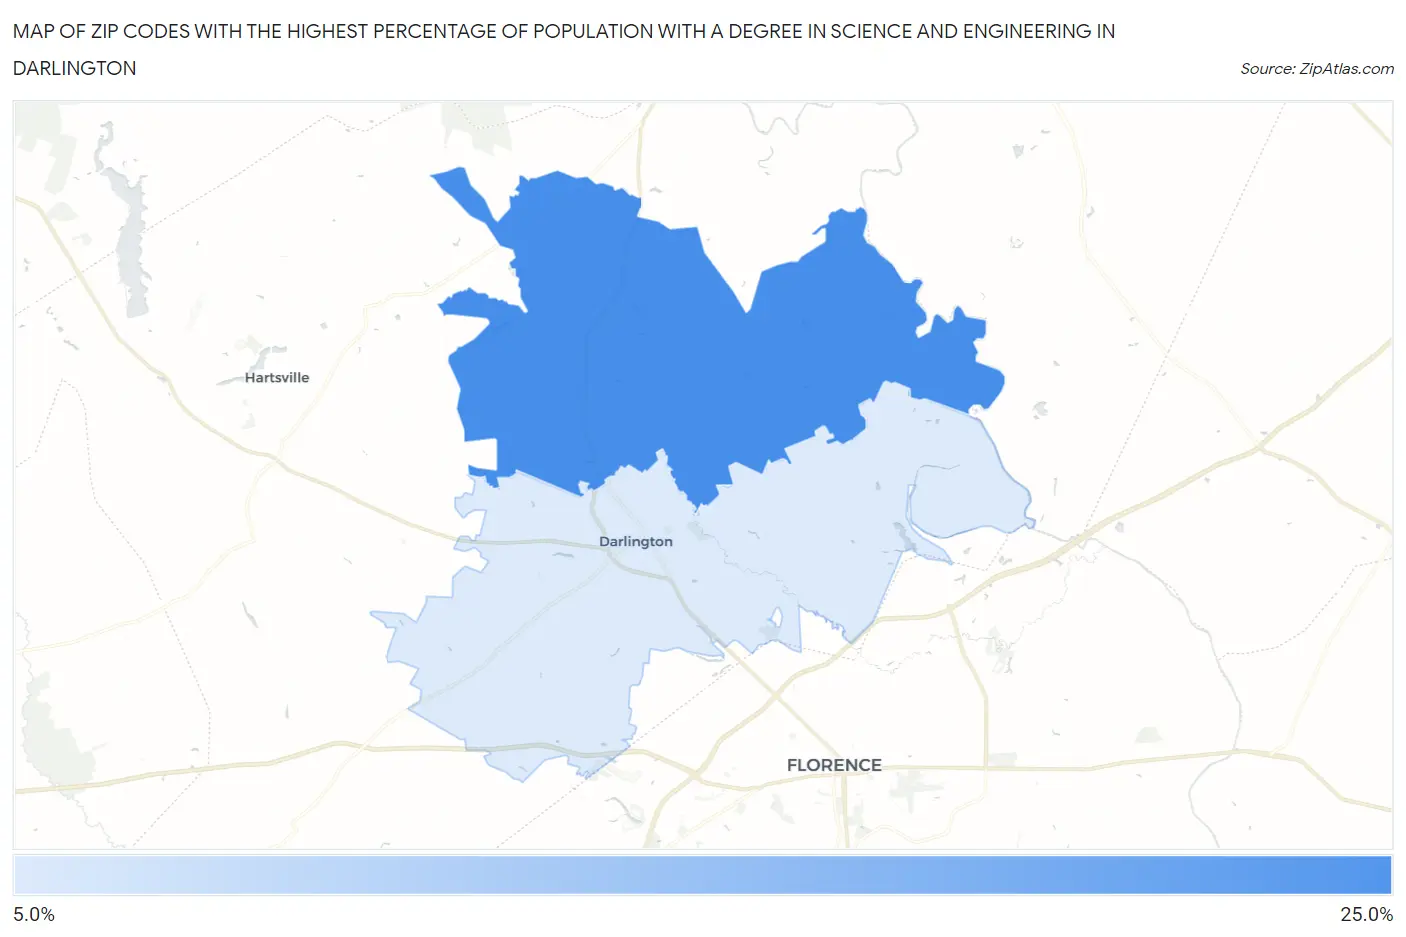
Map of Zip Codes with the Highest Percentage of Population with a Degree in Science and Engineering in Darlington
10.8%
21.4%
Zip Codes with the Highest Percentage of Population with a Degree in Science and Engineering in Darlington, SC
| Zip Code | % Graduates | vs State | vs National | |
| 1. | 29540 | 21.4% | 10.2%(+11.1)#32 | 9.8%(+11.6)#2,840 |
| 2. | 29532 | 10.8% | 10.2%(+0.620)#162 | 9.8%(+1.05)#13,227 |
1
Common Questions
What are the Top Zip Codes with the Highest Percentage of Population with a Degree in Science and Engineering in Darlington, SC?
Top Zip Codes with the Highest Percentage of Population with a Degree in Science and Engineering in Darlington, SC are:
What zip code has the Highest Percentage of Population with a Degree in Science and Engineering in Darlington, SC?
29540 has the Highest Percentage of Population with a Degree in Science and Engineering in Darlington, SC with 21.4%.
What is the Percentage of Population with a Degree in Science and Engineering in Darlington, SC?
Percentage of Population with a Degree in Science and Engineering in Darlington is 9.8%.
What is the Percentage of Population with a Degree in Science and Engineering in South Carolina?
Percentage of Population with a Degree in Science and Engineering in South Carolina is 10.2%.
What is the Percentage of Population with a Degree in Science and Engineering in the United States?
Percentage of Population with a Degree in Science and Engineering in the United States is 9.8%.