Zip Codes with the Highest Percentage of Population Employed in Administrative & Support Services in Darlington, SC
RELATED REPORTS & OPTIONS
Administrative & Support Services
Darlington
Compare Zip Codes
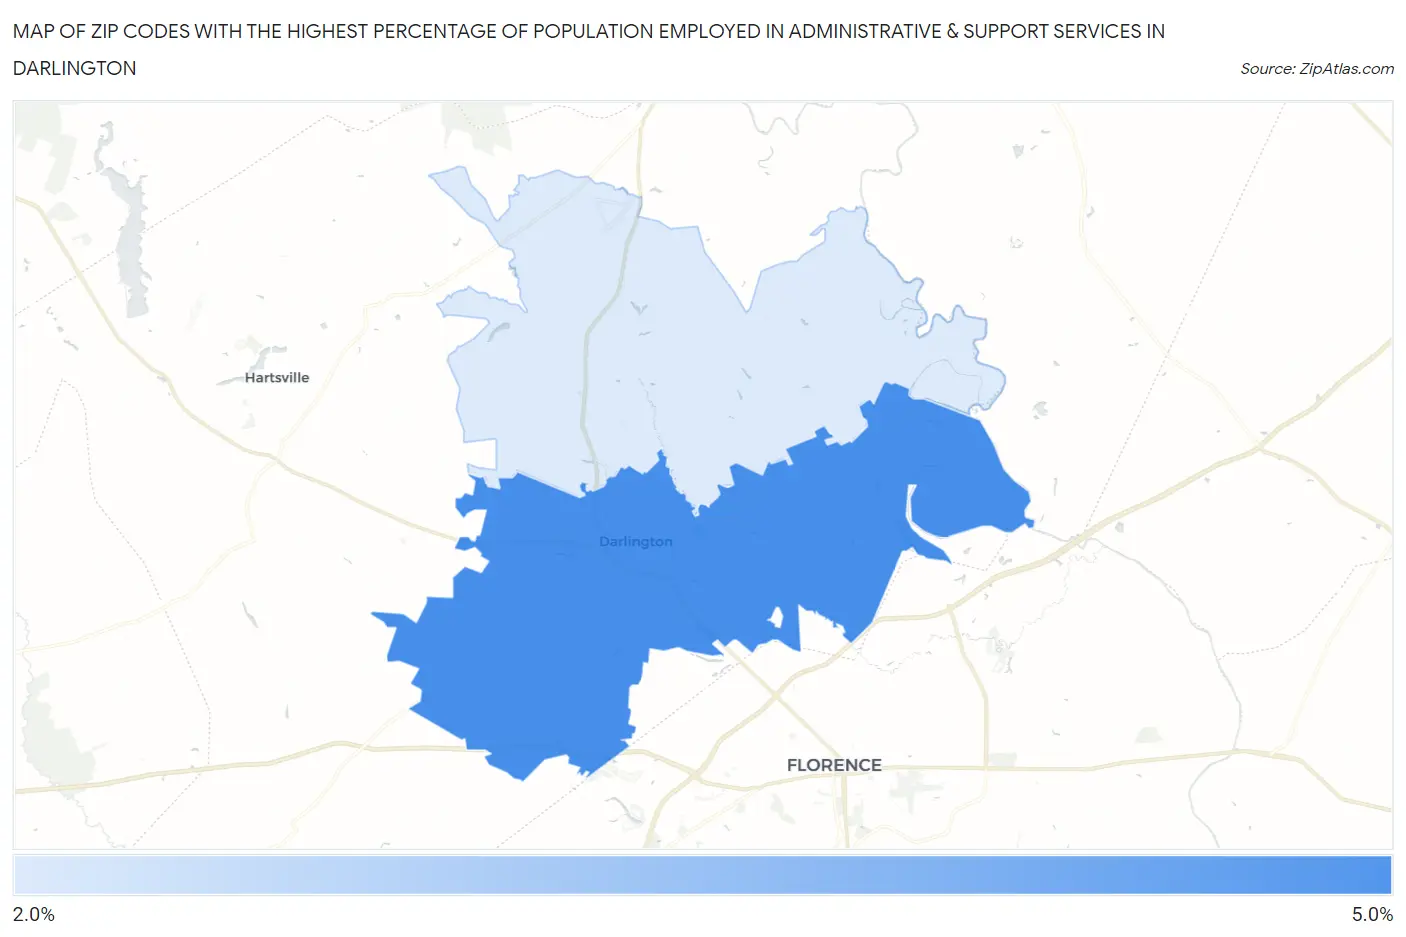
Map of Zip Codes with the Highest Percentage of Population Employed in Administrative & Support Services in Darlington
2.1%
4.8%
Zip Codes with the Highest Percentage of Population Employed in Administrative & Support Services in Darlington, SC
| Zip Code | % Employed | vs State | vs National | |
| 1. | 29532 | 4.8% | 4.8%(-0.011)#166 | 4.1%(+0.683)#7,617 |
| 2. | 29540 | 2.1% | 4.8%(-2.73)#318 | 4.1%(-2.03)#20,068 |
1
Common Questions
What are the Top Zip Codes with the Highest Percentage of Population Employed in Administrative & Support Services in Darlington, SC?
Top Zip Codes with the Highest Percentage of Population Employed in Administrative & Support Services in Darlington, SC are:
What zip code has the Highest Percentage of Population Employed in Administrative & Support Services in Darlington, SC?
29532 has the Highest Percentage of Population Employed in Administrative & Support Services in Darlington, SC with 4.8%.
What is the Percentage of Population Employed in Administrative & Support Services in Darlington, SC?
Percentage of Population Employed in Administrative & Support Services in Darlington is 6.6%.
What is the Percentage of Population Employed in Administrative & Support Services in South Carolina?
Percentage of Population Employed in Administrative & Support Services in South Carolina is 4.8%.
What is the Percentage of Population Employed in Administrative & Support Services in the United States?
Percentage of Population Employed in Administrative & Support Services in the United States is 4.1%.