Zip Codes with the Highest Percentage of Population Employed in Food Preparation & Serving in San Juan, PR
RELATED REPORTS & OPTIONS
Food Preparation & Serving
San Juan
Compare Zip Codes
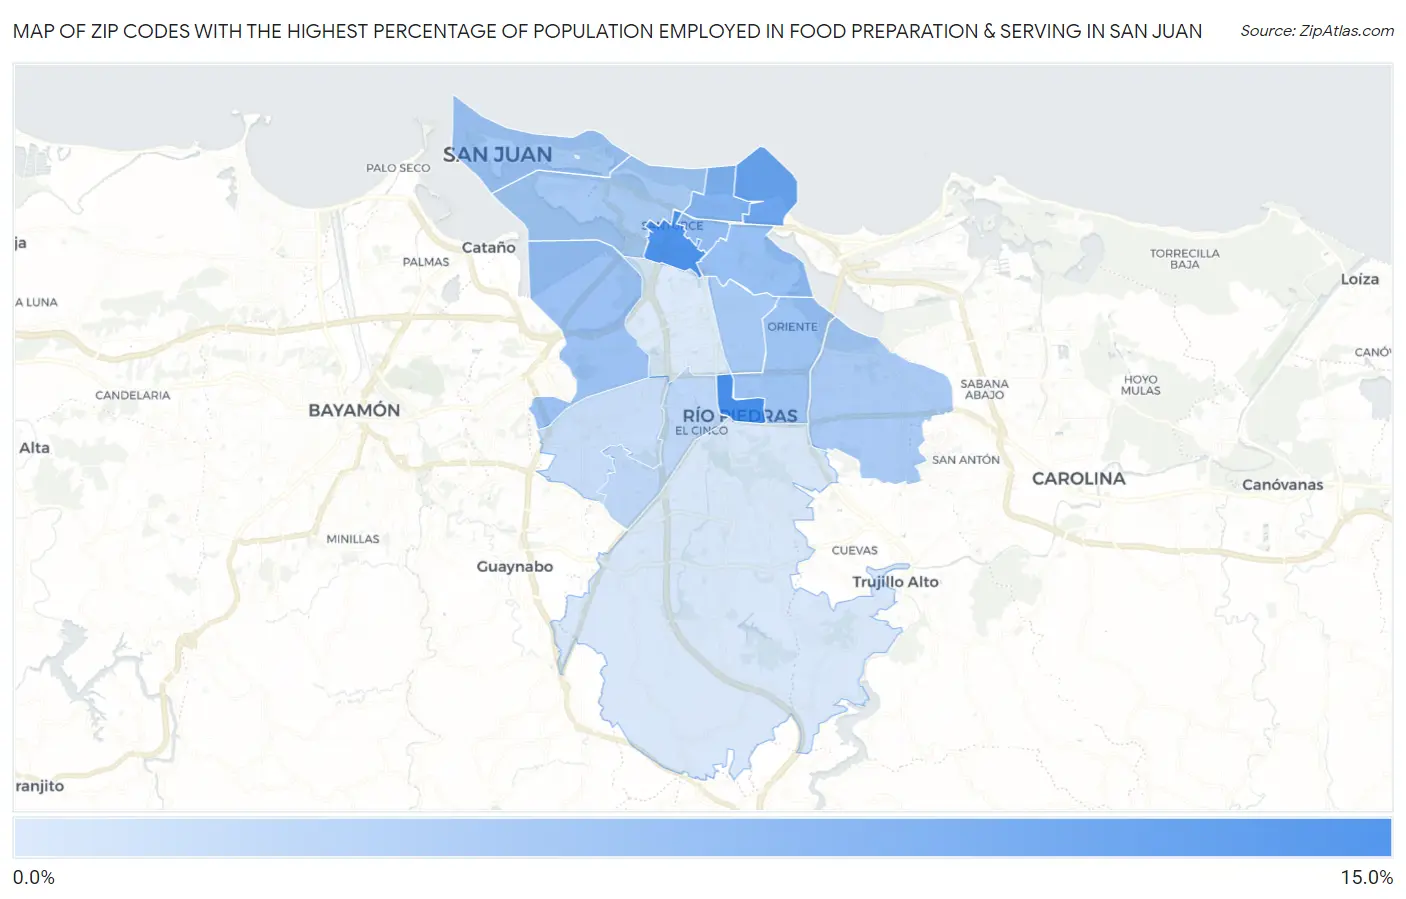
Map of Zip Codes with the Highest Percentage of Population Employed in Food Preparation & Serving in San Juan
2.6%
14.5%
Zip Codes with the Highest Percentage of Population Employed in Food Preparation & Serving in San Juan, PR
| Zip Code | % Employed | vs State | vs National | |
| 1. | 00925 | 14.5% | 5.7%(+8.86)#4 | 5.3%(+9.26)#1,051 |
| 2. | 00909 | 13.9% | 5.7%(+8.24)#5 | 5.3%(+8.63)#1,182 |
| 3. | 00913 | 11.2% | 5.7%(+5.54)#8 | 5.3%(+5.94)#1,946 |
| 4. | 00911 | 9.6% | 5.7%(+3.96)#14 | 5.3%(+4.36)#2,931 |
| 5. | 00912 | 8.4% | 5.7%(+2.73)#22 | 5.3%(+3.12)#4,159 |
| 6. | 00915 | 7.9% | 5.7%(+2.21)#27 | 5.3%(+2.61)#4,896 |
| 7. | 00920 | 7.7% | 5.7%(+1.98)#30 | 5.3%(+2.38)#5,268 |
| 8. | 00923 | 7.4% | 5.7%(+1.68)#32 | 5.3%(+2.08)#5,805 |
| 9. | 00901 | 7.1% | 5.7%(+1.40)#33 | 5.3%(+1.80)#6,373 |
| 10. | 00917 | 6.7% | 5.7%(+1.04)#43 | 5.3%(+1.44)#7,279 |
| 11. | 00907 | 6.6% | 5.7%(+0.892)#46 | 5.3%(+1.29)#7,664 |
| 12. | 00924 | 6.6% | 5.7%(+0.870)#48 | 5.3%(+1.27)#7,718 |
| 13. | 00927 | 4.9% | 5.7%(-0.799)#88 | 5.3%(-0.402)#13,422 |
| 14. | 00921 | 4.2% | 5.7%(-1.46)#103 | 5.3%(-1.06)#16,194 |
| 15. | 00926 | 2.8% | 5.7%(-2.85)#116 | 5.3%(-2.45)#21,936 |
| 16. | 00918 | 2.6% | 5.7%(-3.13)#119 | 5.3%(-2.73)#22,948 |
1
Common Questions
What are the Top 10 Zip Codes with the Highest Percentage of Population Employed in Food Preparation & Serving in San Juan, PR?
Top 10 Zip Codes with the Highest Percentage of Population Employed in Food Preparation & Serving in San Juan, PR are:
What zip code has the Highest Percentage of Population Employed in Food Preparation & Serving in San Juan, PR?
00925 has the Highest Percentage of Population Employed in Food Preparation & Serving in San Juan, PR with 14.5%.
What is the Percentage of Population Employed in Food Preparation & Serving in San Juan, PR?
Percentage of Population Employed in Food Preparation & Serving in San Juan is 5.5%.
What is the Percentage of Population Employed in Food Preparation & Serving in Puerto Rico?
Percentage of Population Employed in Food Preparation & Serving in Puerto Rico is 5.7%.
What is the Percentage of Population Employed in Food Preparation & Serving in the United States?
Percentage of Population Employed in Food Preparation & Serving in the United States is 5.3%.