Zip Codes with the Highest Percentage of Population Employed in Food Preparation & Serving in Mayaguez, PR
RELATED REPORTS & OPTIONS
Food Preparation & Serving
Mayaguez
Compare Zip Codes
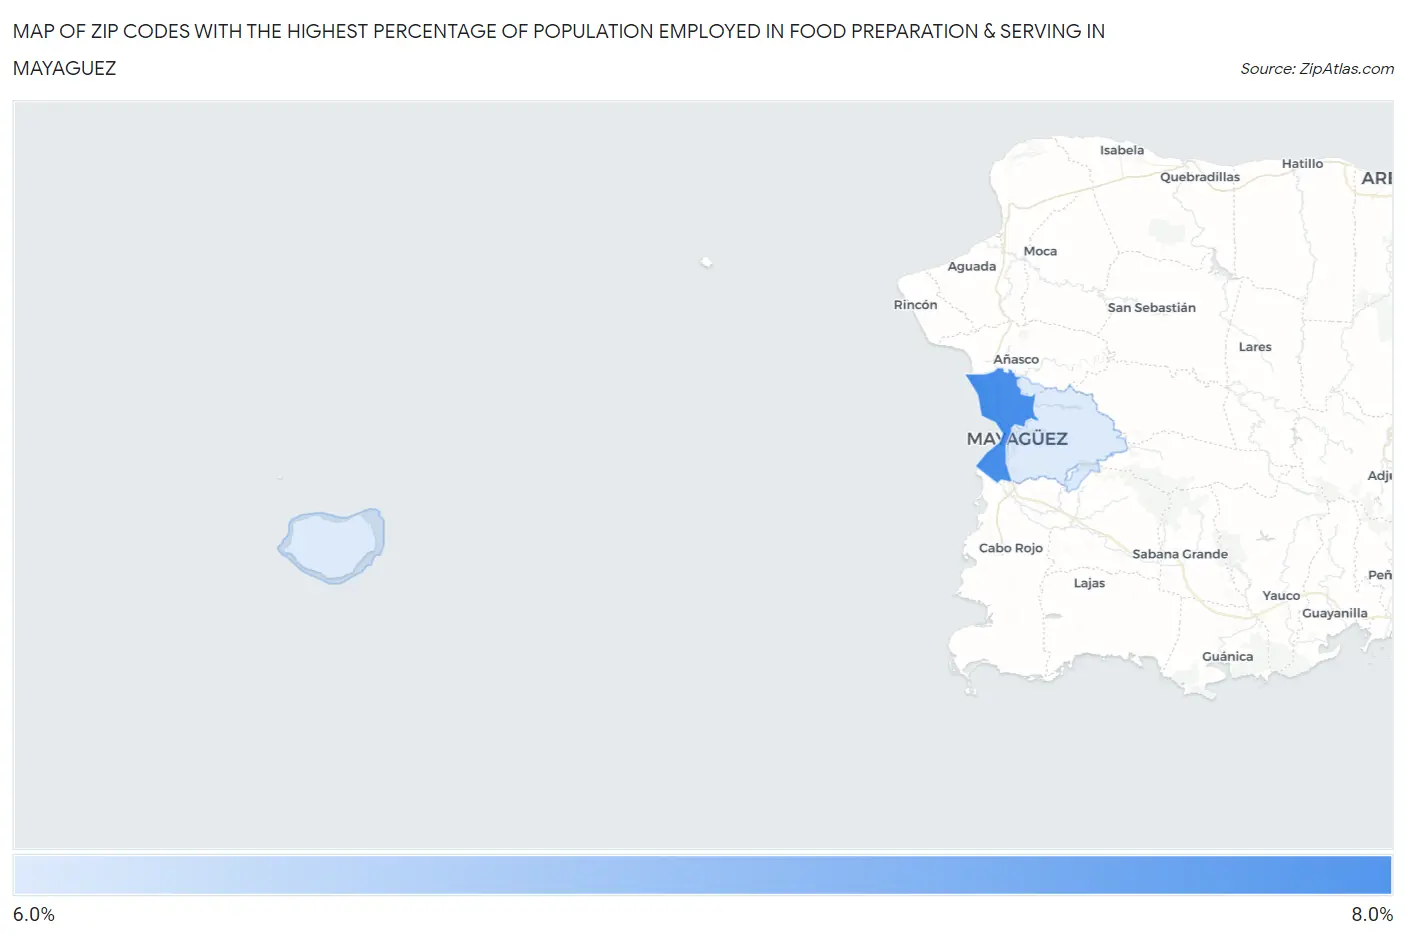
Map of Zip Codes with the Highest Percentage of Population Employed in Food Preparation & Serving in Mayaguez
6.7%
7.8%
Zip Codes with the Highest Percentage of Population Employed in Food Preparation & Serving in Mayaguez, PR
| Zip Code | % Employed | vs State | vs National | |
| 1. | 00682 | 7.8% | 5.7%(+2.07)#28 | 5.3%(+2.47)#5,138 |
| 2. | 00680 | 6.7% | 5.7%(+0.973)#45 | 5.3%(+1.37)#7,460 |
1
Common Questions
What are the Top Zip Codes with the Highest Percentage of Population Employed in Food Preparation & Serving in Mayaguez, PR?
Top Zip Codes with the Highest Percentage of Population Employed in Food Preparation & Serving in Mayaguez, PR are:
What zip code has the Highest Percentage of Population Employed in Food Preparation & Serving in Mayaguez, PR?
00682 has the Highest Percentage of Population Employed in Food Preparation & Serving in Mayaguez, PR with 7.8%.
What is the Percentage of Population Employed in Food Preparation & Serving in Mayaguez, PR?
Percentage of Population Employed in Food Preparation & Serving in Mayaguez is 7.4%.
What is the Percentage of Population Employed in Food Preparation & Serving in Puerto Rico?
Percentage of Population Employed in Food Preparation & Serving in Puerto Rico is 5.7%.
What is the Percentage of Population Employed in Food Preparation & Serving in the United States?
Percentage of Population Employed in Food Preparation & Serving in the United States is 5.3%.