Zip Codes with the Highest Percentage of Population Employed in Food Preparation & Serving in Ponce, PR
RELATED REPORTS & OPTIONS
Food Preparation & Serving
Ponce
Compare Zip Codes
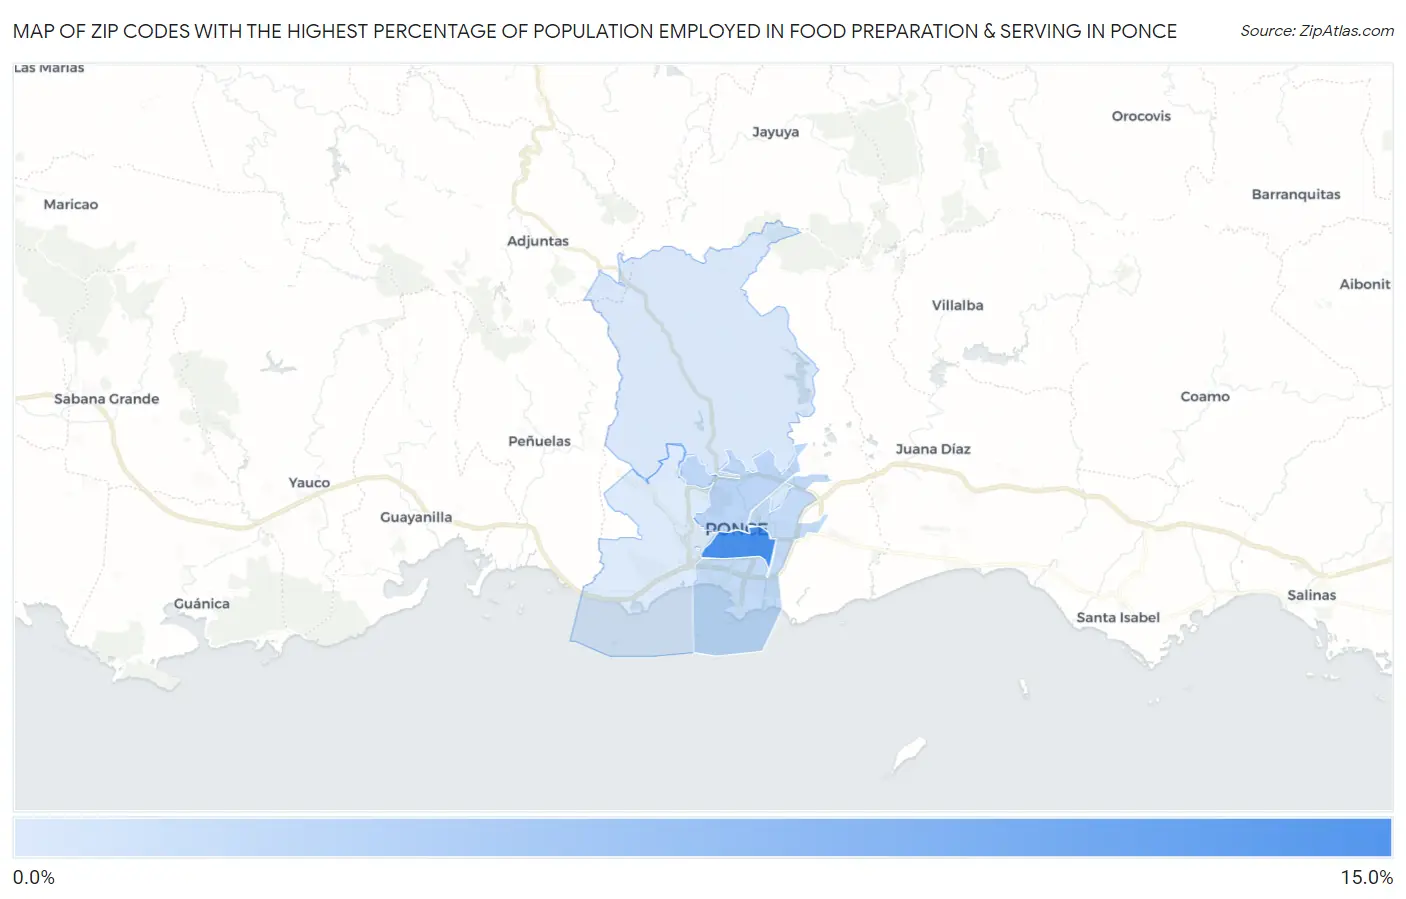
Map of Zip Codes with the Highest Percentage of Population Employed in Food Preparation & Serving in Ponce
4.9%
10.5%
Zip Codes with the Highest Percentage of Population Employed in Food Preparation & Serving in Ponce, PR
| Zip Code | % Employed | vs State | vs National | |
| 1. | 00717 | 10.5% | 5.7%(+4.83)#11 | 5.3%(+5.23)#2,322 |
| 2. | 00730 | 6.1% | 5.7%(+0.390)#59 | 5.3%(+0.787)#9,107 |
| 3. | 00716 | 5.9% | 5.7%(+0.173)#63 | 5.3%(+0.571)#9,837 |
| 4. | 00731 | 5.1% | 5.7%(-0.594)#84 | 5.3%(-0.196)#12,581 |
| 5. | 00728 | 4.9% | 5.7%(-0.778)#87 | 5.3%(-0.381)#13,320 |
1
Common Questions
What are the Top 3 Zip Codes with the Highest Percentage of Population Employed in Food Preparation & Serving in Ponce, PR?
Top 3 Zip Codes with the Highest Percentage of Population Employed in Food Preparation & Serving in Ponce, PR are:
What zip code has the Highest Percentage of Population Employed in Food Preparation & Serving in Ponce, PR?
00717 has the Highest Percentage of Population Employed in Food Preparation & Serving in Ponce, PR with 10.5%.
What is the Percentage of Population Employed in Food Preparation & Serving in Ponce, PR?
Percentage of Population Employed in Food Preparation & Serving in Ponce is 6.2%.
What is the Percentage of Population Employed in Food Preparation & Serving in Puerto Rico?
Percentage of Population Employed in Food Preparation & Serving in Puerto Rico is 5.7%.
What is the Percentage of Population Employed in Food Preparation & Serving in the United States?
Percentage of Population Employed in Food Preparation & Serving in the United States is 5.3%.