Zip Codes with the Highest Percentage of Population Employed in Accommodation & Food Services in Pittston, PA
RELATED REPORTS & OPTIONS
Accommodation & Food Services
Pittston
Compare Zip Codes
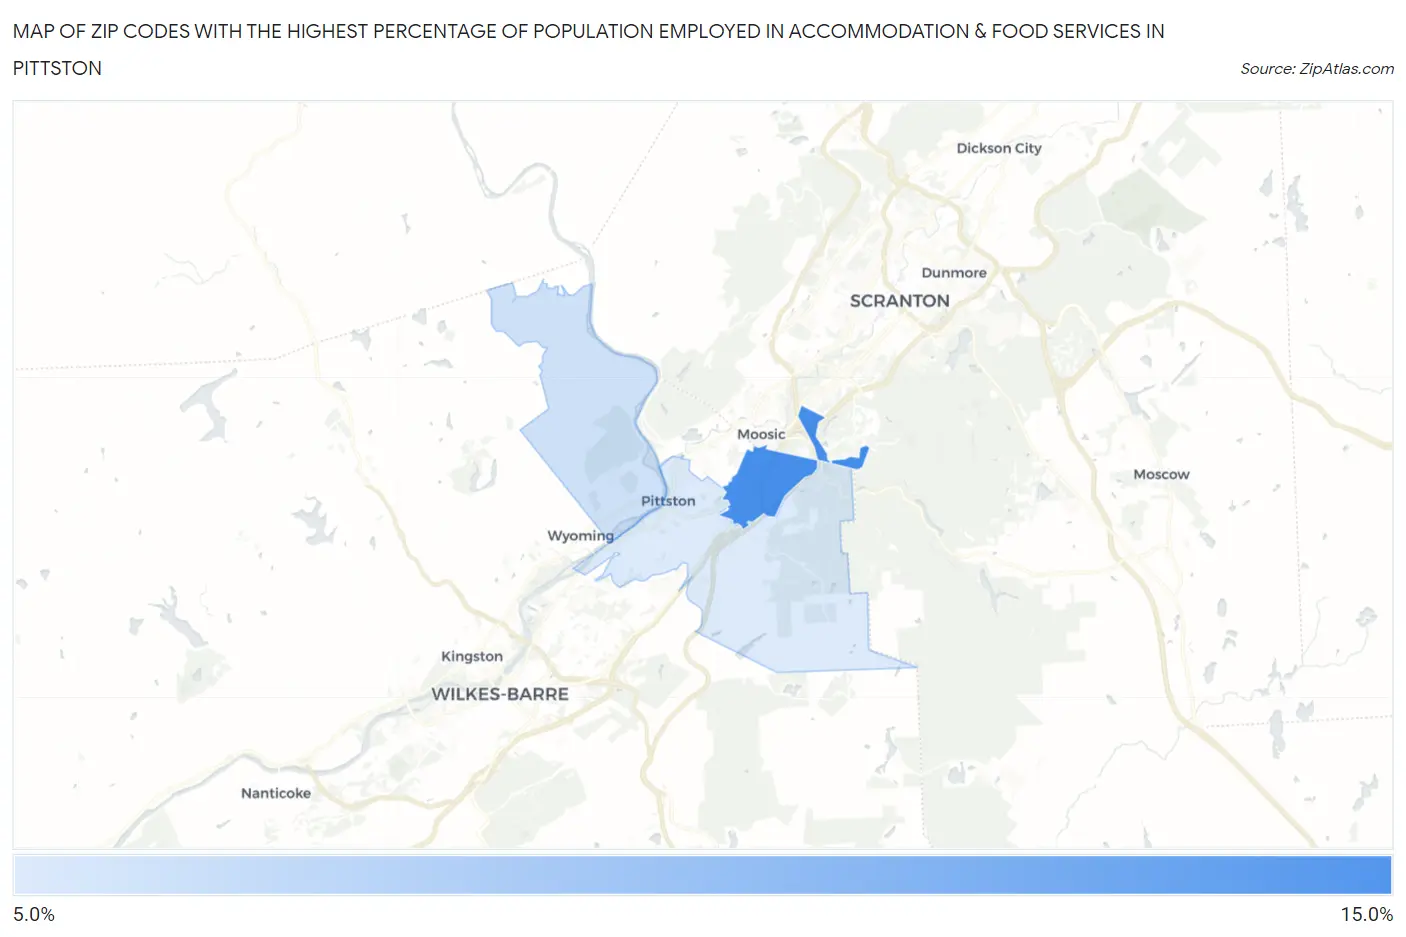
Map of Zip Codes with the Highest Percentage of Population Employed in Accommodation & Food Services in Pittston
5.5%
14.2%
Zip Codes with the Highest Percentage of Population Employed in Accommodation & Food Services in Pittston, PA
| Zip Code | % Employed | vs State | vs National | |
| 1. | 18641 | 14.2% | 5.9%(+8.32)#105 | 6.9%(+7.33)#1,901 |
| 2. | 18643 | 6.3% | 5.9%(+0.434)#588 | 6.9%(-0.558)#12,401 |
| 3. | 18640 | 5.5% | 5.9%(-0.370)#750 | 6.9%(-1.36)#14,982 |
1
Common Questions
What are the Top Zip Codes with the Highest Percentage of Population Employed in Accommodation & Food Services in Pittston, PA?
Top Zip Codes with the Highest Percentage of Population Employed in Accommodation & Food Services in Pittston, PA are:
What zip code has the Highest Percentage of Population Employed in Accommodation & Food Services in Pittston, PA?
18641 has the Highest Percentage of Population Employed in Accommodation & Food Services in Pittston, PA with 14.2%.
What is the Percentage of Population Employed in Accommodation & Food Services in Pittston, PA?
Percentage of Population Employed in Accommodation & Food Services in Pittston is 5.3%.
What is the Percentage of Population Employed in Accommodation & Food Services in Pennsylvania?
Percentage of Population Employed in Accommodation & Food Services in Pennsylvania is 5.9%.
What is the Percentage of Population Employed in Accommodation & Food Services in the United States?
Percentage of Population Employed in Accommodation & Food Services in the United States is 6.9%.