Zip Codes with the Highest Percentage of Population Employed in Legal Services & Support in Pittston, PA
RELATED REPORTS & OPTIONS
Legal Services & Support
Pittston
Compare Zip Codes
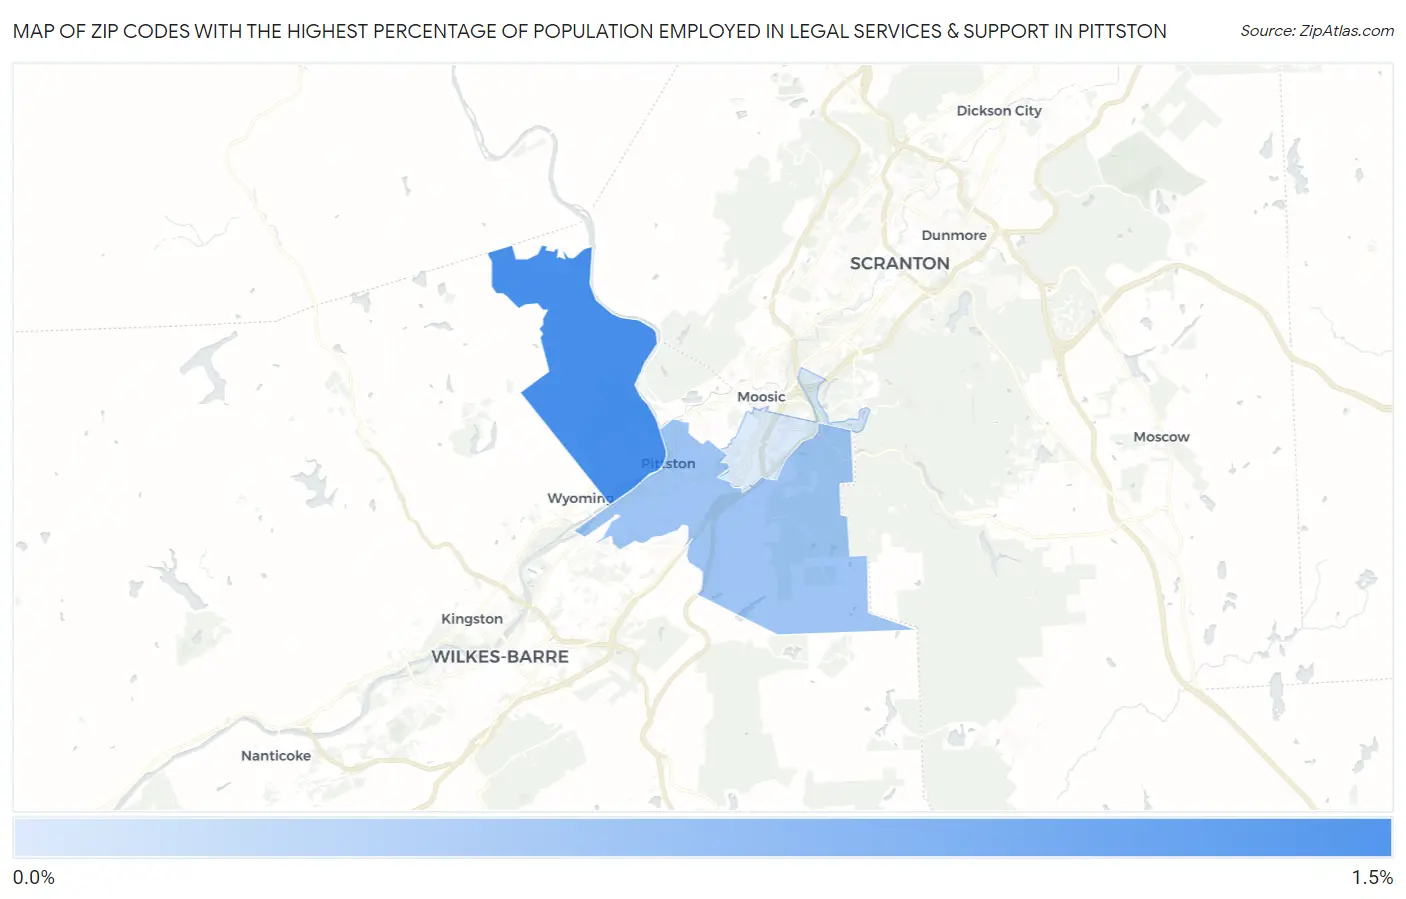
Map of Zip Codes with the Highest Percentage of Population Employed in Legal Services & Support in Pittston
0.26%
1.1%
Zip Codes with the Highest Percentage of Population Employed in Legal Services & Support in Pittston, PA
| Zip Code | % Employed | vs State | vs National | |
| 1. | 18643 | 1.1% | 1.1%(-0.038)#323 | 1.2%(-0.074)#7,104 |
| 2. | 18640 | 0.61% | 1.1%(-0.542)#550 | 1.2%(-0.578)#11,396 |
| 3. | 18641 | 0.26% | 1.1%(-0.887)#784 | 1.2%(-0.924)#15,510 |
1
Common Questions
What are the Top Zip Codes with the Highest Percentage of Population Employed in Legal Services & Support in Pittston, PA?
Top Zip Codes with the Highest Percentage of Population Employed in Legal Services & Support in Pittston, PA are:
What zip code has the Highest Percentage of Population Employed in Legal Services & Support in Pittston, PA?
18643 has the Highest Percentage of Population Employed in Legal Services & Support in Pittston, PA with 1.1%.
What is the Percentage of Population Employed in Legal Services & Support in Pittston, PA?
Percentage of Population Employed in Legal Services & Support in Pittston is 0.49%.
What is the Percentage of Population Employed in Legal Services & Support in Pennsylvania?
Percentage of Population Employed in Legal Services & Support in Pennsylvania is 1.1%.
What is the Percentage of Population Employed in Legal Services & Support in the United States?
Percentage of Population Employed in Legal Services & Support in the United States is 1.2%.