Zip Codes with the Highest Percentage of Population Employed in Architecture & Engineering in New Castle, PA
RELATED REPORTS & OPTIONS
Architecture & Engineering
New Castle
Compare Zip Codes
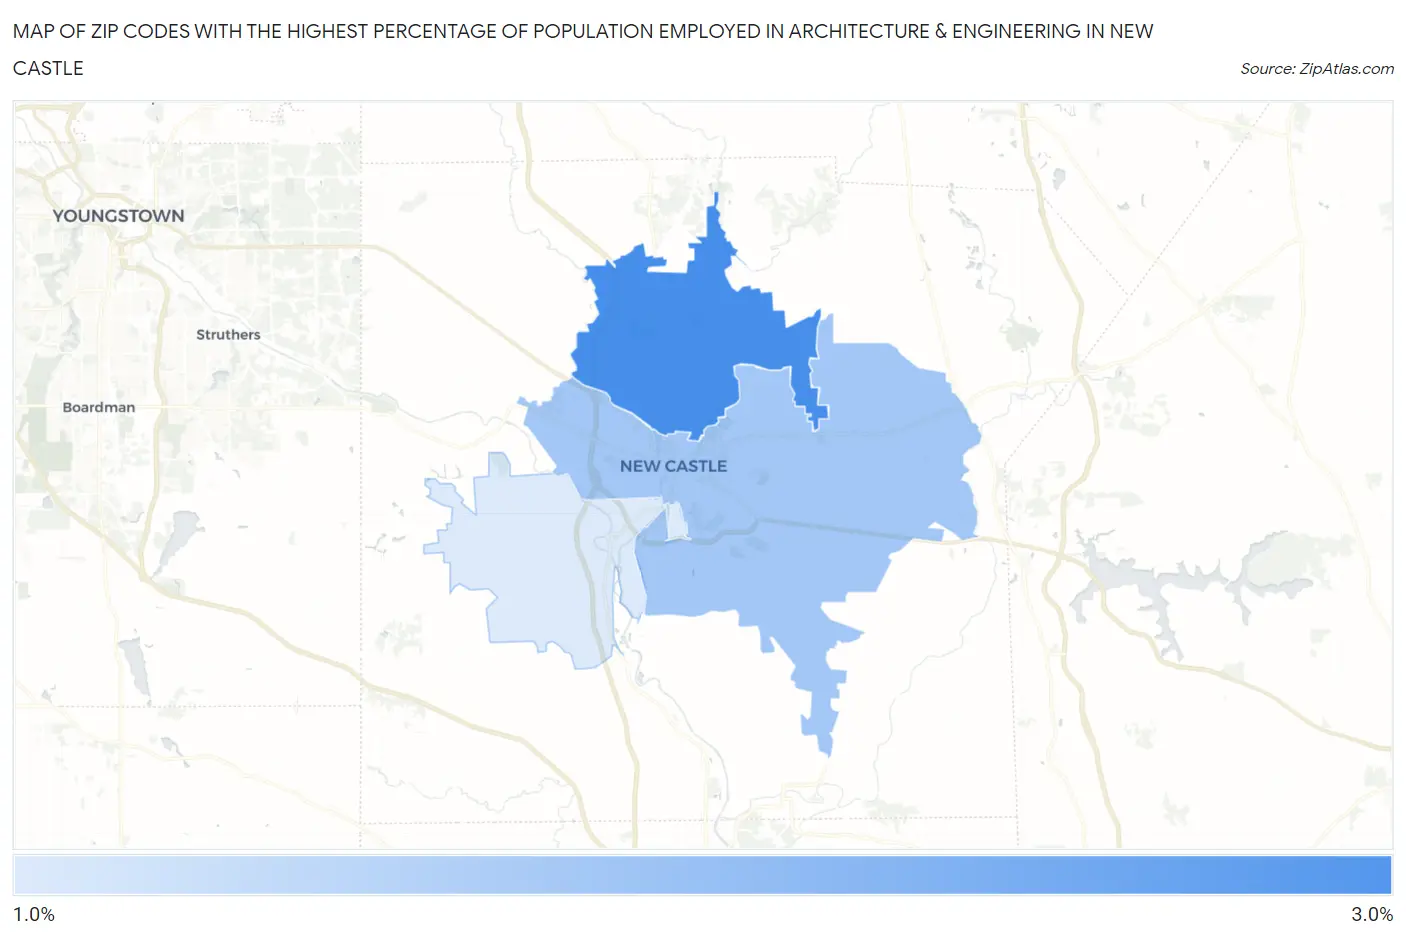
Map of Zip Codes with the Highest Percentage of Population Employed in Architecture & Engineering in New Castle
1.3%
2.6%
Zip Codes with the Highest Percentage of Population Employed in Architecture & Engineering in New Castle, PA
| Zip Code | % Employed | vs State | vs National | |
| 1. | 16105 | 2.6% | 2.0%(+0.568)#354 | 2.1%(+0.460)#6,538 |
| 2. | 16101 | 1.8% | 2.0%(-0.259)#623 | 2.1%(-0.367)#10,938 |
| 3. | 16102 | 1.3% | 2.0%(-0.782)#856 | 2.1%(-0.890)#14,602 |
1
Common Questions
What are the Top Zip Codes with the Highest Percentage of Population Employed in Architecture & Engineering in New Castle, PA?
Top Zip Codes with the Highest Percentage of Population Employed in Architecture & Engineering in New Castle, PA are:
What zip code has the Highest Percentage of Population Employed in Architecture & Engineering in New Castle, PA?
16105 has the Highest Percentage of Population Employed in Architecture & Engineering in New Castle, PA with 2.6%.
What is the Percentage of Population Employed in Architecture & Engineering in New Castle, PA?
Percentage of Population Employed in Architecture & Engineering in New Castle is 1.7%.
What is the Percentage of Population Employed in Architecture & Engineering in Pennsylvania?
Percentage of Population Employed in Architecture & Engineering in Pennsylvania is 2.0%.
What is the Percentage of Population Employed in Architecture & Engineering in the United States?
Percentage of Population Employed in Architecture & Engineering in the United States is 2.1%.