Zip Codes with the Highest Percentage of Population Employed in Legal Services & Support in New Castle, PA
RELATED REPORTS & OPTIONS
Legal Services & Support
New Castle
Compare Zip Codes
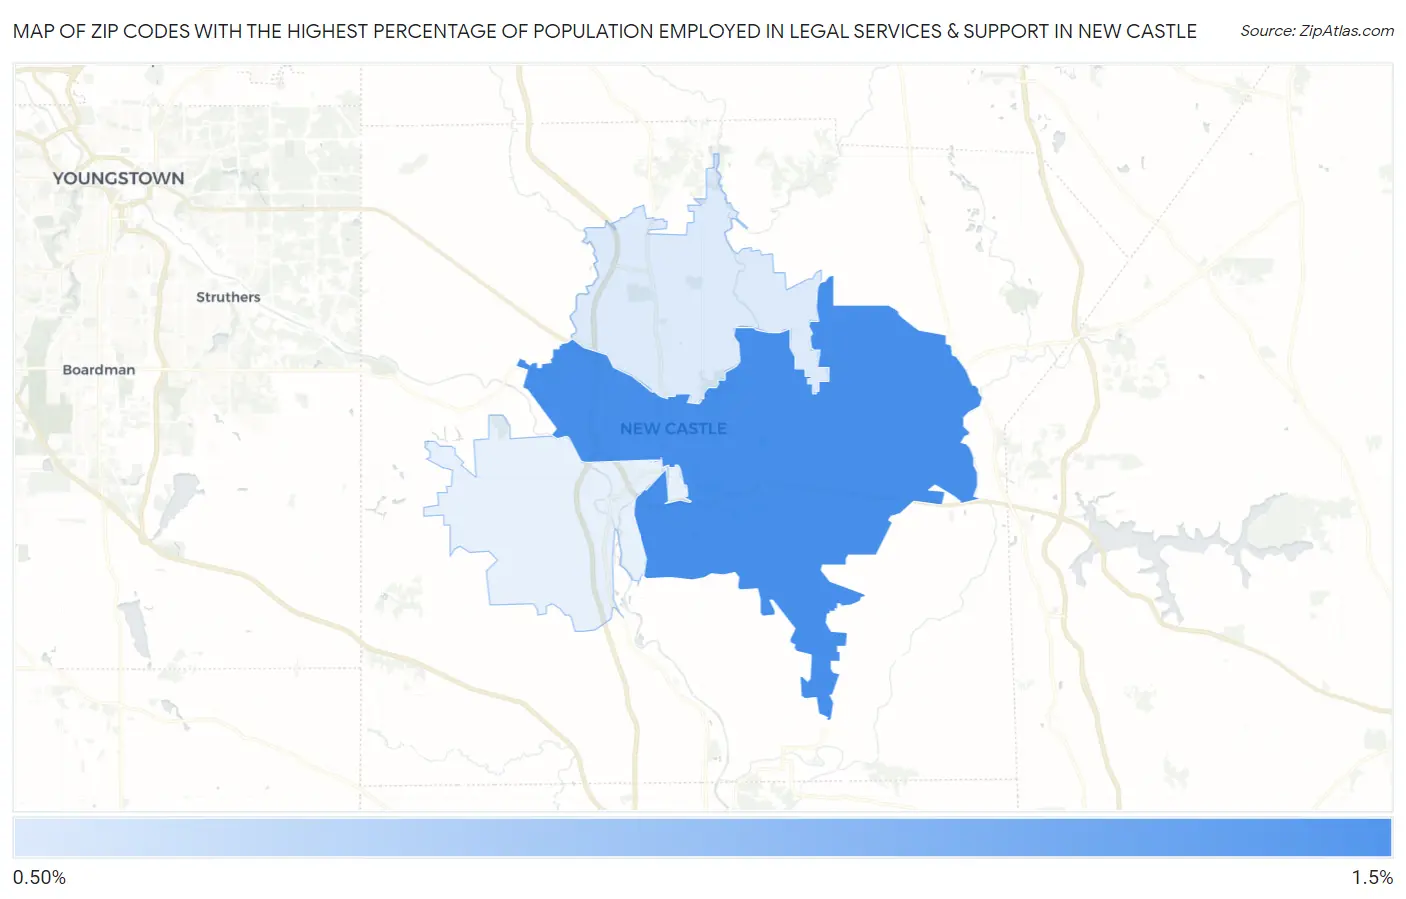
Map of Zip Codes with the Highest Percentage of Population Employed in Legal Services & Support in New Castle
0.61%
1.2%
Zip Codes with the Highest Percentage of Population Employed in Legal Services & Support in New Castle, PA
| Zip Code | % Employed | vs State | vs National | |
| 1. | 16101 | 1.2% | 1.1%(+0.021)#301 | 1.2%(-0.016)#6,719 |
| 2. | 16105 | 0.61% | 1.1%(-0.539)#548 | 1.2%(-0.575)#11,363 |
1
Common Questions
What are the Top Zip Codes with the Highest Percentage of Population Employed in Legal Services & Support in New Castle, PA?
Top Zip Codes with the Highest Percentage of Population Employed in Legal Services & Support in New Castle, PA are:
What zip code has the Highest Percentage of Population Employed in Legal Services & Support in New Castle, PA?
16101 has the Highest Percentage of Population Employed in Legal Services & Support in New Castle, PA with 1.2%.
What is the Percentage of Population Employed in Legal Services & Support in New Castle, PA?
Percentage of Population Employed in Legal Services & Support in New Castle is 0.68%.
What is the Percentage of Population Employed in Legal Services & Support in Pennsylvania?
Percentage of Population Employed in Legal Services & Support in Pennsylvania is 1.1%.
What is the Percentage of Population Employed in Legal Services & Support in the United States?
Percentage of Population Employed in Legal Services & Support in the United States is 1.2%.