Zip Codes with the Highest Percentage of Population Employed in Health Diagnosing & Treating in Easton, PA
RELATED REPORTS & OPTIONS
Health Diagnosing & Treating
Easton
Compare Zip Codes
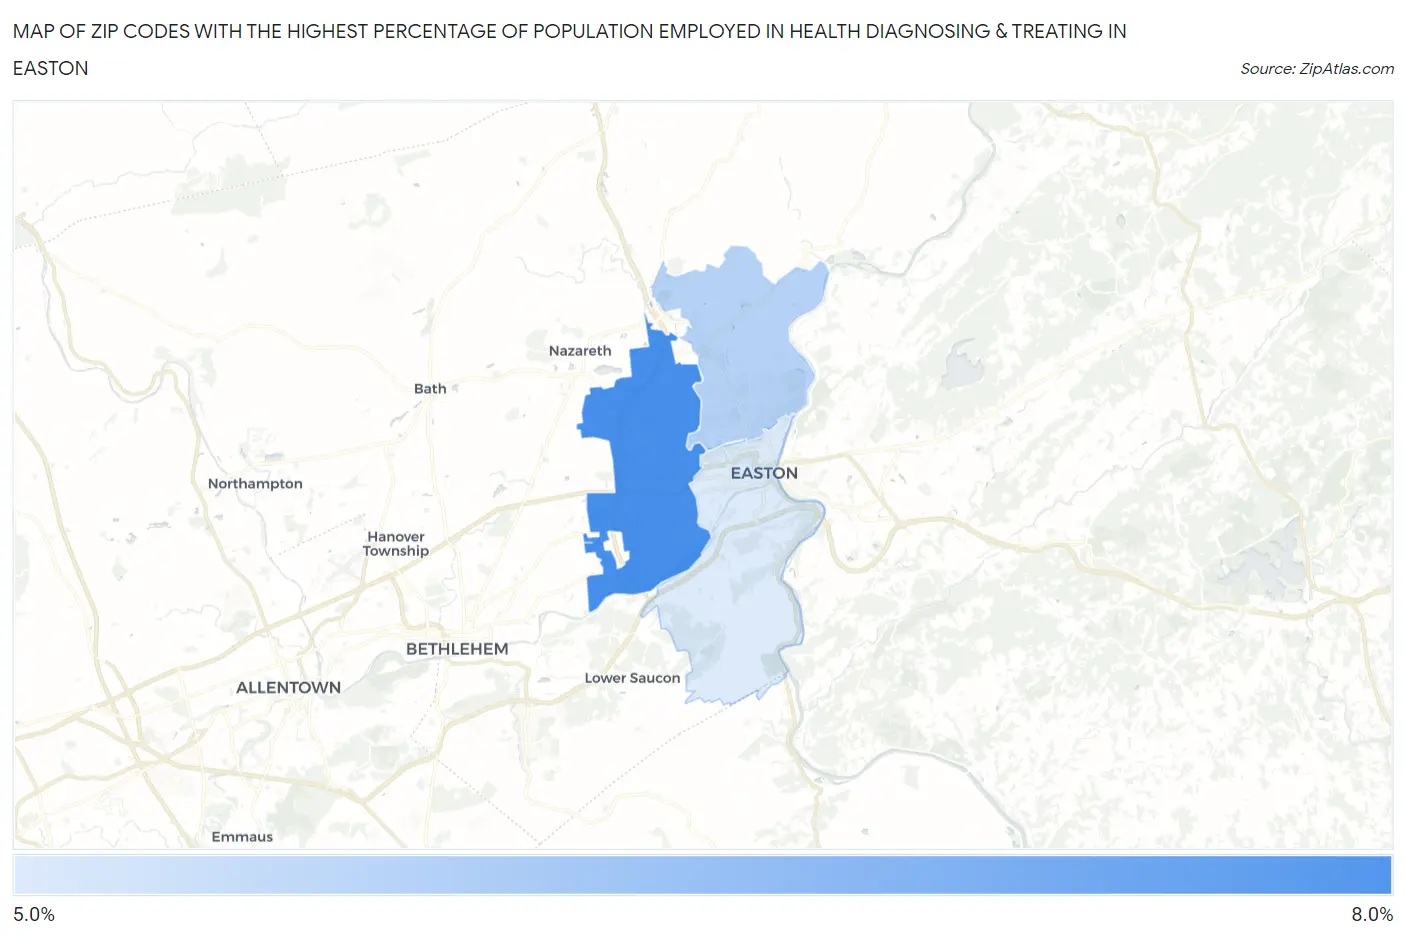
Map of Zip Codes with the Highest Percentage of Population Employed in Health Diagnosing & Treating in Easton
5.6%
7.7%
Zip Codes with the Highest Percentage of Population Employed in Health Diagnosing & Treating in Easton, PA
| Zip Code | % Employed | vs State | vs National | |
| 1. | 18045 | 7.7% | 7.4%(+0.358)#601 | 6.2%(+1.46)#8,219 |
| 2. | 18040 | 6.1% | 7.4%(-1.21)#928 | 6.2%(-0.106)#13,374 |
| 3. | 18042 | 5.6% | 7.4%(-1.75)#1,041 | 6.2%(-0.640)#15,377 |
1
Common Questions
What are the Top Zip Codes with the Highest Percentage of Population Employed in Health Diagnosing & Treating in Easton, PA?
Top Zip Codes with the Highest Percentage of Population Employed in Health Diagnosing & Treating in Easton, PA are:
What zip code has the Highest Percentage of Population Employed in Health Diagnosing & Treating in Easton, PA?
18045 has the Highest Percentage of Population Employed in Health Diagnosing & Treating in Easton, PA with 7.7%.
What is the Percentage of Population Employed in Health Diagnosing & Treating in Easton, PA?
Percentage of Population Employed in Health Diagnosing & Treating in Easton is 6.0%.
What is the Percentage of Population Employed in Health Diagnosing & Treating in Pennsylvania?
Percentage of Population Employed in Health Diagnosing & Treating in Pennsylvania is 7.4%.
What is the Percentage of Population Employed in Health Diagnosing & Treating in the United States?
Percentage of Population Employed in Health Diagnosing & Treating in the United States is 6.2%.