Zip Codes with the Highest Percentage of Population Employed in Legal Services & Support in Easton, PA
RELATED REPORTS & OPTIONS
Legal Services & Support
Easton
Compare Zip Codes
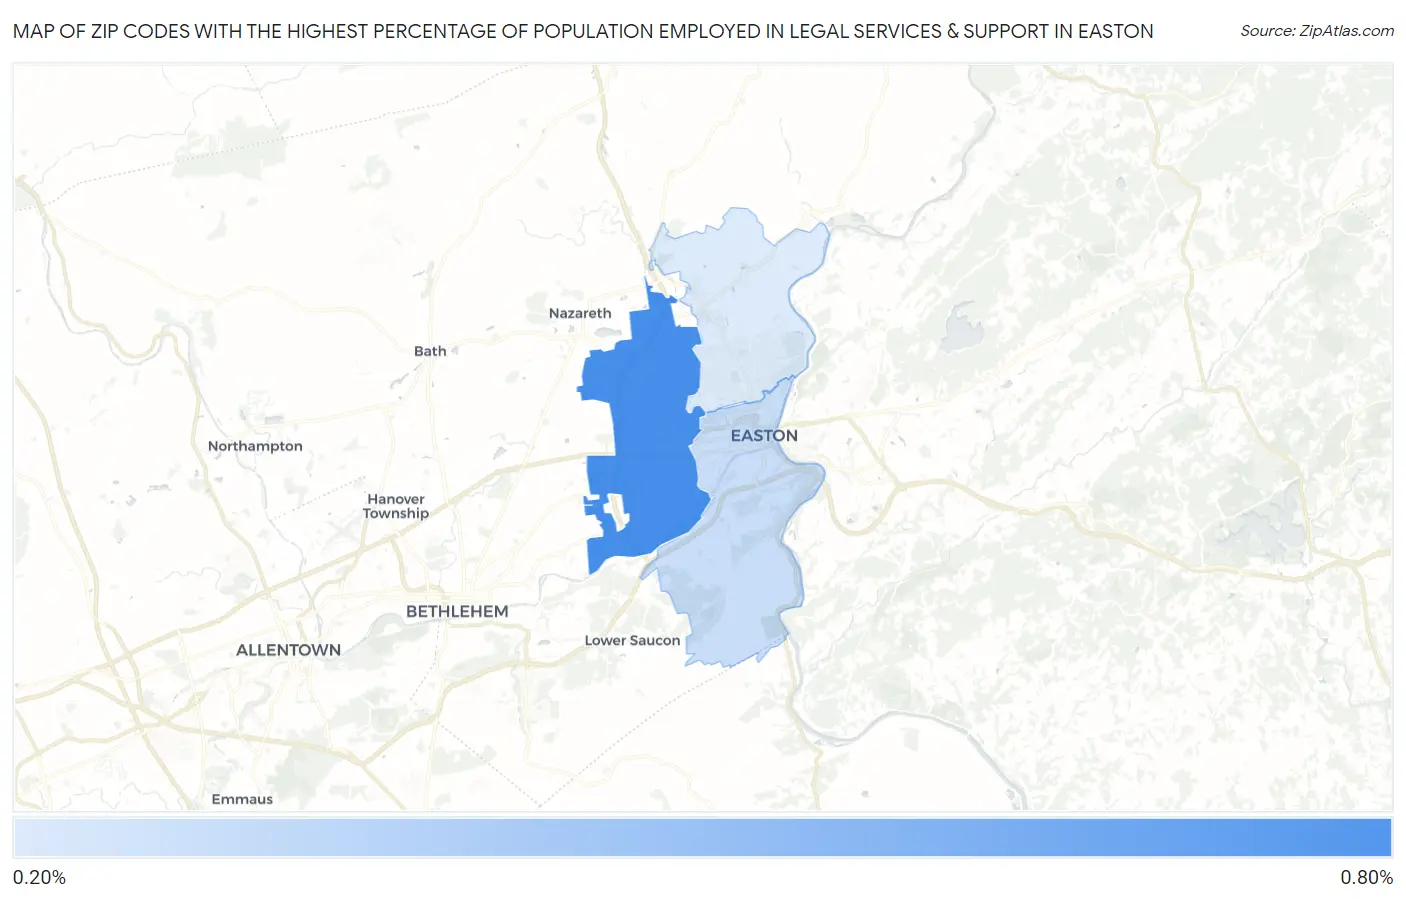
Map of Zip Codes with the Highest Percentage of Population Employed in Legal Services & Support in Easton
0.27%
0.66%
Zip Codes with the Highest Percentage of Population Employed in Legal Services & Support in Easton, PA
| Zip Code | % Employed | vs State | vs National | |
| 1. | 18045 | 0.66% | 1.1%(-0.482)#517 | 1.2%(-0.519)#10,780 |
| 2. | 18042 | 0.32% | 1.1%(-0.824)#745 | 1.2%(-0.861)#14,780 |
| 3. | 18040 | 0.27% | 1.1%(-0.881)#780 | 1.2%(-0.918)#15,439 |
1
Common Questions
What are the Top Zip Codes with the Highest Percentage of Population Employed in Legal Services & Support in Easton, PA?
Top Zip Codes with the Highest Percentage of Population Employed in Legal Services & Support in Easton, PA are:
What zip code has the Highest Percentage of Population Employed in Legal Services & Support in Easton, PA?
18045 has the Highest Percentage of Population Employed in Legal Services & Support in Easton, PA with 0.66%.
What is the Percentage of Population Employed in Legal Services & Support in Easton, PA?
Percentage of Population Employed in Legal Services & Support in Easton is 0.42%.
What is the Percentage of Population Employed in Legal Services & Support in Pennsylvania?
Percentage of Population Employed in Legal Services & Support in Pennsylvania is 1.1%.
What is the Percentage of Population Employed in Legal Services & Support in the United States?
Percentage of Population Employed in Legal Services & Support in the United States is 1.2%.