Zip Codes with the Highest Percentage of Population Employed in Legal Services & Support in Hattiesburg, MS
RELATED REPORTS & OPTIONS
Legal Services & Support
Hattiesburg
Compare Zip Codes
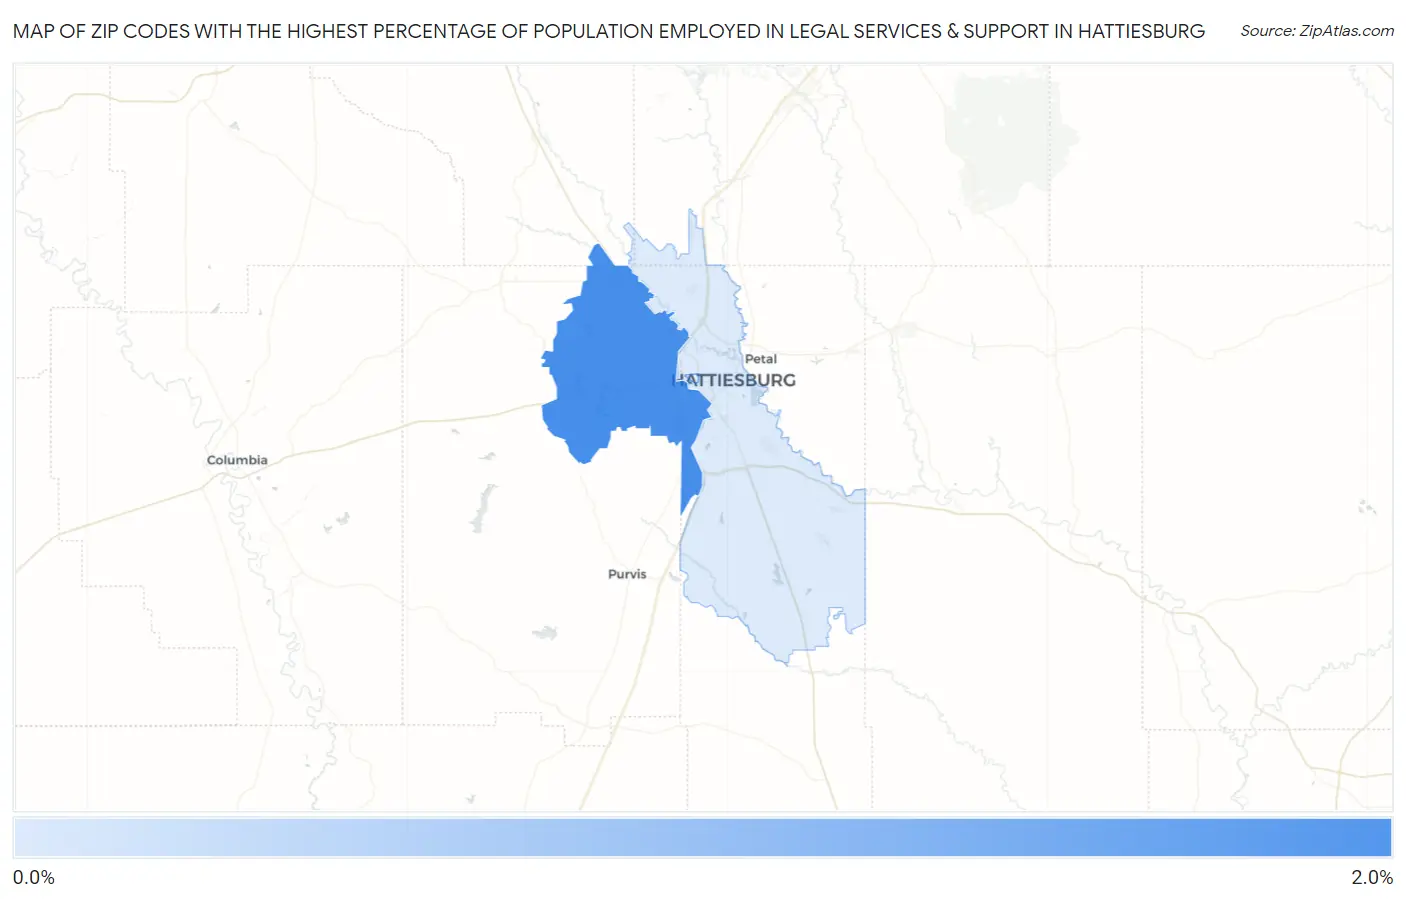
Map of Zip Codes with the Highest Percentage of Population Employed in Legal Services & Support in Hattiesburg
0.56%
1.5%
Zip Codes with the Highest Percentage of Population Employed in Legal Services & Support in Hattiesburg, MS
| Zip Code | % Employed | vs State | vs National | |
| 1. | 39402 | 1.5% | 0.75%(+0.768)#49 | 1.2%(+0.330)#4,995 |
| 2. | 39401 | 0.56% | 0.75%(-0.188)#92 | 1.2%(-0.626)#11,962 |
1
Common Questions
What are the Top Zip Codes with the Highest Percentage of Population Employed in Legal Services & Support in Hattiesburg, MS?
Top Zip Codes with the Highest Percentage of Population Employed in Legal Services & Support in Hattiesburg, MS are:
What zip code has the Highest Percentage of Population Employed in Legal Services & Support in Hattiesburg, MS?
39402 has the Highest Percentage of Population Employed in Legal Services & Support in Hattiesburg, MS with 1.5%.
What is the Percentage of Population Employed in Legal Services & Support in Hattiesburg, MS?
Percentage of Population Employed in Legal Services & Support in Hattiesburg is 1.4%.
What is the Percentage of Population Employed in Legal Services & Support in Mississippi?
Percentage of Population Employed in Legal Services & Support in Mississippi is 0.75%.
What is the Percentage of Population Employed in Legal Services & Support in the United States?
Percentage of Population Employed in Legal Services & Support in the United States is 1.2%.