Zip Codes with the Highest Percentage of Population with a Degree in Liberal Arts and History in Hattiesburg, MS
RELATED REPORTS & OPTIONS
Liberal Arts and History
Hattiesburg
Compare Zip Codes
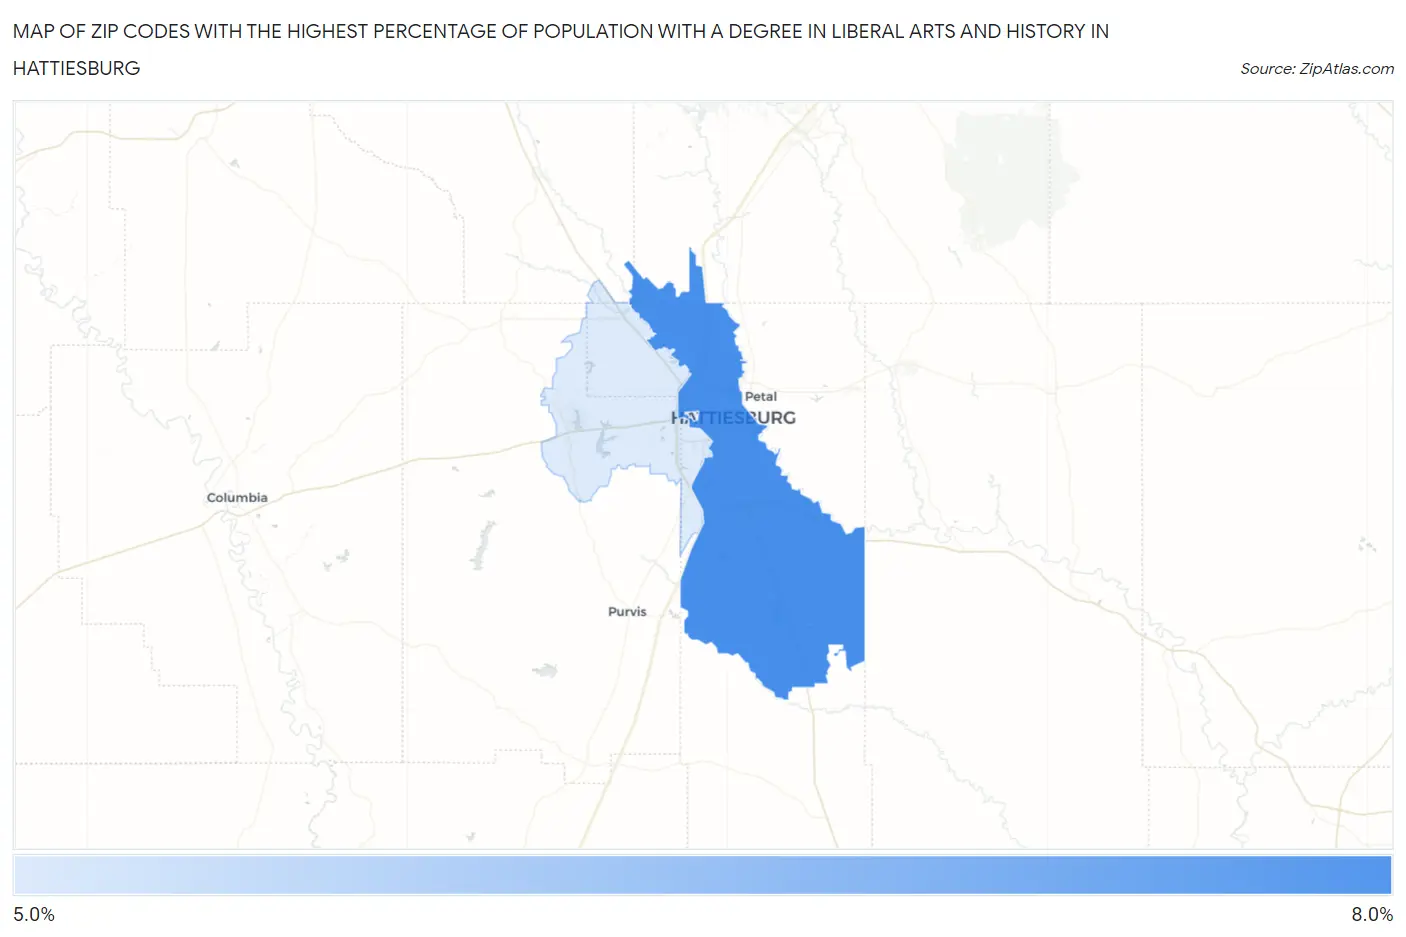
Map of Zip Codes with the Highest Percentage of Population with a Degree in Liberal Arts and History in Hattiesburg
5.5%
6.8%
Zip Codes with the Highest Percentage of Population with a Degree in Liberal Arts and History in Hattiesburg, MS
| Zip Code | % Graduates | vs State | vs National | |
| 1. | 39401 | 6.8% | 4.2%(+2.65)#71 | 4.9%(+1.94)#6,730 |
| 2. | 39402 | 5.5% | 4.2%(+1.36)#98 | 4.9%(+0.639)#9,843 |
1
Common Questions
What are the Top Zip Codes with the Highest Percentage of Population with a Degree in Liberal Arts and History in Hattiesburg, MS?
Top Zip Codes with the Highest Percentage of Population with a Degree in Liberal Arts and History in Hattiesburg, MS are:
What zip code has the Highest Percentage of Population with a Degree in Liberal Arts and History in Hattiesburg, MS?
39401 has the Highest Percentage of Population with a Degree in Liberal Arts and History in Hattiesburg, MS with 6.8%.
What is the Percentage of Population with a Degree in Liberal Arts and History in Hattiesburg, MS?
Percentage of Population with a Degree in Liberal Arts and History in Hattiesburg is 7.5%.
What is the Percentage of Population with a Degree in Liberal Arts and History in Mississippi?
Percentage of Population with a Degree in Liberal Arts and History in Mississippi is 4.2%.
What is the Percentage of Population with a Degree in Liberal Arts and History in the United States?
Percentage of Population with a Degree in Liberal Arts and History in the United States is 4.9%.