Zip Codes with the Highest Percentage of Population Employed in Accommodation & Food Services in Hattiesburg, MS
RELATED REPORTS & OPTIONS
Accommodation & Food Services
Hattiesburg
Compare Zip Codes
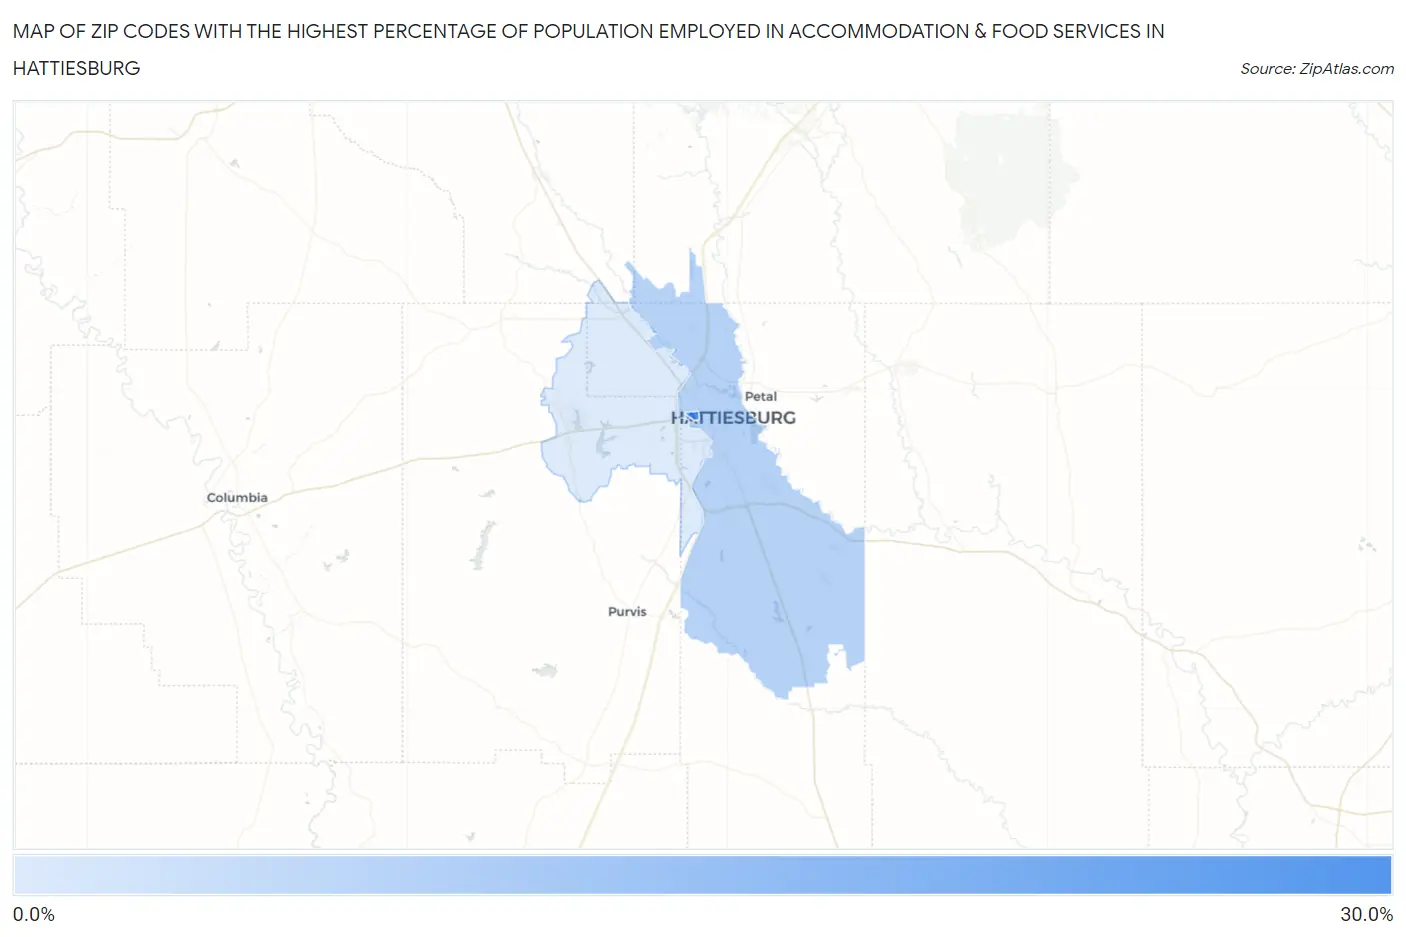
Map of Zip Codes with the Highest Percentage of Population Employed in Accommodation & Food Services in Hattiesburg
9.3%
27.3%
Zip Codes with the Highest Percentage of Population Employed in Accommodation & Food Services in Hattiesburg, MS
| Zip Code | % Employed | vs State | vs National | |
| 1. | 39406 | 27.3% | 6.9%(+20.4)#5 | 6.9%(+20.4)#410 |
| 2. | 39401 | 13.6% | 6.9%(+6.73)#26 | 6.9%(+6.76)#2,076 |
| 3. | 39402 | 9.3% | 6.9%(+2.39)#73 | 6.9%(+2.41)#5,512 |
1
Common Questions
What are the Top Zip Codes with the Highest Percentage of Population Employed in Accommodation & Food Services in Hattiesburg, MS?
Top Zip Codes with the Highest Percentage of Population Employed in Accommodation & Food Services in Hattiesburg, MS are:
What zip code has the Highest Percentage of Population Employed in Accommodation & Food Services in Hattiesburg, MS?
39406 has the Highest Percentage of Population Employed in Accommodation & Food Services in Hattiesburg, MS with 27.3%.
What is the Percentage of Population Employed in Accommodation & Food Services in Hattiesburg, MS?
Percentage of Population Employed in Accommodation & Food Services in Hattiesburg is 15.1%.
What is the Percentage of Population Employed in Accommodation & Food Services in Mississippi?
Percentage of Population Employed in Accommodation & Food Services in Mississippi is 6.9%.
What is the Percentage of Population Employed in Accommodation & Food Services in the United States?
Percentage of Population Employed in Accommodation & Food Services in the United States is 6.9%.