Zip Codes with the Highest Percentage of Population Employed in Arts, Entertainment & Recreation in Hattiesburg, MS
RELATED REPORTS & OPTIONS
Arts, Entertainment & Recreation
Hattiesburg
Compare Zip Codes
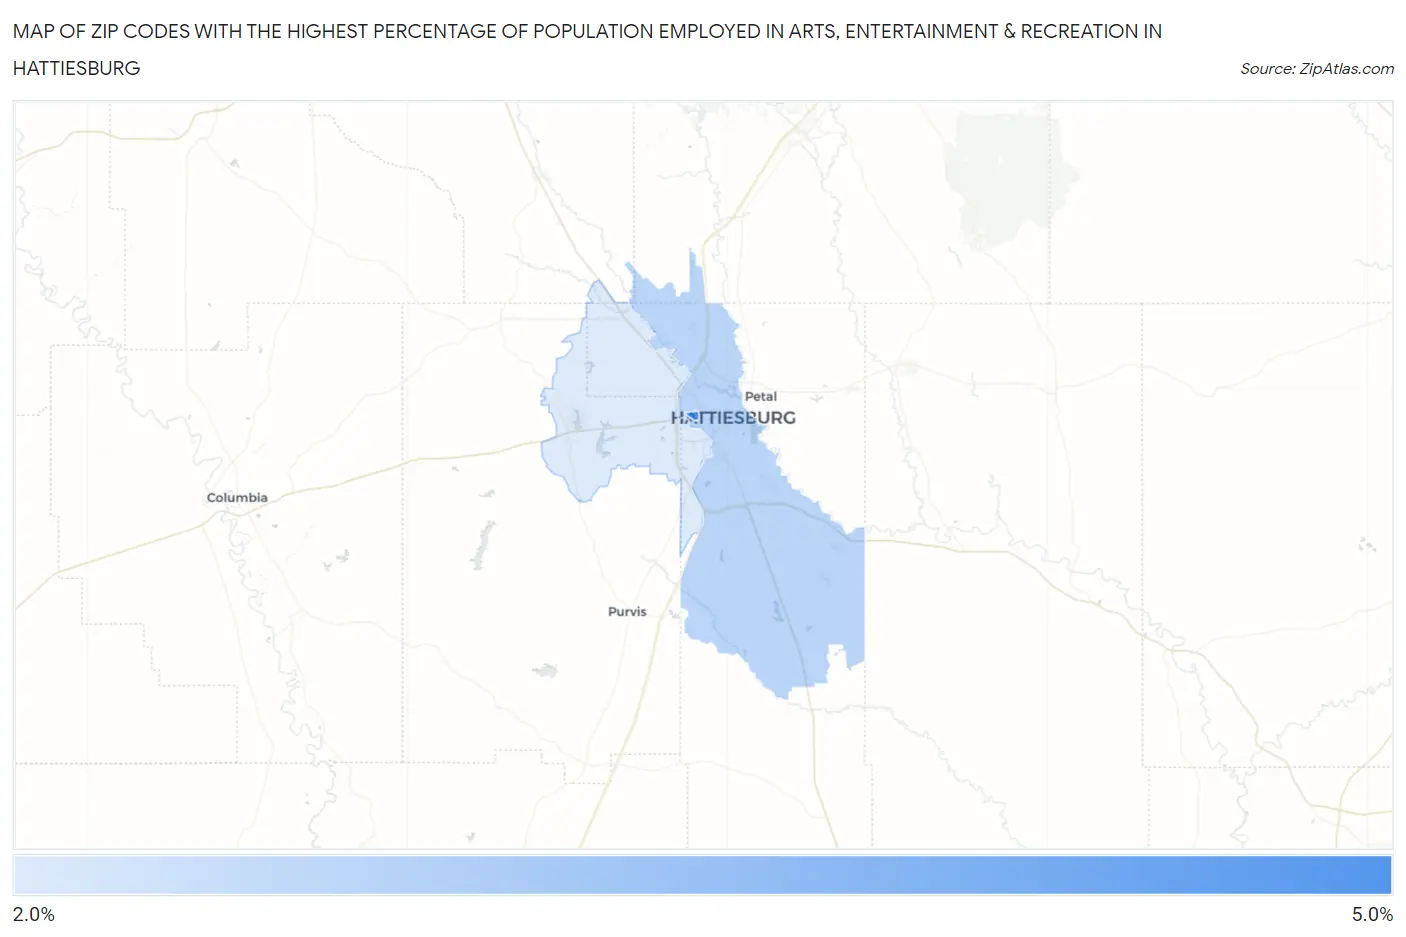
Map of Zip Codes with the Highest Percentage of Population Employed in Arts, Entertainment & Recreation in Hattiesburg
2.9%
4.3%
Zip Codes with the Highest Percentage of Population Employed in Arts, Entertainment & Recreation in Hattiesburg, MS
| Zip Code | % Employed | vs State | vs National | |
| 1. | 39406 | 4.3% | 2.1%(+2.16)#49 | 2.1%(+2.21)#2,976 |
| 2. | 39401 | 3.3% | 2.1%(+1.12)#63 | 2.1%(+1.17)#4,669 |
| 3. | 39402 | 2.9% | 2.1%(+0.800)#66 | 2.1%(+0.852)#5,554 |
1
Common Questions
What are the Top Zip Codes with the Highest Percentage of Population Employed in Arts, Entertainment & Recreation in Hattiesburg, MS?
Top Zip Codes with the Highest Percentage of Population Employed in Arts, Entertainment & Recreation in Hattiesburg, MS are:
What zip code has the Highest Percentage of Population Employed in Arts, Entertainment & Recreation in Hattiesburg, MS?
39406 has the Highest Percentage of Population Employed in Arts, Entertainment & Recreation in Hattiesburg, MS with 4.3%.
What is the Percentage of Population Employed in Arts, Entertainment & Recreation in Hattiesburg, MS?
Percentage of Population Employed in Arts, Entertainment & Recreation in Hattiesburg is 3.5%.
What is the Percentage of Population Employed in Arts, Entertainment & Recreation in Mississippi?
Percentage of Population Employed in Arts, Entertainment & Recreation in Mississippi is 2.1%.
What is the Percentage of Population Employed in Arts, Entertainment & Recreation in the United States?
Percentage of Population Employed in Arts, Entertainment & Recreation in the United States is 2.1%.