Zip Codes with the Highest Percentage of Population Employed in Architecture & Engineering in Springfield, MO
RELATED REPORTS & OPTIONS
Architecture & Engineering
Springfield
Compare Zip Codes
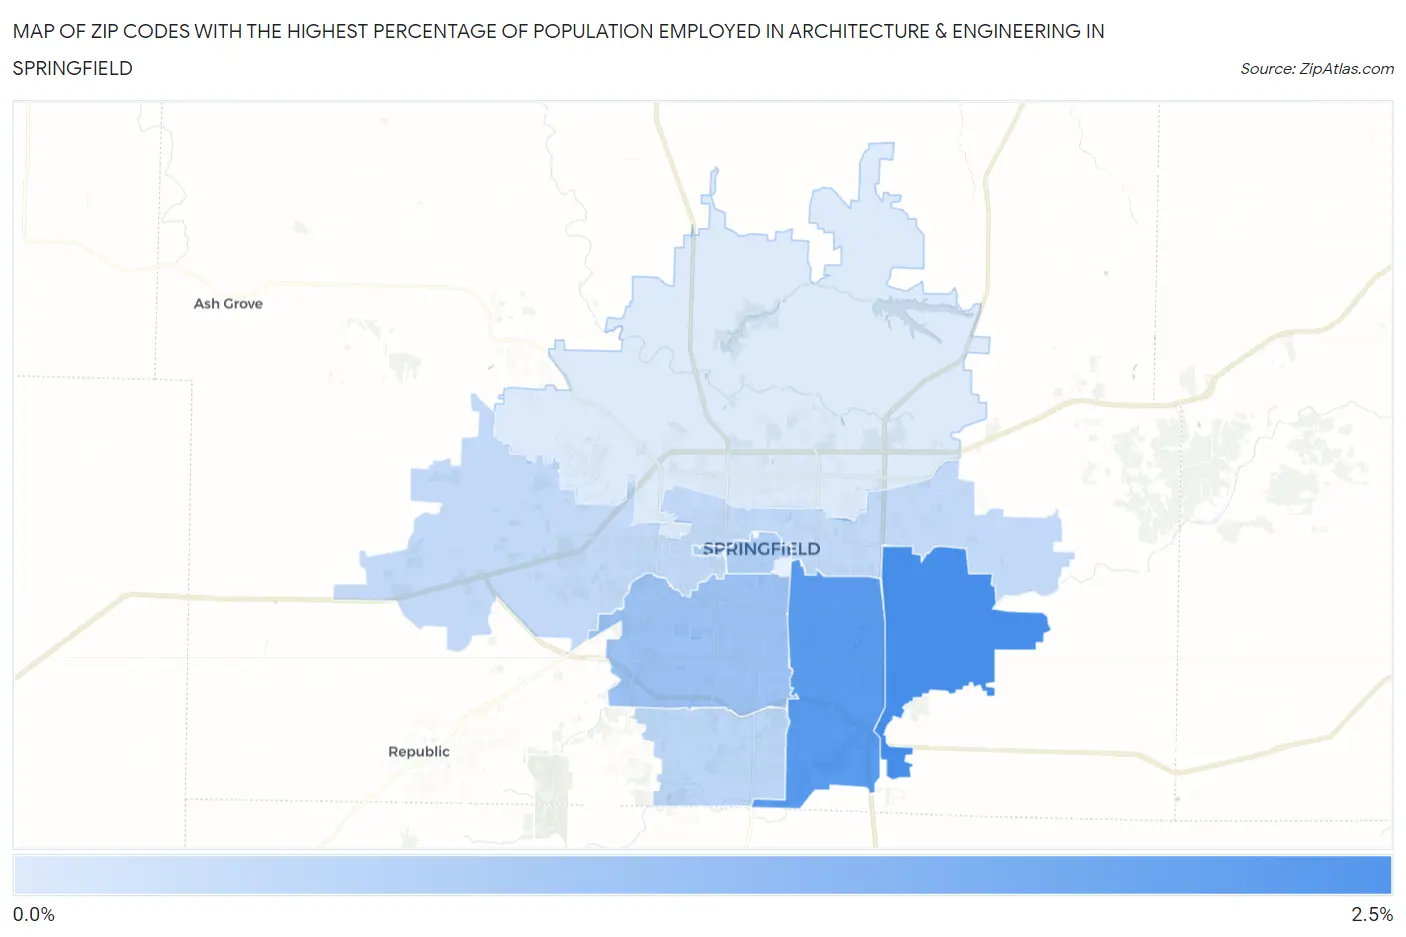
Map of Zip Codes with the Highest Percentage of Population Employed in Architecture & Engineering in Springfield
0.41%
2.2%
Zip Codes with the Highest Percentage of Population Employed in Architecture & Engineering in Springfield, MO
| Zip Code | % Employed | vs State | vs National | |
| 1. | 65809 | 2.2% | 1.7%(+0.482)#151 | 2.1%(+0.037)#8,556 |
| 2. | 65804 | 2.0% | 1.7%(+0.299)#177 | 2.1%(-0.146)#9,579 |
| 3. | 65807 | 1.2% | 1.7%(-0.507)#300 | 2.1%(-0.952)#15,100 |
| 4. | 65806 | 0.97% | 1.7%(-0.736)#356 | 2.1%(-1.18)#16,851 |
| 5. | 65810 | 0.78% | 1.7%(-0.923)#408 | 2.1%(-1.37)#18,281 |
| 6. | 65802 | 0.75% | 1.7%(-0.952)#417 | 2.1%(-1.40)#18,516 |
| 7. | 65803 | 0.41% | 1.7%(-1.29)#488 | 2.1%(-1.73)#20,855 |
1
Common Questions
What are the Top 5 Zip Codes with the Highest Percentage of Population Employed in Architecture & Engineering in Springfield, MO?
Top 5 Zip Codes with the Highest Percentage of Population Employed in Architecture & Engineering in Springfield, MO are:
What zip code has the Highest Percentage of Population Employed in Architecture & Engineering in Springfield, MO?
65809 has the Highest Percentage of Population Employed in Architecture & Engineering in Springfield, MO with 2.2%.
What is the Percentage of Population Employed in Architecture & Engineering in Springfield, MO?
Percentage of Population Employed in Architecture & Engineering in Springfield is 1.2%.
What is the Percentage of Population Employed in Architecture & Engineering in Missouri?
Percentage of Population Employed in Architecture & Engineering in Missouri is 1.7%.
What is the Percentage of Population Employed in Architecture & Engineering in the United States?
Percentage of Population Employed in Architecture & Engineering in the United States is 2.1%.