Zip Codes with the Highest Percentage of Population Employed in Community & Social Service in Springfield, MO
RELATED REPORTS & OPTIONS
Community & Social Service
Springfield
Compare Zip Codes
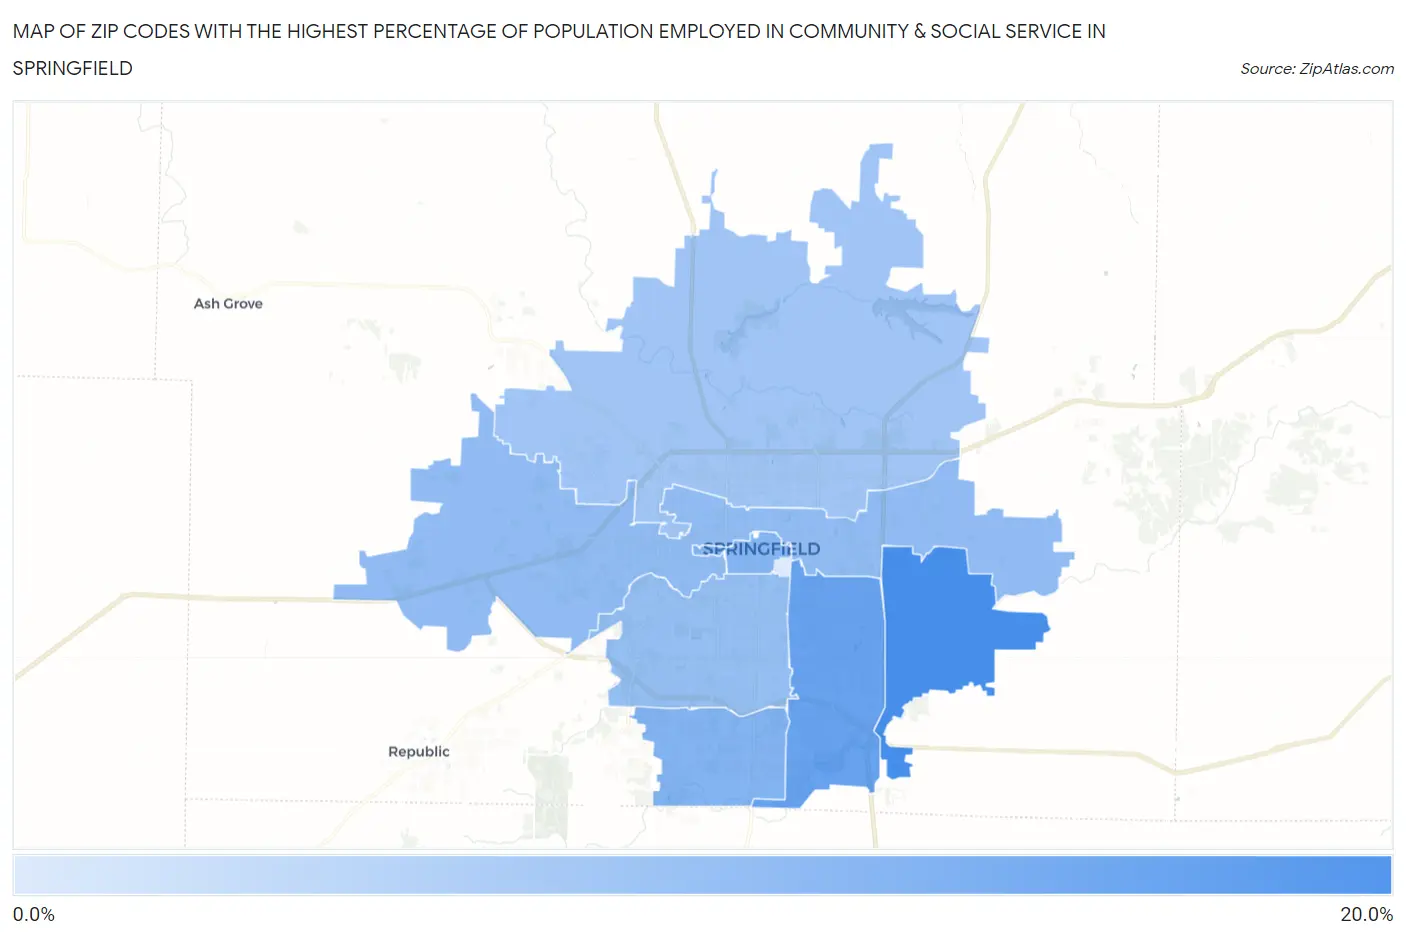
Map of Zip Codes with the Highest Percentage of Population Employed in Community & Social Service in Springfield
7.1%
16.3%
Zip Codes with the Highest Percentage of Population Employed in Community & Social Service in Springfield, MO
| Zip Code | % Employed | vs State | vs National | |
| 1. | 65809 | 16.3% | 10.6%(+5.73)#87 | 11.2%(+5.08)#3,845 |
| 2. | 65804 | 14.2% | 10.6%(+3.68)#138 | 11.2%(+3.03)#5,780 |
| 3. | 65810 | 12.6% | 10.6%(+2.01)#194 | 11.2%(+1.36)#8,289 |
| 4. | 65806 | 12.3% | 10.6%(+1.74)#206 | 11.2%(+1.10)#8,754 |
| 5. | 65802 | 11.6% | 10.6%(+1.06)#239 | 11.2%(+0.416)#10,158 |
| 6. | 65807 | 11.4% | 10.6%(+0.859)#248 | 11.2%(+0.210)#10,620 |
| 7. | 65803 | 10.7% | 10.6%(+0.131)#295 | 11.2%(-0.517)#12,390 |
| 8. | 65897 | 7.1% | 10.6%(-3.49)#583 | 11.2%(-4.14)#21,954 |
1
Common Questions
What are the Top 5 Zip Codes with the Highest Percentage of Population Employed in Community & Social Service in Springfield, MO?
Top 5 Zip Codes with the Highest Percentage of Population Employed in Community & Social Service in Springfield, MO are:
What zip code has the Highest Percentage of Population Employed in Community & Social Service in Springfield, MO?
65809 has the Highest Percentage of Population Employed in Community & Social Service in Springfield, MO with 16.3%.
What is the Percentage of Population Employed in Community & Social Service in Springfield, MO?
Percentage of Population Employed in Community & Social Service in Springfield is 12.1%.
What is the Percentage of Population Employed in Community & Social Service in Missouri?
Percentage of Population Employed in Community & Social Service in Missouri is 10.6%.
What is the Percentage of Population Employed in Community & Social Service in the United States?
Percentage of Population Employed in Community & Social Service in the United States is 11.2%.