Zip Codes with the Highest Percentage of Households Without a Vehicle in Springfield, MO
RELATED REPORTS & OPTIONS
Households without a Cars
Springfield
Compare Zip Codes
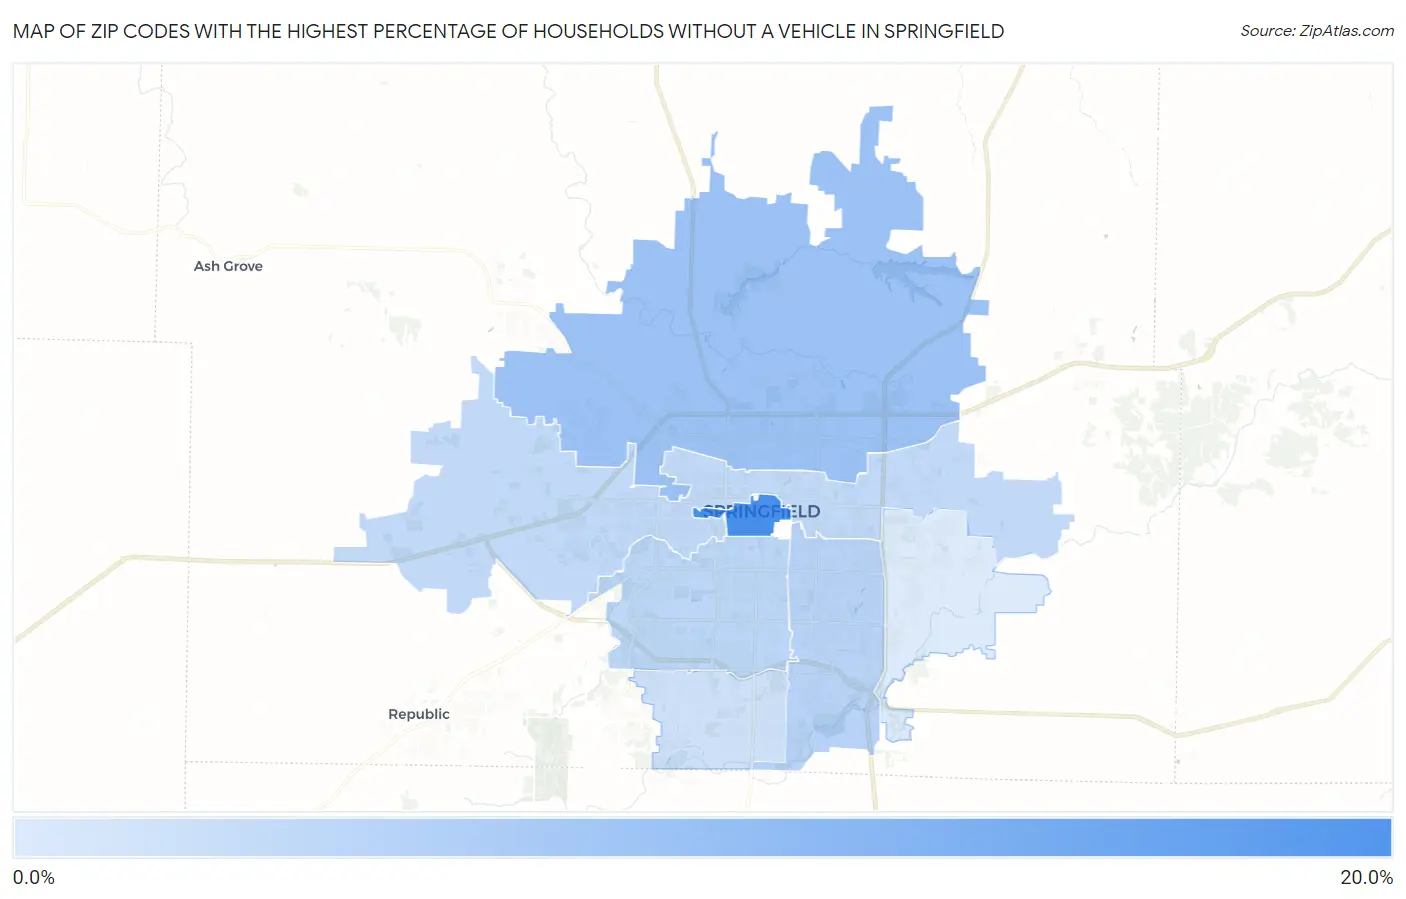
Map of Zip Codes with the Highest Percentage of Households Without a Vehicle in Springfield
4.0%
19.6%
Zip Codes with the Highest Percentage of Households Without a Vehicle in Springfield, MO
| Zip Code | Housholds Without a Car | vs State | vs National | |
| 1. | 65806 | 19.6% | 6.6%(+13.0)#39 | 8.3%(+11.3)#1,555 |
| 2. | 65803 | 10.6% | 6.6%(+4.00)#102 | 8.3%(+2.30)#4,379 |
| 3. | 65804 | 7.6% | 6.6%(+1.000)#214 | 8.3%(-0.700)#7,536 |
| 4. | 65807 | 7.1% | 6.6%(+0.500)#245 | 8.3%(-1.20)#8,353 |
| 5. | 65802 | 6.8% | 6.6%(+0.200)#265 | 8.3%(-1.50)#8,844 |
| 6. | 65810 | 5.4% | 6.6%(-1.20)#366 | 8.3%(-2.90)#11,864 |
| 7. | 65809 | 4.0% | 6.6%(-2.60)#503 | 8.3%(-4.30)#15,779 |
1
Common Questions
What are the Top 5 Zip Codes with the Highest Percentage of Households Without a Vehicle in Springfield, MO?
Top 5 Zip Codes with the Highest Percentage of Households Without a Vehicle in Springfield, MO are:
What zip code has the Highest Percentage of Households Without a Vehicle in Springfield, MO?
65806 has the Highest Percentage of Households Without a Vehicle in Springfield, MO with 19.6%.
What is the Percentage of Households Without a Vehicle in Springfield, MO?
Percentage of Households Without a Vehicle in Springfield is 10.2%.
What is the Percentage of Households Without a Vehicle in Missouri?
Percentage of Households Without a Vehicle in Missouri is 6.6%.
What is the Percentage of Households Without a Vehicle in the United States?
Percentage of Households Without a Vehicle in the United States is 8.3%.