Zip Codes with the Highest Percentage of Immigrants from Korea in Springfield, MO
RELATED REPORTS & OPTIONS
Korea
Springfield
Compare Zip Codes
Map of Zip Codes with the Highest Percentage of Immigrants from Korea in Springfield
0.033%
0.49%
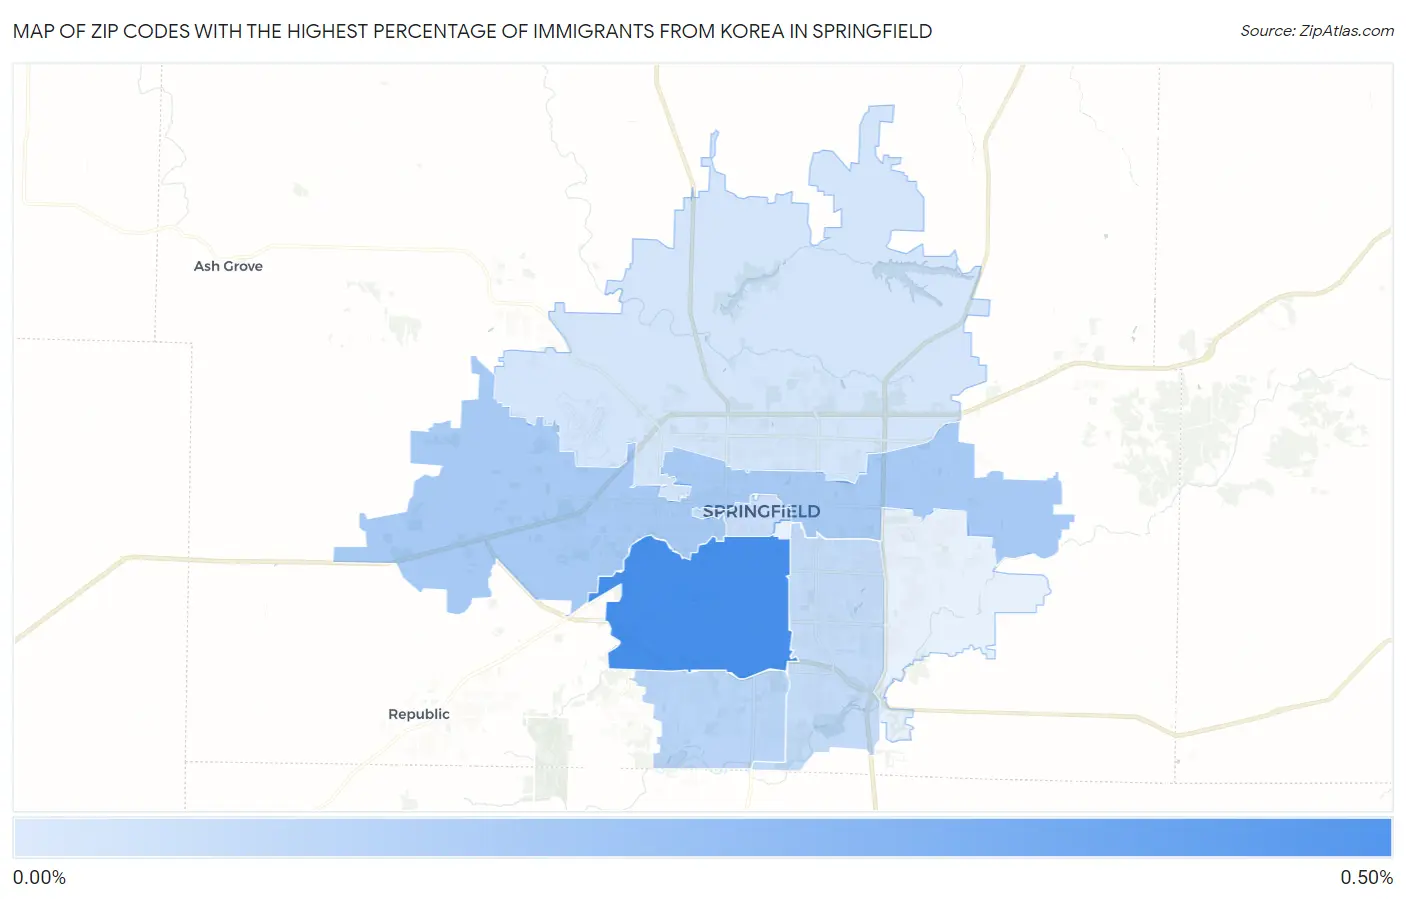
Zip Codes with the Highest Percentage of Immigrants from Korea in Springfield, MO
| Zip Code | Korea | vs State | vs National | |
| 1. | 65807 | 0.49% | 0.12% (+0.372)#30 | 0.31% (+0.182)#2,282 |
| 2. | 65802 | 0.17% | 0.12% (+0.052)#72 | 0.31% (-0.138)#5,130 |
| 3. | 65810 | 0.11% | 0.12% (-0.011)#100 | 0.31% (-0.201)#6,316 |
| 4. | 65804 | 0.082% | 0.12% (-0.040)#112 | 0.31% (-0.230)#7,073 |
| 5. | 65806 | 0.061% | 0.12% (-0.061)#123 | 0.31% (-0.251)#7,641 |
| 6. | 65803 | 0.033% | 0.12% (-0.090)#137 | 0.31% (-0.280)#8,541 |
1
Common Questions
What are the Top 5 Zip Codes with the Highest Percentage of Immigrants from Korea in Springfield, MO?
Top 5 Zip Codes with the Highest Percentage of Immigrants from Korea in Springfield, MO are:
What zip code has the Highest Percentage of Immigrants from Korea in Springfield, MO?
65807 has the Highest Percentage of Immigrants from Korea in Springfield, MO with 0.49%.
What is the Percentage of Immigrants from Korea in Springfield, MO?
Percentage of Immigrants from Korea in Springfield is 0.22%.
What is the Percentage of Immigrants from Korea in Missouri?
Percentage of Immigrants from Korea in Missouri is 0.12%.
What is the Percentage of Immigrants from Korea in the United States?
Percentage of Immigrants from Korea in the United States is 0.31%.